Attached files
| file | filename |
|---|---|
| 8-K - U. S. Premium Beef, LLC | esuspb8k.htm |
![]()
| Staff talks to producers about the importance of exports | When marketing on a grid, more days on feed can pay | |
| USPB Serves Yakiniku at NCBA For the second year in a row, USPB staff served the Korean style barbecue, Yakiniku, which is cut from the beef short rib, at the opening session of the National Cattlemen’s Beef Association (NCBA) trade show in Denver, CO. The event was an excellent opportunity for staff to talk to producers about USPB’s $35 per head age and source verified premium, how producers can still market cattle through our company and the importance of exports to U.S. cattle markets. That importance was never more apparent than last year. U.S. beef plus beef variety meat exports set an all-time, single-year value record at $4.08 billion in 2010 according to the U.S. Meat Export Federation. This was 6 percent above the previous record set in 2003, and 32 percent higher than the value of 2009 U.S. beef and beef variety meat exports. On a volume basis, 2010 levels, at 1.07 million metric tons, were up 19% compared to 2009 totals. The 2010 total was equivalent to 84% of the record 2003 volume. The value of beef and beef variety meat exports in 2010 accounted for $153.09 per fed steer and heifer processed in the United States last year. That’s up from $118.27 per head in 2009. On a monthly basis last year, the per head value of beef exports was especially strong in the last three months of the year, exceeding $170 per head. U.S. beef and beef variety meat exports represented 11.7% of total U.S. production in 2010 com-pared to 9.9% in 2009. Mexico remained the top export market for U.S. beef, at $819.0 million, even though the value of exports to that country was down 10% compared to 2009. Canada remained the United State’s second largest customer, with 15% growth to a record $733.4 million, followed by Japan, up 36% at $639.5 million. Korea, which led the top five markets in growth last year, was up 140% to $517.9 million. Taiwan rounded out the top five with beef export value up 53% to a record $216.3 million.♦ |
The Economics of Days on Feed By Brian Bertelsen, VP, Field Operations Cost of gain is the “yardstick” that is often used to compare feedlot performance. That’s because it’s an important ingredient in profitable cattle feeding. However, cost of gain is not profit. One problem with cost of gain (COG) is that it is measured per pound of live weight (LW) gain. However, when selling on a grid, you are selling carcass weight. Also, as cattle are fed longer, dressing percent, or yield benefit, increases as do Quality grade premiums which are the two biggest contributors to overall grid premium. However, Yield grade discounts can also increase along with the potential for heavy weight discounts. So, how do days on feed affect profit when selling on a grid with high priced corn? To conduct this analysis, we used a projection spreadsheet to emulate the steer lots purchased by USPB during fiscal year 2010 that had feedlot placement weights from 700 to 799 pounds. A unique aspect of this projection is that it objectively calculates, or “feeds”, the cattle every day keeping them on the same plane of performance. That way, we can look at the effects of different days on feed. So the actual performance of 7-weight steers was the baseline. Those “base” values are shown in the box below. We consulted with some of our custom feedlots during the week ending February 5, to use realistic values for the projection which are also listed in the box below. Corn was priced at $6.50/bushel. The projection was recalculated with plus or minus one, two, three and four weeks from the “base”value of 155 days on feed (DOF), which was the actual average of the 7-weight steers purchased by USPB. The resulting feedlot performance is listed in the table on page 2.
...continued on page 2
|
Reproduction of any part of this newsletter is expressly forbidden without written permission of U.S. Premium Beef.
|
The Economics of Days on Feed... |
continued from page 1 |
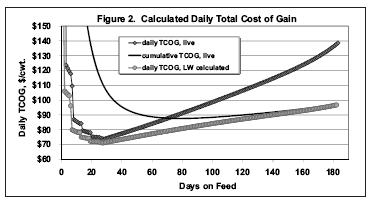
increasing and since body weight is still low, maintenance requirements are still low. Then, as body weight increases and energy level plateaus, gain will begin to decrease. The solid line is the live cumulative ADG that would be calculated if the cattle were “closed out’ on each of those DOF. The grey circles represent the carcass daily gain. This is calculated with the help of the serial slaughter research. Notice that these values are also decreasing, but at a much slower rate. The reason for this is that yield, or dressing percentage, is increasing as cattle are fed longer. Figure 2 shows the total cost of gain (TCOG). The daily TCOG, live line shows how COG increases dramatically per unit of live weight gain. However, the daily TCOG, LW calculated line is the carcass TCOG brought back to a live equivalent using a constant yield. This allows us to look at a value that is carcass driven, but is a value comparable to the cost per unit of live weight. In other words, it is driven by carcass weight, but expressed on a live weight basis, since that is what the industry is accustomed to using. Notice that the carcass gain (LW calculated) is also increasing with DOF, but at a much slower rate of increase. Again, |
|
|
performance as the “base” at 155 DOF. From that carcass data, grid premiums were calculated for each length of feeding. Average grid inputs from fiscal year 2010 were used. These inputs included the second lowest Choice/Select spread of $5.47/cwt and the lowest CAB premium of $3.18/cwt in company history. For comparison, grids were then recalculated using more typical values including an $8/cwt Choice/Select spread and $3.75/cwt CAB premium. Since grid premiums compare the total grid payment versus the payment on a cash, live market, we can simply add the premium to the live projection profit to calculate the profit when selling on the USPB Base grid. Carcass data, grid premiums and profit are also listed in the table below. As mentioned earlier, the projection “feeds” the cattle every day. This allows us to look at changes in performance and economics as DOF increase. Figure 1 shows the calculated live weight gain (live daily gain) each day on feed. This is not average daily gain (ADG) but the gain for each single day. Gain increases dramatically as we move through transition rations, which increase in energy density (calories). Feed intake is also |
|||
Projected Performance at Different Days on Feed
|
Weeks |
-4 |
-3 |
-2 |
-1 |
BASE |
+1 |
+2 |
+3 |
+4 |
|
DOF |
127 |
134 |
141 |
148 |
155 |
162 |
169 |
176 |
183 |
|
ADG, lbs./day |
3.81 |
3.77 |
3.73 |
3.69 |
3.65 |
3.61 |
3.56 |
3.52 |
3.47 |
|
DM F/G, lbs. |
5.64 |
5.70 |
5.76 |
5.82 |
5.88 |
5.94 |
6.00 |
6.06 |
6.12 |
|
TCOG, $ |
91.16 |
91.96 |
92.80 |
93.66 |
94.55 |
95.46 |
96.39 |
97.34 |
98.33 |
|
LW, lbs. |
1,234 |
1,255 |
1,276 |
1,296 |
1,316 |
1,334 |
1,352 |
1,369 |
1,385 |
|
HCW, lbs. |
773 |
790 |
807 |
824 |
840 |
856 |
872 |
886 |
900 |
|
Yield, % |
62.64 |
62.93 |
63.23 |
63.52 |
63.82 |
64.12 |
64.41 |
64.71 |
65.00 |
|
Prime, % |
0.00 |
0.23 |
0.63 |
1.03 |
1.43 |
1.83 |
2.23 |
2.63 |
3.03 |
|
Choice & Prime, % |
49.62 |
54.00 |
58.46 |
62.56 |
67.07 |
71.13 |
74.64 |
78.26 |
81.38 |
|
Ungraded, % |
5.04 |
3.77 |
2.86 |
2.01 |
1.31 |
0.46 |
0.00 |
0.00 |
0.00 |
|
CAB, % |
10.29 |
12.14 |
13.97 |
15.99 |
18.48 |
20.88 |
23.18 |
25.38 |
27.03 |
|
BCPR, % |
9.79 |
10.40 |
10.96 |
11.35 |
11.83 |
12.47 |
13.14 |
13.88 |
14.78 |
|
YG 1, % |
25.50 |
21.66 |
17.86 |
14.19 |
10.64 |
7.49 |
4.61 |
1.99 |
0.00 |
|
YG 2, % |
40.79 |
41.98 |
42.83 |
43.36 |
43.53 |
43.11 |
42.23 |
40.99 |
39.54 |
|
YG 3, % |
30.64 |
32.54 |
34.90 |
37.17 |
39.43 |
41.54 |
43.63 |
45.68 |
47.00 |
|
YG 4, % |
3.07 |
3.82 |
4.41 |
5.25 |
6.05 |
7.29 |
8.68 |
10.05 |
11.73 |
|
YG 5, % |
0.00 |
0.00 |
0.00 |
0.03 |
0.35 |
0.57 |
0.85 |
1.29 |
1.73 |
|
Light Weight, % |
0.36 |
0.13 |
0.00 |
0.00 |
0.00 |
0.00 |
0.00 |
0.00 |
0.00 |
|
Heavy Weight, % |
0.00 |
0.00 |
0.35 |
1.61 |
3.16 |
4.76 |
6.88 |
9.98 |
15.21 |
|
Cash Profit/hd., $ |
20.98 |
21.20 |
20.77 |
19.72 |
18.07 |
15.82 |
12.98 |
9.53 |
5.46 |
|
Premium/hd.1,3, $ |
-10.20 |
-2.84 |
5.89 |
13.96 |
22.85 |
30.73 |
37.02 |
41.80 |
42.85 |
|
Grid Profit/hd.1, $ |
10.78 |
18.36 |
26.66 |
33.68 |
40.92 |
46.55 |
50.00 |
51.33 |
48.31 |
|
Premium/hd.2,3, $ |
-9.31 |
-1.65 |
8.23 |
17.63 |
28.01 |
37.35 |
45.01 |
51.23 |
53.62 |
|
Grid Profit/hd.2, $ |
11.67 |
19.55 |
29.00 |
37.35 |
46.08 |
53.17 |
57.99 |
60.76 |
59.08 |
1C/S spread = $5.47; Prime = $15.42; CAB = $3.18 (Fiscal Year 2010 actual averages)
2C/S spread = $8.00; Prime = $25.00; CAB = $3.75
3Grid premiums were calculated using with the current Base grid using a 55% Choice and Prime threshold.
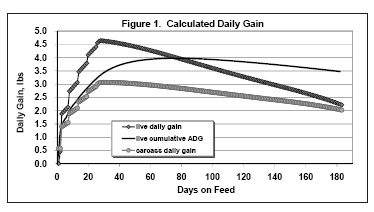 the reason these two COG lines are spreading apart is because yield, or dressing percentage, is increasing with DOF. These graphs show the inherent differences in cost of production per unit of live weight versus carcass weight. The table on page two shows the values for the entire feeding period at different DOF. Notice how average daily gain (ADG) decreases. If the cattle were fed 127 days, or four weeks less than the actual average, they would have a cumulative ADG of 3.81. If fed 183 days, or four weeks more than the actual average, their ADG would be 3.47. Feed conversion (DM F/G), or the amount of zero moisture feed required for a pound of live weight gain, increases. Likewise, TCOG increases with additional DOF. However, LW, Yield and Quality grades are improving as DOF increases. All of these factors contribute to a greater selling value per head. Yield Grades increase, or become fatter, with additional days on feed. After 134 DOF, heavy weight discounts begin to accumulate up to a maximum of over 15% at 183 DOF. The Cash Profit/head values take all costs into account and represent the profit per head if the cattle were sold on a cash, live market of $111/cwt. This analysis assumes that the cash price remains constant over this entire time period. This value was chosen because it is the approximate value currently offered by USPB as a basis bid contract relative to the current August futures price for July delivery.
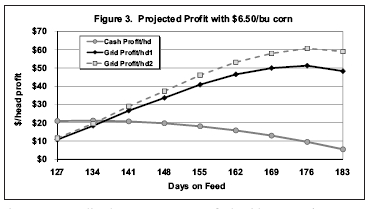
Figure 3 shows the Cash Profit/head from the table on page two as the gray line with circles. The maximum profit is at 134 days, or 3 weeks earlier than the USPB 7-weight steer average from last year. When selling on a cash market, it makes sense to sell early, especially with high corn prices. The solid black line with the diamonds in Figure 3 shows the projected grid profit (Grid Profit/head1) using the average grid
|
inputs from last year. This shows that if you really could sell cattle three or four weeks “early” on the cash market, you would make more than selling on a grid, at 127 or 134 DOF. However, if you were to feed longer, and market on the USPB Base grid, overall profit would be significantly higher. In fact, this suggests that feeding longer than the actual average of 155 days would continue to increase profit, even though COG is increasing and Yield grade and heavy weight discounts are increasing. As you feed cattle longer, their carcass weight increases, so you have more pounds to sell. Also, yield, or dressing percentage increases and we’ve shown how carcass TCOG increases with DOF, but at a slower rate than it does on a live basis. Finally, Quality grade premiums and yield benefit increase with DOF which increases the overall premium. Grid premiums are not profit, but since they increase the total revenue, they are contributing to greater profit in this example—even though live TCOG increases.
So even with high corn prices, staying the course and marketing on a grid can improve profits and those profits can be greater with added DOF. These grid premiums were calculated with very conservative grid inputs. As those grid inputs, such as the Choice/Select spread increase, the reward from feeding longer increases even more. The Grid Profit/head2 line in Figure 3 reflects the higher grid inputs foot noted in the table on page 2. We also recalculated these projections at even higher corn prices, keeping everything else constant. As corn price increases, the relationship between grid and cash profits remain very similar. The cash profit decreases even more rapidly with added DOF. Grid profits will eventually be flatter and see less of an increased benefit with added DOF, but the relationship between the two still shows that the economics of marketing on a grid are better with added DOF. Remember, this exercise was not a research trial. It is a scenario, using a projection spreadsheet. The spreadsheet uses proven equations for predicting feed intake and calculating performance based on the Net Energy Equations. The baseline values are actual averages of the 7-weight steers USPB purchased in fiscal year 2010 and the adjustments to their actual carcass data are based on serial slaughter research. We are not trying to predict future corn or cattle markets. Instead, this reminds us that COG is different on a carcass versus a live basis and that profit reacts very differently when marketing on a grid than it does on the cash market with added DOF.♦
|
|
Qualified Seedstock Suppliers The following USPB Qualified Seedstock Suppliers (QSS) will conduct sales during February through May. See USPB’s web page for links that detail sale times and locations.♦ |
|||
|
Cow Camp, Inc. CB Farms Spring Valley Ranch Thorstenson Gelbvieh & Angus Lyons Ranch Bar Arrow Cattle Co. Briarwood Farms Marshall & Fenner Molitor Angus Ranch Larson Angus Ranch Pelton Simmental/Red Angus Oleen Brothers Rishel Angus Gardiner Angus Ranch Mogck & Sons Angus Heartland Simmental and Angus Chair Rock Angus Spring Female Only |
February 25
March 7
April 2 |
||
|
In addition, the following USPB QSS members are selling bulls at private treaty during the winter and spring: |
|||
|
Blair Brothers Angus Dalebanks Angus McCurry Angus |
Chair Rock Angus Harms Plainview Ranch Trumbull Genetics |
||
|
USPB Non-Conditional Unit Trade Report |
|||
|
|
FY 2011 Trades |
Most Recent Trade–01/2011 |
|
|
# Class A Units w/Del. Rights |
550 |
100 |
|
|
Avg. Price/ Class A Unit |
$178.68 |
$169.00 |
|
|
# Class B Units |
550 |
100 |
|
|
Avg. Price/ Class B Unit |
$407.00 |
$451.00 |
|
|
Benchmark Performance Data Table |
||
|
Base Grid Cattle Harvested in KS Plants 1/09/11 to 2/05/11 |
||
|
(Numbers |
Base Grid |
|
|
All |
Top 25% |
|
|
Yield |
64.26 |
65.00 |
|
Prime |
3.07 |
4.37 |
|
CH & PR |
77.96 |
82.33 |
|
CAB |
21.69 |
25.96 |
|
BCP |
16.39 |
16.53 |
|
Ungraded |
1.37 |
0.80 |
|
Hard Bone |
0.98 |
0.55 |
|
YG1 |
8.64 |
7.78 |
|
YG2 |
37.24 |
34.90 |
|
YG3 |
43.15 |
45.02 |
|
YG4 |
10.13 |
11.41 |
|
YG5 |
0.84 |
0.88 |
|
Light Weight |
0.37 |
0.30 |
|
Heavy Weight |
3.01 |
2.19 |
|
Average Grid Premiums/Discounts ($/Head) |
||
|
Quality Grade |
$22.43 |
$30.85 |
|
Yield Benefit |
$13.33 |
$28.68 |
|
Yield Grade |
-$4.03 |
-$5.15 |
|
Out Weight |
-$4.42 |
-$3.24 |
|
Steer/Heifer |
$0.89 |
$0.96 |
|
ASV |
$3.12 |
$9.51 |
|
Natural |
$1.07 |
$3.69 |
|
Total Premium |
$32.39 |
$65.30 |
|
Call USPB With ASV Cattle Projections üAge verified cattle projections are required from feedyards who want to receive USPB’s $35 per head ASV premium, which is set through May 2011, as long as export trade with Japan is open and National Beef is approved for that trade. Market rates will be used after May 2011. Please call our office at 866-877-2525 when you place ASV cattle on feed.♦
|
||