Attached files
| file | filename |
|---|---|
| 8-K - FORM 8-K - SPARTON CORP | d8k.htm |
| EX-99.1 - SCRIPT FOR CONFERENCE CALL - SPARTON CORP | dex991.htm |
 Fiscal
2011
2
nd
Quarter
Financial Results
Conference Call
February 2010
Exhibit 99.2 |
 2
Safe Harbor Statement
Safe Harbor Statement
Certain
statements
herein
constitute
forward-looking
statements
within
the
meaning
of
the
Securities
Act
of
1933,
as
amended
and
the
Securities
Exchange
Act
of
1934,
as
amended.
When
used
herein,
words
such
as
“believe,”
“expect,”
“anticipate,”
“project,”
“plan,”
“estimate,”
“will”
or
“intend”
and
similar
words
or
expressions
as
they
relate
to
the
Company
or
its
management
constitute
forward-
looking
statements.
These
forward-looking
statements
reflect
our
current
views
with
respect
to
future
events
and
are
based
on
currently
available
financial,
economic
and
competitive
data
and
our
current
business
plans.
The
Company
is
under
no
obligation
to,
and
expressly
disclaims
any
obligation
to,
update
or
alter
its
forward-
looking
statements
whether
as
a
result
of
such
changes,
new
information,
subsequent
events
or
otherwise.
Actual
results
could
vary
materially
depending
on
risks
and
uncertainties
that
may
affect
our
operations,
markets,
prices
and
other
factors.
Important
factors
that
could
cause
actual
results
to
differ
materially
from
those
forward-looking
statements
include
those
contained
under
the
heading
of
risk
factors
and
in
the
management’s
discussion
and
analysis
contained
from
time-to-
time
in
the
Company’s
filings
with
the
Securities
and
Exchange
Commission. |
 3
•
Fiscal
2011
2
nd
Quarter
Consolidated
Results
•
2
nd
Quarter
Segmented
Operating
Results
•
Liquidity & Capital Resources
•
SMS
Colorado
2
nd
Quarter
Financial
Results
•
Growth Investments
•
Outlook
•
Q & A
Today’s Agenda
Today’s Agenda |
 4
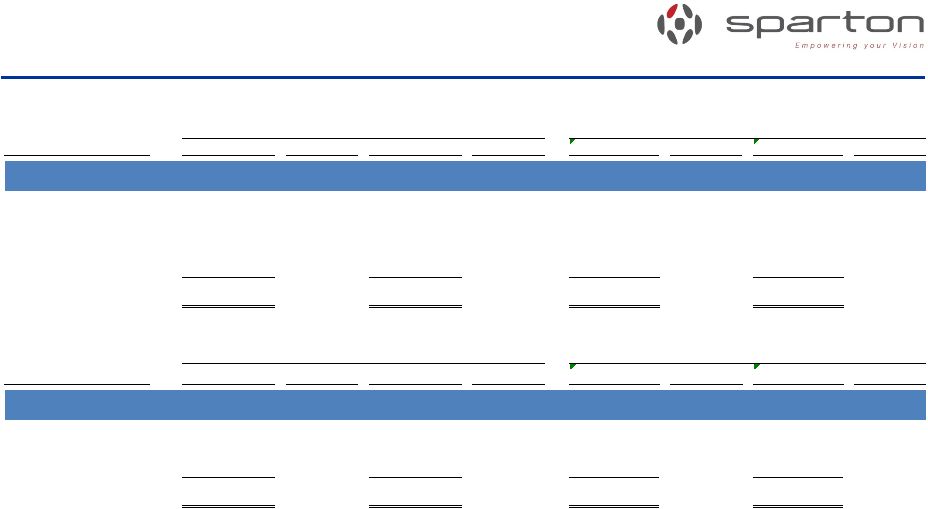
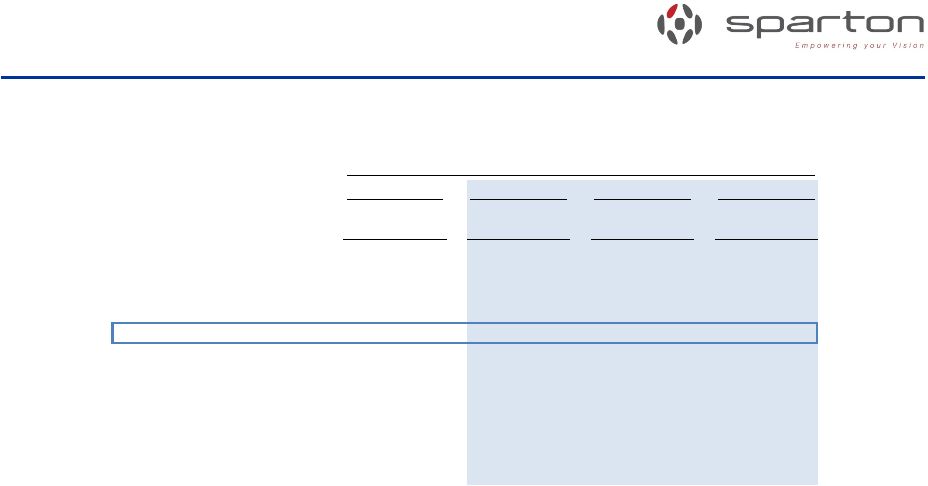
Consolidated Financial Results
Consolidated Financial Results
Fiscal 2011 Q2
Fiscal 2011 Q2
($ in 000’s, except per share)
2010
2009
Net Sales
46,331
47,223
(892)
Gross Profit
7,547
8,135
(588)
16.3%
17.2%
Selling and Administrative Expense
5,689
5,109
580
Internal R&D Expense
155
-
155
Restructuring / Impairment Charges
-
1,007
(1,007)
Gain On Acquisition
-
-
- Operating Income
1,581
1,479
102
3.4%
3.1%
Income Before Provision For (Benefit From) Income Tax
1,549
1,319
230
Provision For (Benefit From) Income Taxes
114
(1,929)
2,043
Net Income
1,435
3,248
(1,813)
3.1%
6.9%
Income per Share, Basic and Diluted
0.14
0.33
(0.19)
3 Months ending Dec 31,
Year over
Year
Variance |
 5
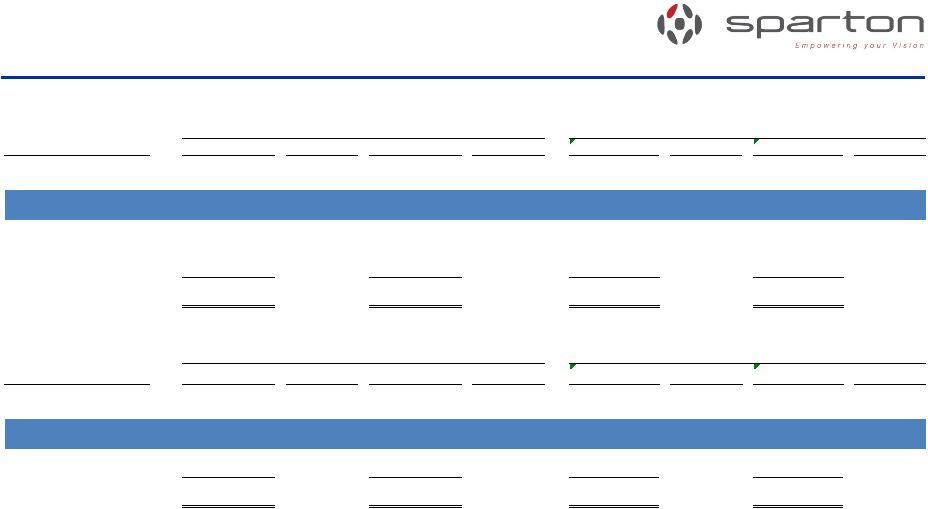
Medical Operating Results
Medical Operating Results
SEGMENT
FY11
% of Total
FY10
% Change
2010
% of Total
2009
% Change
Medical
$ 25,650
55%
$ 17,358
48%
$ 44,695
49%
$ 36,914
21%
EMS
10,512
23%
14,324
-27%
22,840
25%
31,927
-28%
DSS
13,179
28%
19,022
-31%
30,776
33%
32,367
-5%
Eliminations
(3,010)
-6%
(3,481)
-14%
(6,213)
-7%
(5,881)
6%
Totals
$ 46,331
100%
$ 47,223
-2%
$ 92,098
100%
$ 95,327
-3%
SEGMENT
FY11
GP %
FY10
GP %
2010
GP %
2009
GP %
Medical
$ 3,790
14.8%
$ 2,463
14.2%
$ 5,657
12.7%
$ 5,397
14.6%
EMS
749
7.1%
711
5.0%
1,656
7.3%
1,729
5.4%
DSS
3,008
22.8%
4,961
26.1%
7,260
23.6%
8,381
25.9%
Totals
$ 7,547
16.3%
$ 8,135
17.2%
$ 14,573
15.8%
$ 15,507
16.3%
($ in 000’s, except per share)
2nd Quarter Sales
2nd Quarter Gross Profit
Fiscal Year Sales
Fiscal Year Gross Profit |
 6
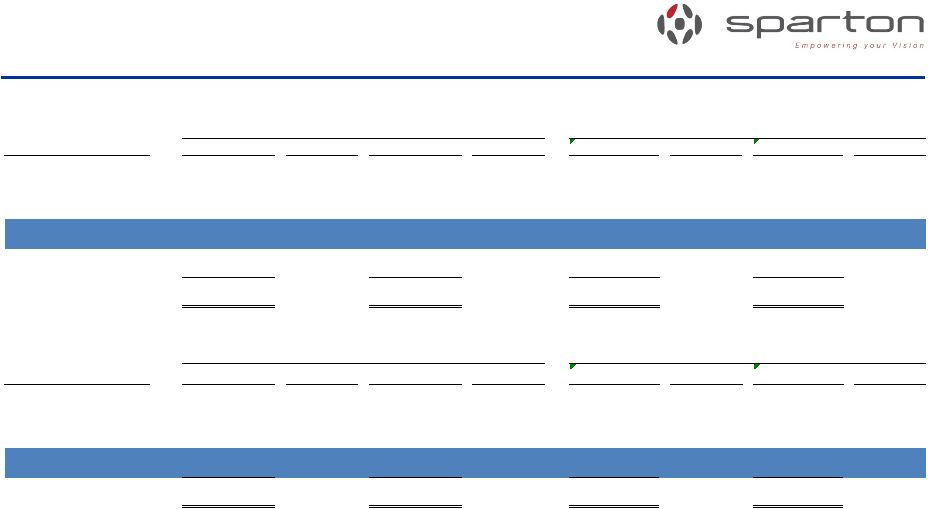
EMS Operating Results
EMS Operating Results
SEGMENT
FY11
% of Total
FY10
% Change
2010
% of Total
2009
% Change
Medical
$ 25,650
55%
$ 17,358
48%
$ 44,695
49%
$ 36,914
21%
EMS
10,512
23%
14,324
-27%
22,840
25%
31,927
-28%
DSS
13,179
28%
19,022
-31%
30,776
33%
32,367
-5%
Eliminations
(3,010)
-6%
(3,481)
-14%
(6,213)
-7%
(5,881)
6%
Totals
$ 46,331
100%
$ 47,223
-2%
$ 92,098
100%
$ 95,327
-3%
SEGMENT
FY11
GP %
FY10
GP %
2010
GP %
2009
GP %
Medical
$ 3,790
14.8%
$ 2,463
14.2%
$ 5,657
12.7%
$ 5,397
14.6%
EMS
749
7.1%
711
5.0%
1,656
7.3%
1,729
5.4%
DSS
3,008
22.8%
4,961
26.1%
7,260
23.6%
8,381
25.9%
Totals
$ 7,547
16.3%
$ 8,135
17.2%
$ 14,573
15.8%
$ 15,507
16.3%
($ in 000’s, except per share)
2nd Quarter Sales
2nd Quarter Gross Profit
Fiscal Year Sales
Fiscal Year Gross Profit |
 7
DSS Operating Results
DSS Operating Results
SEGMENT
FY11
% of Total
FY10
% Change
2010
% of Total
2009
% Change
Medical
$ 25,650
55%
$ 17,358
48%
$ 44,695
49%
$ 36,914
21%
EMS
10,512
23%
14,324
-27%
22,840
25%
31,927
-28%
DSS
13,179
28%
19,022
-31%
30,776
33%
32,367
-5%
Eliminations
(3,010)
-6%
(3,481)
-14%
(6,213)
-7%
(5,881)
6%
Totals
$ 46,331
100%
$ 47,223
-2%
$ 92,098
100%
$ 95,327
-3%
SEGMENT
FY11
GP %
FY10
GP %
2010
GP %
2009
GP %
Medical
$ 3,790
14.8%
$ 2,463
14.2%
$ 5,657
12.7%
$ 5,397
14.6%
EMS
749
7.1%
711
5.0%
1,656
7.3%
1,729
5.4%
DSS
3,008
22.8%
4,961
26.1%
7,260
23.6%
8,381
25.9%
Totals
$ 7,547
16.3%
$ 8,135
17.2%
$ 14,573
15.8%
$ 15,507
16.3%
($ in 000’s, except per share)
2nd Quarter Sales
2nd Quarter Gross Profit
Fiscal Year Sales
Fiscal Year Gross Profit |
 8
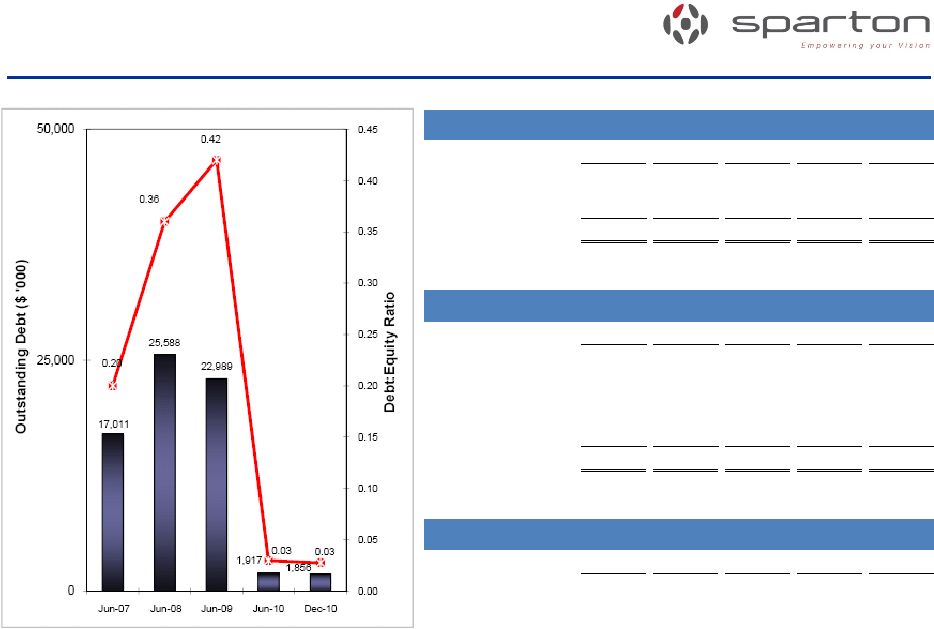
Liquidity & Capital Resources
Liquidity & Capital Resources
($ in '000)
Dec-09
Mar-10
Jun-10
Sep-10
Dec-10
Cash and equivalents
12,012
16,144
30,589
27,281
29,941
LOC Availability
15,461
15,868
16,897
17,769
17,389
Total
27,473
32,012
47,486
45,050
47,330
($ in '000)
Dec-09
Mar-10
Jun-10
Sep-10
Dec-10
Credit Revolver
-
-
-
-
-
Long Bank Term Debt
-
-
-
-
-
Former Astro Owners
1,029
1,029
-
-
-
IRB (Ohio)
1,973
1,945
1,917
1,887
1,856
Total
3,002
2,974
1,917
1,887
1,856
($ in '000)
Dec-09
Mar-10
Jun-10
Sep-10
Dec-10
Net Inventory
31,888
28,808
26,514
36,629
35,076
Cash Availability
Debt
Inventory |
 9
SMS Colorado
2
nd
Quarter Financial Results
($ in 000’s)
2009
2010
2010
2010
Colorado
Pro Forma
Colorado
Strongsville
Total Medical
Net Sales
$ 6,990
$ 11,356
$ 14,294
$ 25,650
Gross Profit
(99)
1,765
2,025
3,790
Gross Margin
-1.4%
15.5%
14.2%
14.8%
Operating Income (Loss)
(430)
1,110
740
1,850
Operating Margin
-6.2%
9.8%
5.2%
7.2%
Net Income (Loss)
$
(44) $ 1,204
$
- $ 1,204
Net Profit Margin
-0.6%
10.6%
0.0%
4.7%
3 months ending Dec 31, |
 10
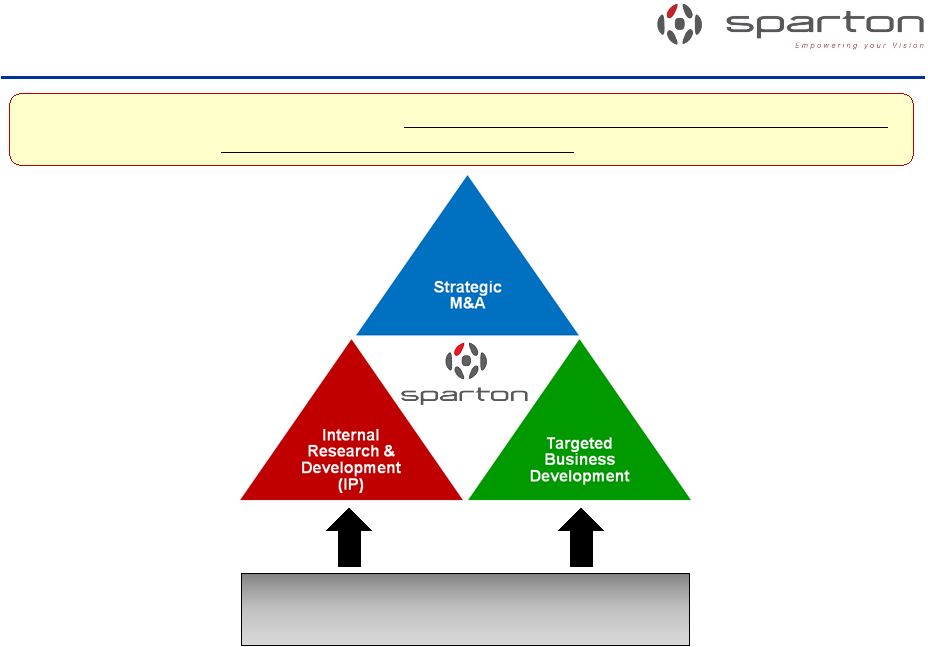
Growth Investments
Growth Investments
Focus:
Use
growth
investments
to
achieve
sustainable
year-over-year
revenue
and
profit
increases
and
to
further
place
protective
barriers
around
Sparton.
Supported by market research &
go-to-market programs |
 11
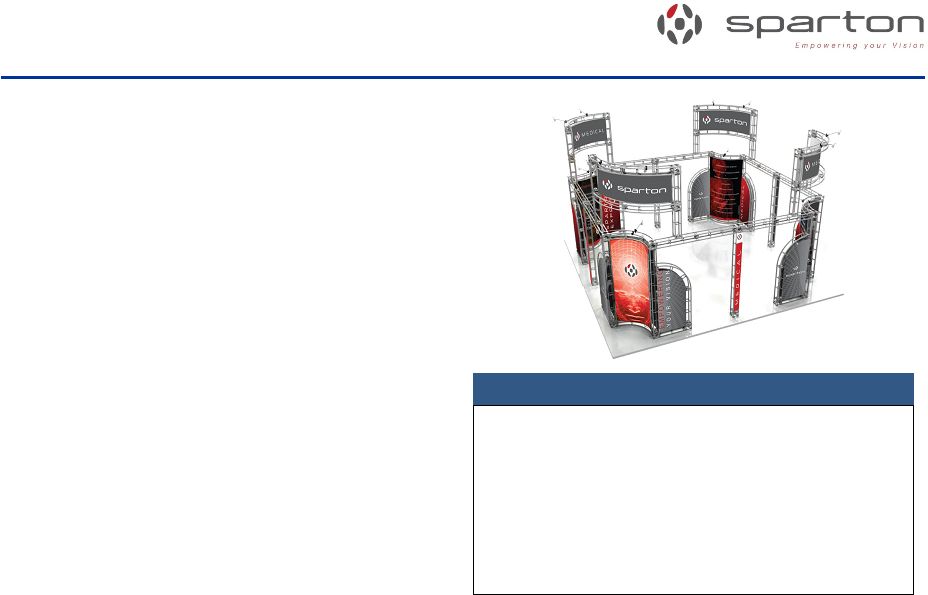
Business Development
Business Development
Marketing Initiative Progress
Marketing Initiative Progress
•
New Brand Identity
–
Logo
–
Tagline
–
Key Attributes
•
Trade Show Booth
–
Design Completed
–
Construction Phase
–
CY2011 Schedule Presented
–
Preview: January 14th, 2011
–
Launch: MD&M-West Feb 2011
•
Collateral Materials
–
PowerPoint, Brochures, Etc.
•
Website
–
Launch Corporate & Medical first
–
DSS and Complex Systems to follow
Schedule of Events
National Sales Meeting
Jan 13
Schaumburg
Cross Sell & Goal Setting
Launch New Website
Feb 8
Worldwide Web
Update Corp & Medical 1st
MD & M West
Feb 8-10
Anaheim
Medical
AmCon
(regional)
Mar 2-3
Orlando
EMS Contract Manufacturing
SATCON Expo
Mar 14-17
Washington DC
Navigation & Exploration
Navy League
Apr 11-13
Maryland
Advanced Security
AmCon
(regional)
Apr 26-27
Denver
EMS Contract Manufacturing
MD & M East
Jun 7-10
New York
Medical
AUVSI
Aug 16-19
Washington
Navigation & Exploration
SEG ‘11 (O&G)
Sep 18-23
San Antonio
Oil & Gas Exploration
MD & M Twin City
Nov 2-3
Minneapolis
Medical
BioMEDevice
West
Dec 6-7
San Jose
Medical |
 12
•
Focus on sustained profitability
–
Continue margin improvements in EMS
–
Further improvements in operating performance through lean and quality
efforts •
Implement the strategic growth plan
–
Anticipate modest organic revenue growth
–
Enhance the Business Development organization
–
Develop and launch a new marketing strategy
–
Invest in new product development
•
Delphi Medical Systems will continue to be accretive
•
Continue to look at complementary and compatible acquisitions
Fiscal 2011 Outlook
Fiscal 2011 Outlook |
 13
Q & A
Q & A |