Attached files
| file | filename |
|---|---|
| 8-K - FORM 8-K - GAIN Capital Holdings, Inc. | y81629e8vk.htm |
| EX-99.1 - EX-99.1 - GAIN Capital Holdings, Inc. | y81629exv99w1.htm |
Exhibit 99.2
| 4th Quarter and Full Year 2010 Financial and Operating Results February 15, 2011 |
| Special Note Regarding Forward-Looking Information In addition to historical information, this presentation contains "forward-looking" statements that reflect management's expectations for the future. A variety of important factors could cause results to differ materially from such statements. These factors are noted throughout GAIN Capital's registration statement on Form S-1, as amended, as declared effective by the Securities and Exchange Commission on December 14, 2010, and include, but are not limited to, the actions of both current and potential new competitors, fluctuations in market trading volumes, financial market volatility, evolving industry regulations, errors or malfunctions in our systems or technology, rapid changes in technology, effects of inflation, customer trading patterns, the success of our products and service offerings, our ability to continue to innovate and meet the demands of our customers for new or enhanced products, our ability to successfully integrate companies we have acquired, changes in tax policy or accounting rules, fluctuations in foreign exchange rates, adverse changes or volatility in interest rates, as well as general economic, business, credit and financial market conditions, internationally or nationally. The forward-looking statements included herein represent GAIN Capital's views as of the date of this release. GAIN Capital undertakes no obligation to revise or update publicly any forward- looking statement for any reason unless required by law. 2 |

| Business Review Glenn Stevens, CEO |
| 2010 Recap 4 All contributed to record revenue achievement in 2010 and position GAIN for a strong 2011 Commitment to investment in brand and product development in 2009 set the tone for 2010 Product Expansion and Enhancement Addition of 9 FX pairs and 6 Equity Index CFDs Arabic offering Rollout of mobile trading applications for iPhone, Android, etc. Launch of GAIN GTX, ECN for institutional clients Approximately $240bn volume in 2010 Geographic Expansion Offices opened in Sydney, Singapore and Hong Kong Completed acquisition of Fortune (Japan) Corporate Development Acquisition of retail forex businesses of CMS Forex and MG Financial |

| 2011 Growth Initiatives 5 Growth initiatives will contribute to revenue in 2011 and beyond Geographic Expansion Continued investment in Australia and Asia Product Expansion and Enhancement Continued development of: Institutional ECN offering Mobile offering CFD products Language offerings and enhancements Corporate Development |
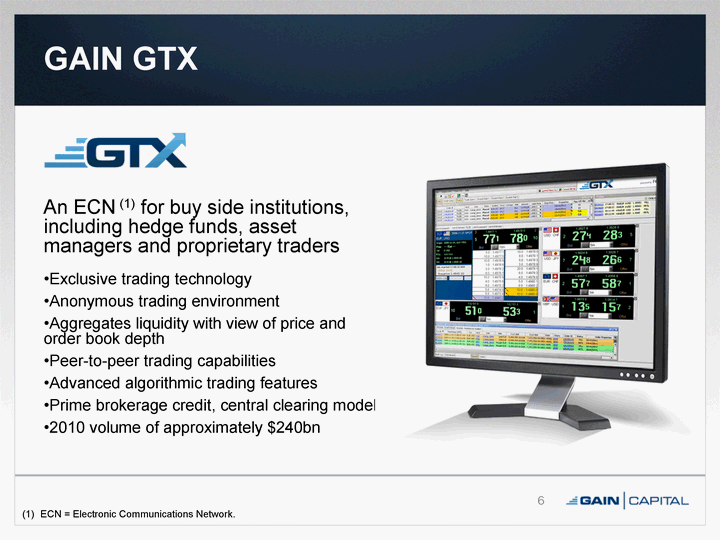
| GAIN GTX An ECN (1) for buy side institutions, including hedge funds, asset managers and proprietary traders Exclusive trading technology Anonymous trading environment Aggregates liquidity with view of price and order book depth Peer-to-peer trading capabilities Advanced algorithmic trading features Prime brokerage credit, central clearing model 2010 volume of approximately $240bn 6 ECN = Electronic Communications Network. |
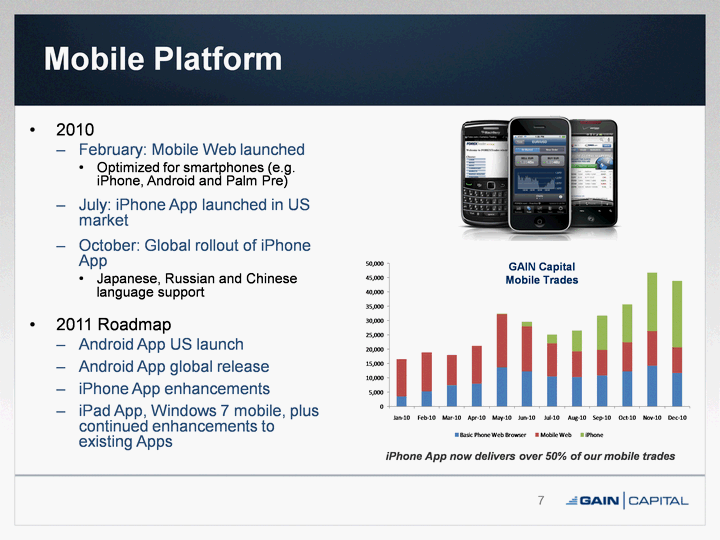
| Mobile Platform 2010 February: Mobile Web launched Optimized for smartphones (e.g. iPhone, Android and Palm Pre) July: iPhone App launched in US market October: Global rollout of iPhone App Japanese, Russian and Chinese language support 2011 Roadmap Android App US launch Android App global release iPhone App enhancements iPad App, Windows 7 mobile, plus continued enhancements to existing Apps 7 iPhone App now delivers over 50% of our mobile trades GAIN Capital Mobile Trades |
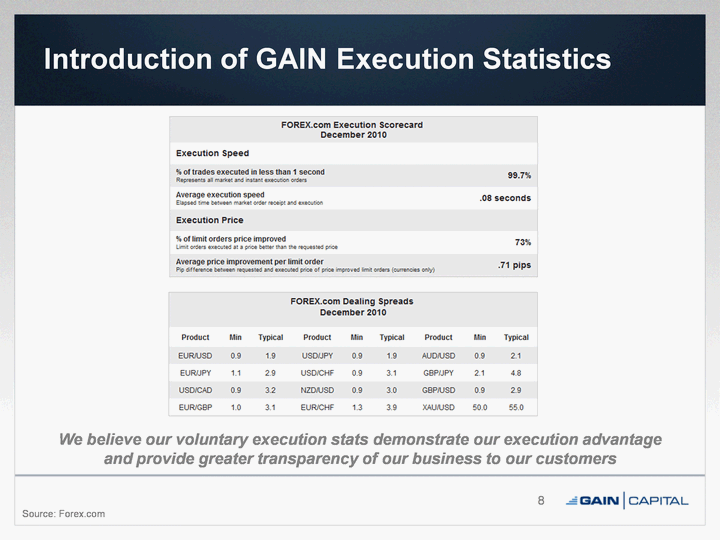
| Introduction of GAIN Execution Statistics 8 Source: Forex.com We believe our voluntary execution stats demonstrate our execution advantage and provide greater transparency of our business to our customers |
| Financial and Operating Metric Review Henry Lyons, CFO |

| Financial Results 10 Note: Dollars in millions. Adjusted net income is a non-GAAP financial measure that represents our net income/(loss) excluding (i)the change in fair value of the embedded derivative in our preferred stock and (ii) the after-tax impact of amortization of purchased intangibles. A reconciliation of net income to adjusted net income is available in the appendix to this presentation. Adjusted EBITDA is a non-GAAP financial measure that represents our earnings before interest, taxes, depreciation and amortization and excludes (i) the change in fair value of the embedded derivative in our preferred stock and (ii) the after-tax impact of amortization of purchased intangibles. A reconciliation of net income to adjusted EBITDA is available in the appendix to this presentation. |

| Operating Metrics(1) 11 Note: Trading volume in billions. Client assets in millions. Definitions for all our operating metrics are available in the appendix to this presentation. For period ending December 31. As of December 31. |
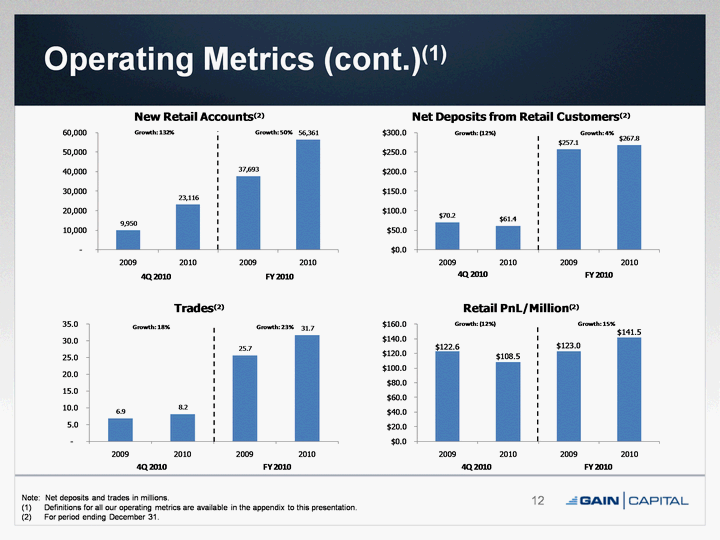
| Operating Metrics (cont.)(1) 12 Note: Net deposits and trades in millions. Definitions for all our operating metrics are available in the appendix to this presentation. For period ending December 31. |

| Monthly & Quarterly Metrics(1) Metrics to be disclosed monthly: Funded retail accounts New retail accounts Client assets Metrics to be disclosed quarterly (in addition to monthly metrics): Trading volume Retail Institutional Traded retail accounts (period & last 12 months) Net deposits from retail customers Trades Retail PnL/million 13 Definitions for all our operating metrics are available in the appendix to this presentation. |

| Closing Remarks Glenn Stevens, CEO |

| Summary Delivered record revenue and strong earnings growth in 2010 Growth in underlying metrics, particularly active accounts and client assets, expected to drive future growth Continued strategy of geographic and product expansion gives us a strong competitive position. 15 |

| Appendix |
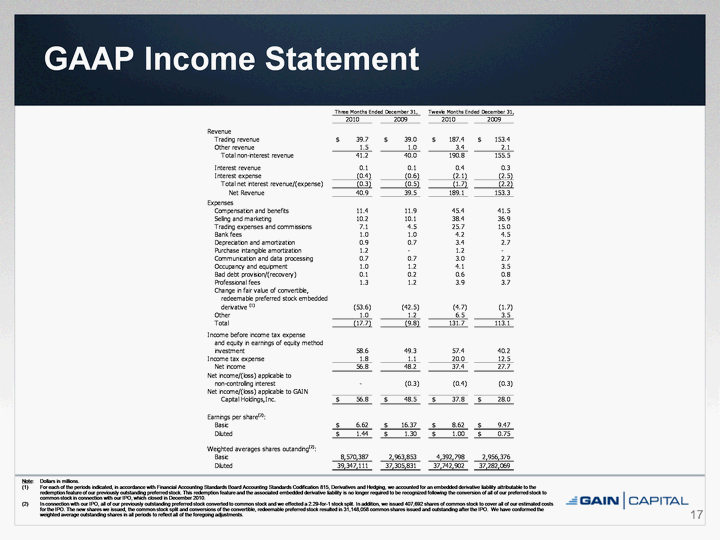
| GAAP Income Statement 17 Note: Dollars in millions. (1) For each of the periods indicated, in accordance with Financial Accounting Standards Board Accounting Standards Codification 815, Derivatives and Hedging, we accounted for an embedded derivative liability attributable to the redemption feature of our previously outstanding preferred stock. This redemption feature and the associated embedded derivative liability is no longer required to be recognized following the conversion of all of our preferred stock to common stock in connection with our IPO, which closed in December 2010. (2) In connection with our IPO, all of our previously outstanding preferred stock converted to common stock and we effected a 2.29-for-1 stock split. In addition, we issued 407,692 shares of common stock to cover all of our estimated costs for the IPO. The new shares we issued, the common stock split and conversions of the convertible, redeemable preferred stock resulted in 31,148,058 common shares issued and outstanding after the IPO. We have conformed the weighted average outstanding shares in all periods to reflect all of the foregoing adjustments. |
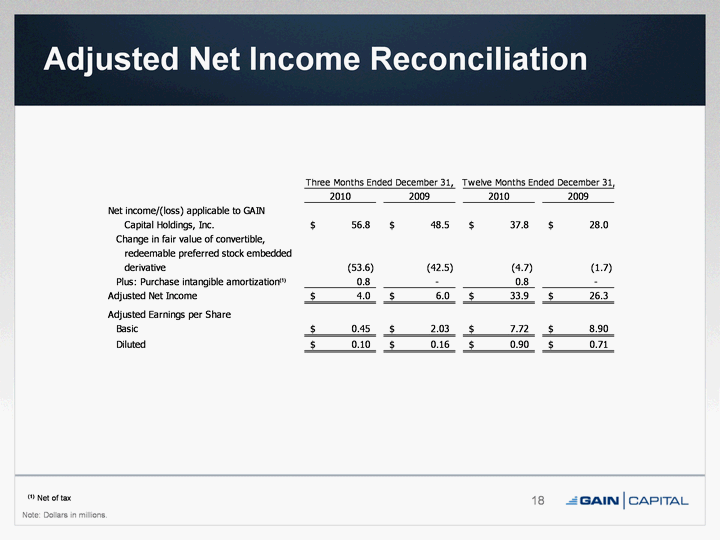
| Adjusted Net Income Reconciliation 18 Note: Dollars in millions. (1) (1) Net of tax |
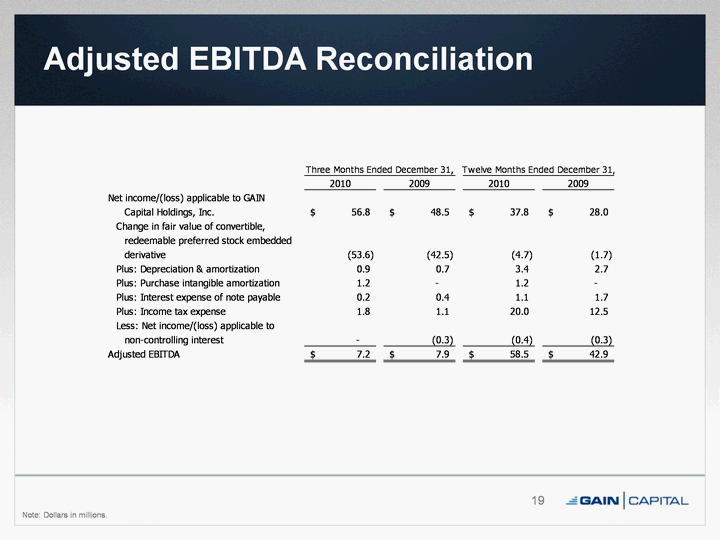
| Adjusted EBITDA Reconciliation 19 Note: Dollars in millions. |
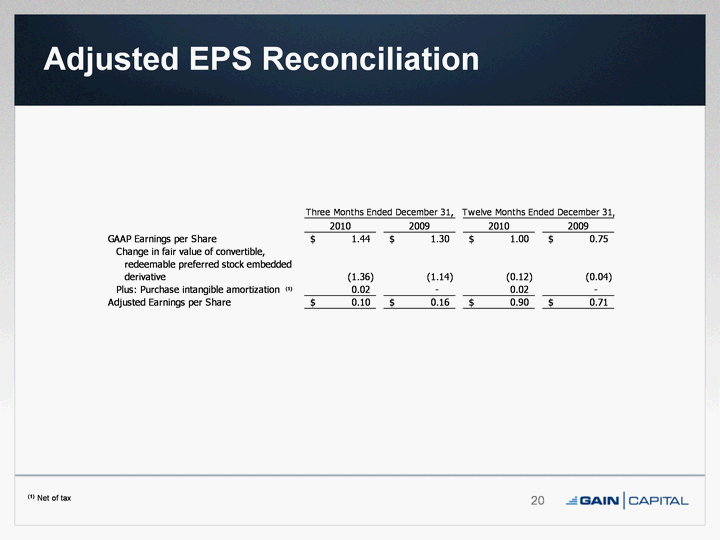
| Adjusted EPS Reconciliation 20 (1) Net of tax (1) |
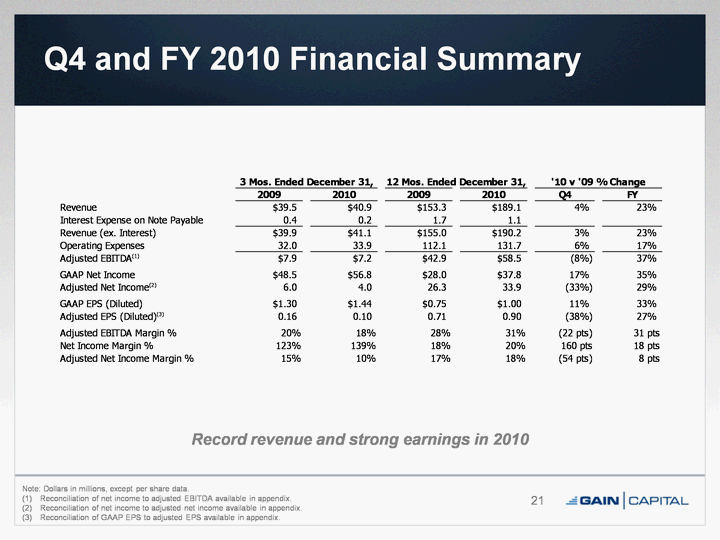
| Q4 and FY 2010 Financial Summary 21 Note: Dollars in millions, except per share data. (1) Reconciliation of net income to adjusted EBITDA available in appendix. Reconciliation of net income to adjusted net income available in appendix. Reconciliation of GAAP EPS to adjusted EPS available in appendix. Record revenue and strong earnings in 2010 |
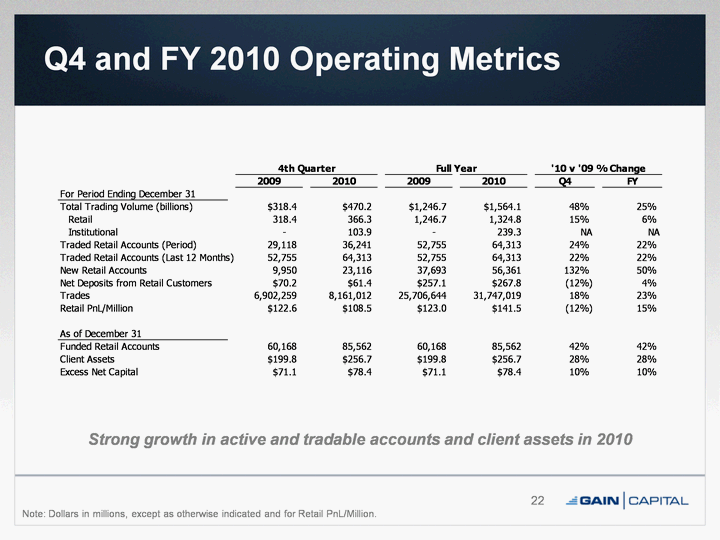
| Q4 and FY 2010 Operating Metrics 22 Note: Dollars in millions, except as otherwise indicated and for Retail PnL/Million. Strong growth in active and tradable accounts and client assets in 2010 |

| Historical Monthly Operating Metrics(1) 23 Note: Dollars in millions. Definitions for all our operating metrics are available in the appendix to this presentation. As of period ended. For period ended. |

| Historical Quarterly Operating Metrics (1) 24 Note: Volume in billions. Net deposits in millions. Definitions for all our operating metrics are available in the appendix to this presentation. For period ended. |
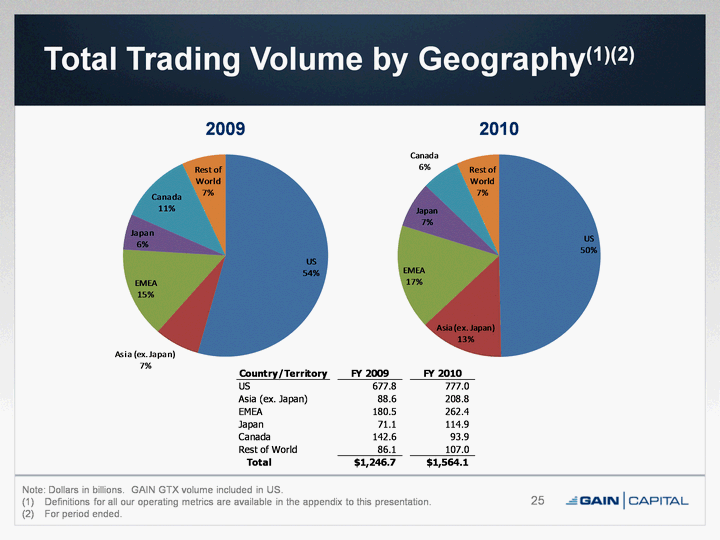
| Total Trading Volume by Geography(1)(2) 25 2009 2010 Note: Dollars in billions. GAIN GTX volume included in US. Definitions for all our operating metrics are available in the appendix to this presentation. For period ended. |
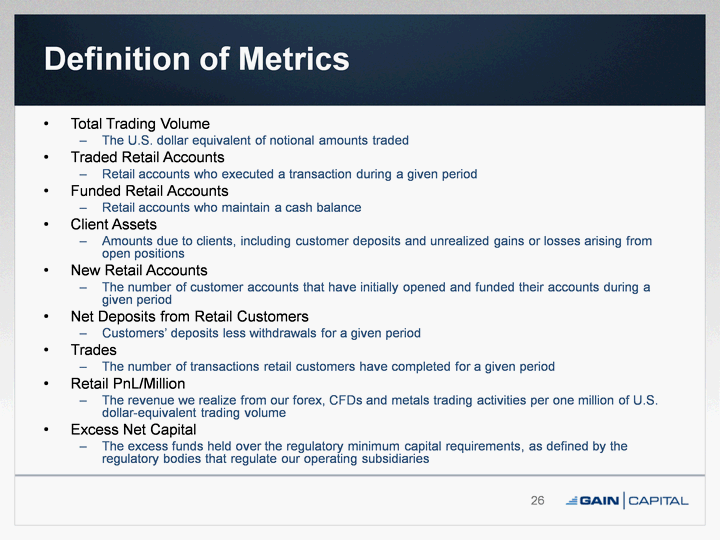
| Definition of Metrics Total Trading Volume The U.S. dollar equivalent of notional amounts traded Traded Retail Accounts Retail accounts who executed a transaction during a given period Funded Retail Accounts Retail accounts who maintain a cash balance Client Assets Amounts due to clients, including customer deposits and unrealized gains or losses arising from open positions New Retail Accounts The number of customer accounts that have initially opened and funded their accounts during a given period Net Deposits from Retail Customers Customers' deposits less withdrawals for a given period Trades The number of transactions retail customers have completed for a given period Retail PnL/Million The revenue we realize from our forex, CFDs and metals trading activities per one million of U.S. dollar-equivalent trading volume Excess Net Capital The excess funds held over the regulatory minimum capital requirements, as defined by the regulatory bodies that regulate our operating subsidiaries 26 |

| 4th Quarter and Full Year 2010 Financial and Operating Results February 15, 2011 |
