Attached files
| file | filename |
|---|---|
| 8-K - CINCINNATI BELL INC. 8-K - CINCINNATI BELL INC | a6609373.htm |
| EX-99.1 - EXHIBIT 99.1 - CINCINNATI BELL INC | a6609373_ex991.htm |
Exhibit 99.2

Cincinnati Bell 4th Quarter 2010 Review February 15, 2011
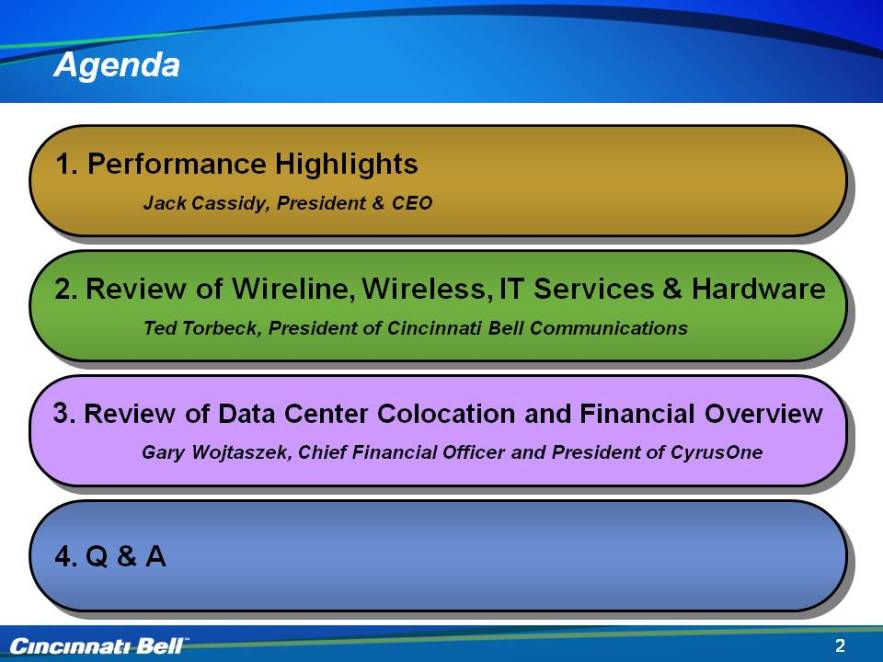
2 Agenda Performance Highlights Jack Cassidy, President & CEO 2. Review of Wireline, Wireless, IT Services & Hardware Ted Torbeck, President of Cincinnati Bell Communications 4. Q & A 3. Review of Data Center Colocation and Financial Overview Gary Wojtaszek, Chief Financial Officer and President of CyrusOne

3 Safe Harbor Certain of the statements and predictions contained in this presentation constitute forward-looking statements within the meaning of the Private Securities Litigation Reform Act. In particular, statements, projections or estimates that include or reference the words “believes,” “anticipates,” “plans,” “intends,” “expects,” “will,” or any similar expression fall within the safe harbor for forward-looking statements contained in the Reform Act. Actual results or outcomes may differ materially from those indicated or suggested by any such forward-looking statement for a variety of reasons, including, but not limited to: changing market conditions and growth rates within the telecommunications industry or generally within the overall economy; changes in competition in markets in which the company operates; pressures on the pricing of company products and services; advances in telecommunications technology; the ability to generate sufficient cash flow to fund the company’s business plan, repay the company’s debt and interest obligations, and maintain its networks; the ability to refinance indebtedness when required on commercially reasonable terms; changes in the telecommunications regulatory environment; changes in the demand for the company’s services and products; the demand for particular products and services within the overall mix of products sold, as the company’s products and services have varying profit margins; the company’s ability to introduce new service and product offerings on a timely and cost effective basis; work stoppage caused by labor disputes; restrictions imposed under various credit facilities and debt instruments; the company’s ability to attract and retain highly qualified employees; the company’s ability to access capital markets and the successful execution of restructuring initiatives; changes in the funded status of the company’s retiree pension and healthcare plans; disruption in operations caused by a health pandemic, such as the H1N1 influenza virus; changes in the company’s relationships with current large customers, a small number of whom account for a significant portion of company revenue; disruption in the company’s back-office information technology systems, including its billing system; the company’s ability to integrate successfully the business of Cyrus Networks, LLC with the company’s existing operations and to achieve the anticipated benefits of the acquisition of Cyrus Networks, LLC; and failure of or disruption in the operation of the company’s data centers. More information on potential risks and uncertainties is available in recent filings with the Securities and Exchange Commission, including Cincinnati Bell’s Form 10-K report, Form 10-Q reports and Form 8-K reports. The forward-looking statements included in this presentation represent company estimates as of February 15, 2011. Cincinnati Bell anticipates that subsequent events and developments will cause its estimates to change.
4 Performance Highlights Jack Cassidy President & CEO
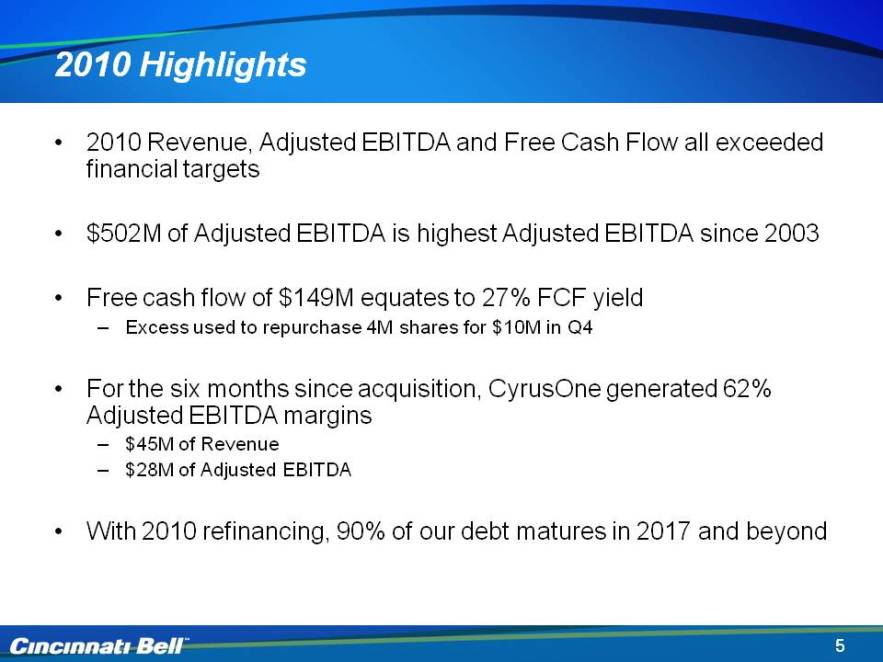
5 2010 Highlights 2010 Revenue, Adjusted EBITDA and Free Cash Flow all exceeded financial targets $502M of Adjusted EBITDA is highest Adjusted EBITDA since 2003 Free cash flow of $149M equates to 27% FCF yield Excess used to repurchase 4M shares for $10M in Q4 For the six months since acquisition, CyrusOne generated 62% Adjusted EBITDA margins $45M of Revenue $28M of Adjusted EBITDA With 2010 refinancing, 90% of our debt matures in 2017 and beyond
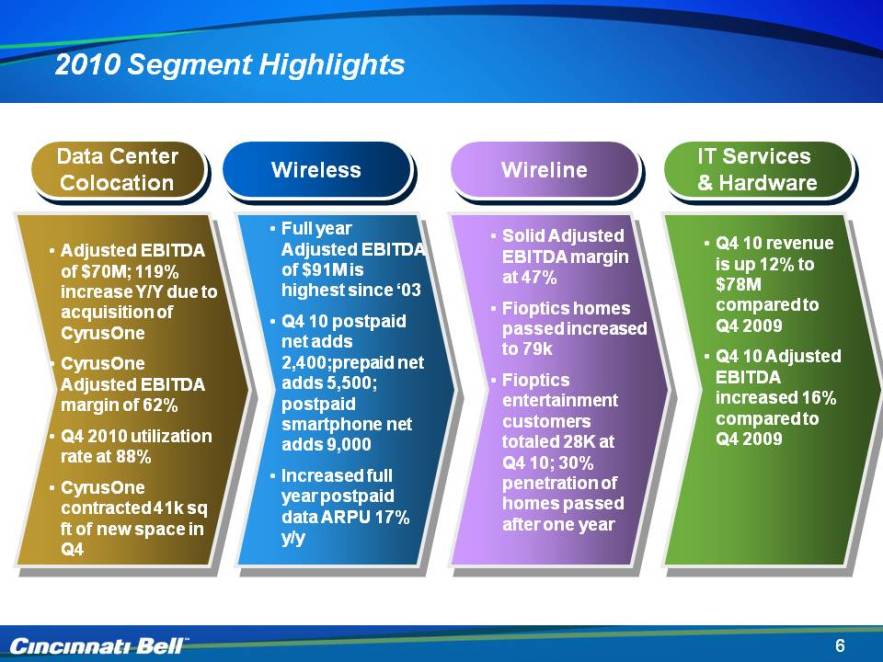
6 2010 Segment Highlights Data Center Colocation Wireless IT Services & Hardware Wireline Adjusted EBITDA of $70M; 119% increase Y/Y due to acquisition of CyrusOne CyrusOne Adjusted EBITDA margin of 62% 4Q 2010 utilization rate at 88% CyrusOne contracted 41k sq ft of new space in Q4 Full year Adjusted EBITDA of $91M is highest since ’03 Q4 10 postpaid net adds 2,400;prepaid net adds 5,500; postpaid smartphone net adds 9,000 Increased full year postpaid data ARPU 17% y/y Q4 10 revenue is up 12% to $78M Q4 10 Adjusted EBITDA increased 16% Solid Adjusted EBITDA margin at 47% Fioptics homes passed increased to 79k Fioptics entertainment customers totaled 28K at Q4 10; 30% penetration of homes passed after one year
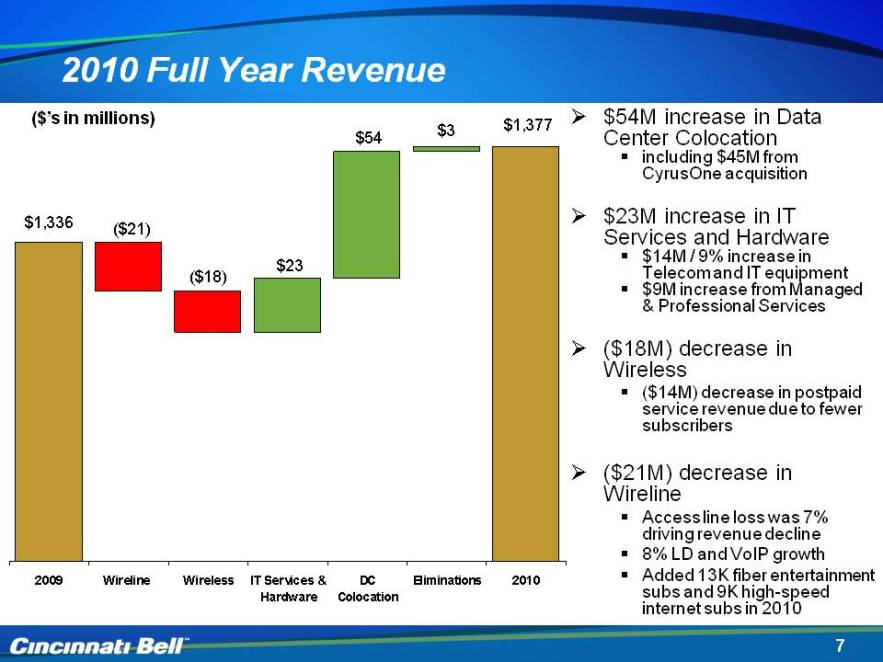
7 2010 Full Year Revenue $54M increase in Data Center Colocation including $45M from CyrusOne acquisition $23M increase in IT Services and Hardware $14M / 9% increase in Telecom and IT equipment $9M increase from Managed & Professional Services ($18M) decrease in Wireless ($14M) decrease in postpaid service revenue due to fewer subscribers ($21M) decrease in Wireline Access line loss was 7% driving revenue decline 8% LD and VoIP growth Added 13K fiber entertainment subs and 9K high-speed internet subs in 2010 ($’s in millions) $1,336 ($21) ($18) $23 $54 $3 $1,377 2009 Wireline Wireless IT Services & Hardware DC Colocation Eliminations 2010
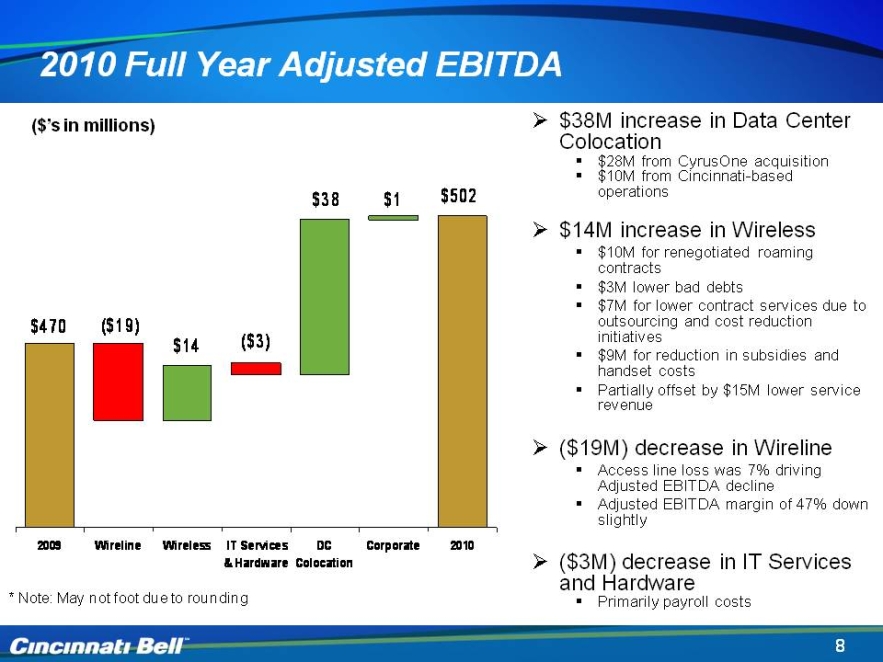
Slide: 8 Title: 2010 Full Year Adjusted EBITDA Body: $38M increase in Data Center Colocation $28M from CyrusOne acquisition $10M from Cincinnati-based operations $14M increase in Wireless $10M for renegotiated roaming contracts $3M lower bad debts $7M for lower contract services due to outsourcing and cost reduction initiatives $9M for reduction in subsidies and handset costs Partially offset by $15M lower service revenue $19M) decrease in Wireline Access line loss was 7% driving Adjusted EBITDA decline Adjusted EBITDA margin of 47% down slightly ($3M) decrease in IT Services and Hardware Primarily payroll costs ($’s in millions) $470 ($19) $14 ($3) $38 $1 $502 2009 Wireline Wireless IT Services & Hardware DC Colocation Eliminations 2010
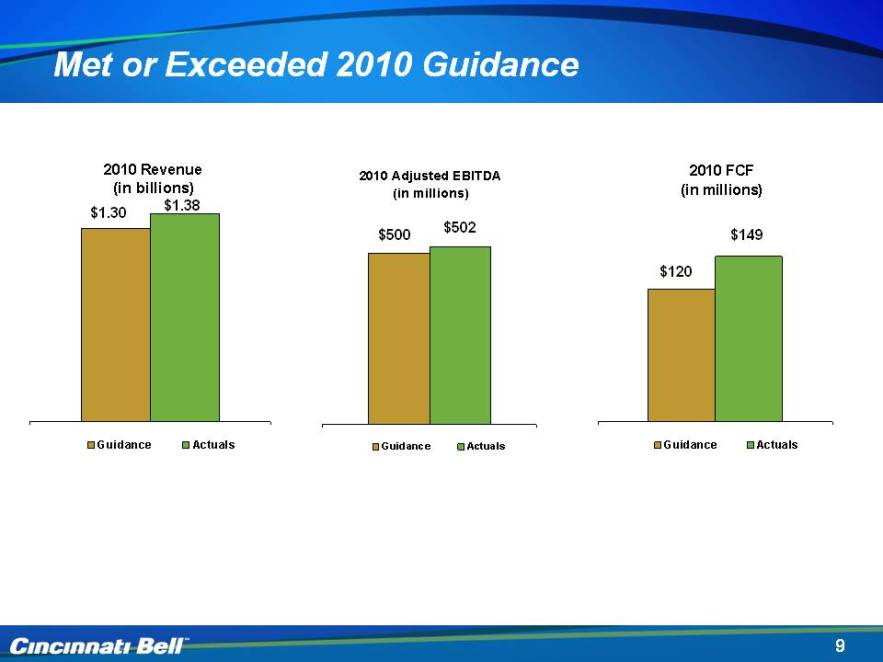
9 Met or Exceeded 2010 Guidance $1.30 $500 $502 $1.38 $120 $149 2010 Revenue (in billions) 2010 Adjusted EBITDA (in millions) 2010 FCF (in millions) Guidance Actuals
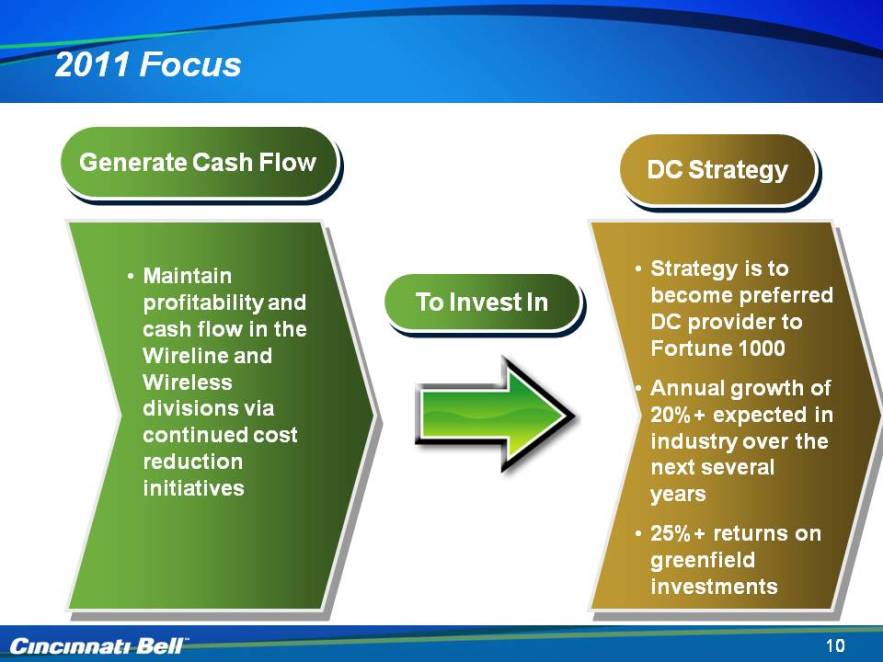
10 2011 Focus DC Strategy Generate Cash Flow Maintain profitability and cash flow in the Wireline and Wireless divisions via continued cost reduction initiatives Strategy is to become preferred DC provider to Fortune 1000 Annual growth of 20%+ expected in industry over the next several years 25%+ returns on greenfield investments To Invest In
11 Operational Overview Ted Torbeck President of Cincinnati Bell Communications
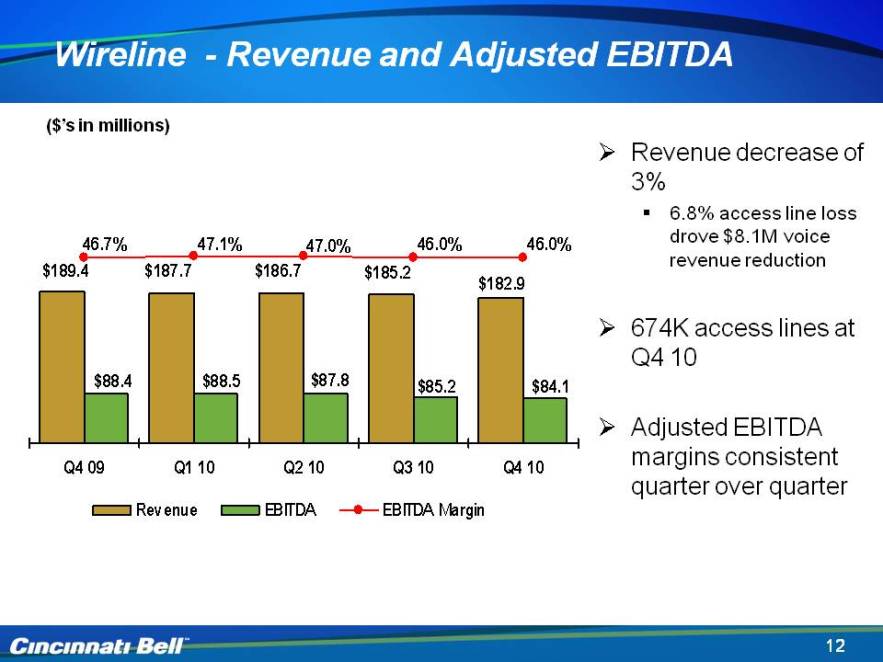
12 Wireline - Revenue and Adjusted EBITDA Body: Revenue decrease of 3% 6.8% access line loss drove $8.1M voice revenue reduction 674K access lines at Q4 10 Adjusted EBITDA margins consistent quarter over quarter ($’s in millions) $189.4 46.7% $187.7 47.1% $186.7 47.0% $185.2 46.0% $182.9 46.0% $88.4 $88.5 $87.8 $85.2 $84.1 Q4 09 Q1 10 Q2 10 Q3 10 Q4 10 Revenue EDITDA EDITDA Margin
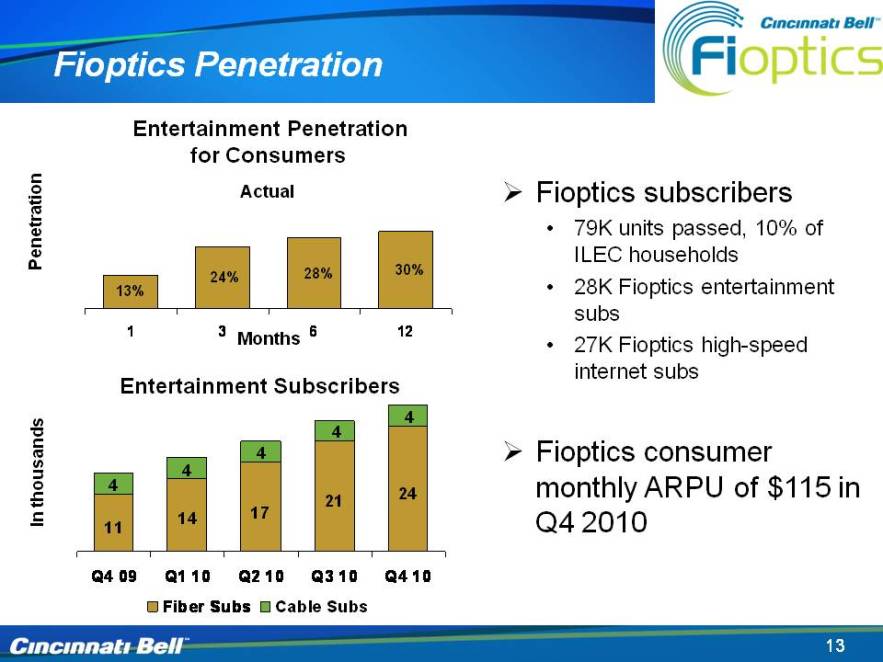
Entertainment Penetration for Consumers Entertainment Subscribers 13 Fioptics Penetration Fioptics subscribers 79K units passed, 10% of ILEC households 28K Fioptics entertainment subs 27K Fioptics hi-speed internet subs Fioptics consumer monthly ARPU of $115 in 4Q 2010 Months Penetration Actual In thousands 13% 24% 28% 30% 1 3 6 12 4 11 14 7 21 24 Q4 09 Q1 10 Q2 10 Q3 10 Q4 10 Fiber Subs Cable Subs
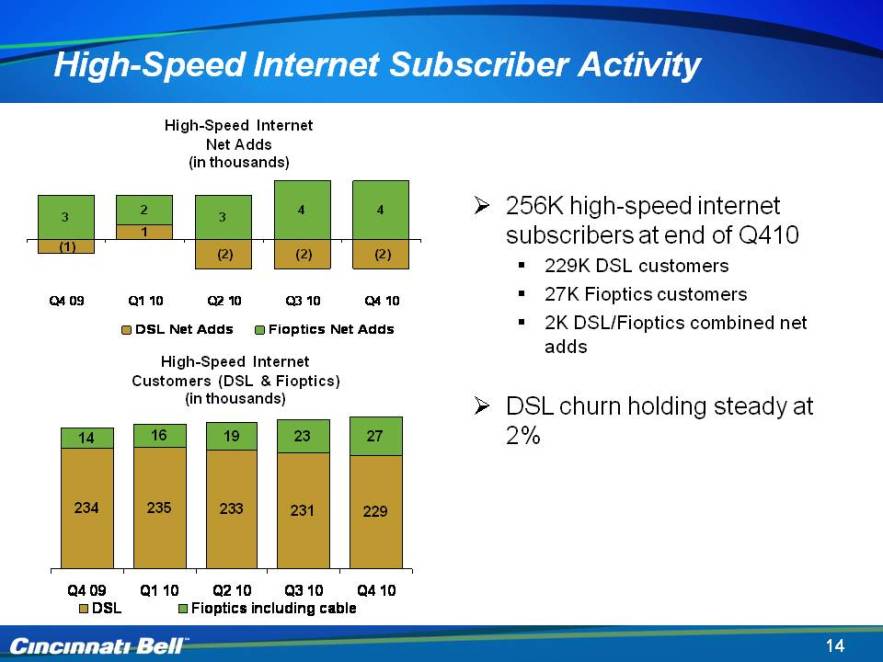
14 High-Speed Internet Subscriber Activity 256K high-speed internet subscribers at end of 4Q10 229K DSL customers 27K Fioptics customers 2K DSL/Fioptics combined net adds DSL churn holding steady at 2% High-Speed Internet Net Adds (in thousands) High-Speed Internet Customers (DSL & Fioptics) (in thousands) 3 2 4 (1) 1 (2) Q4 09 Q1 10 Q2 10 Q3 10 Q4 10 DSL Net Adds Fioptics Net Adds DSL Fioptics including cable 234 235 233 231 229 14 16 19 23 27
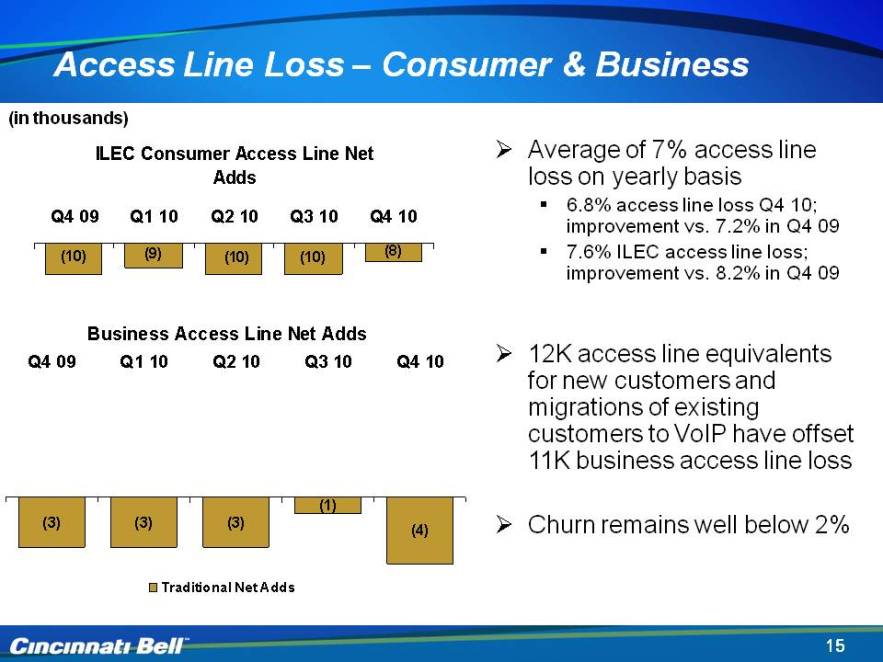
15 Access Line Loss – Consumer & Business Average of 7% access line loss on yearly basis 6.8% access line loss Q4 10; improvement vs. 7.2% in Q4 09 7.6% ILEC access line loss; improvement vs. 8.2% in Q4 09 12K access line equivalents for new customers and migrations of existing customers to VoIP have offset 11K business access line loss Churn remains well below 2% (in thousands) ILEC Consumer Access Line Net Adds ) Q4 09 Q1 10 Q2 10 Q3 10 Q4 10 Business Access Line Net Adds (3) (1) (4) (10) (9) (8) Traditional Net Adds
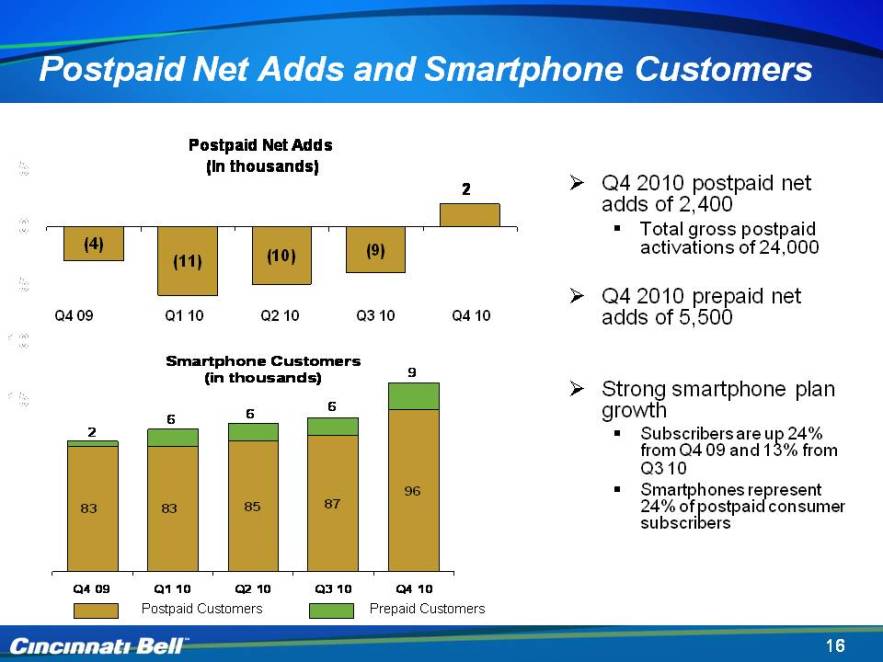
16 Postpaid Net Adds and Smartphone Customers Q4 2010 postpaid net adds of 2,400 Total gross postpaid activations of 24,000 Q4 2010 prepaid net adds of 5,500 Strong smartphone plan growth Subscribers are up 24% from 4Q 09 and 13% from 3Q 10 Smartphones represent 24% of postpaid consumer subscribers Q4 09 Q1 10 Q2 10 Q3 10 Postpaid Customers Prepaid Customers Q4 10 (4) (11) (10) (9) 2 Smartphone Customers (in thousands) Postpaid Net Adds (In thousands) 2 6 9 83 85 87 96
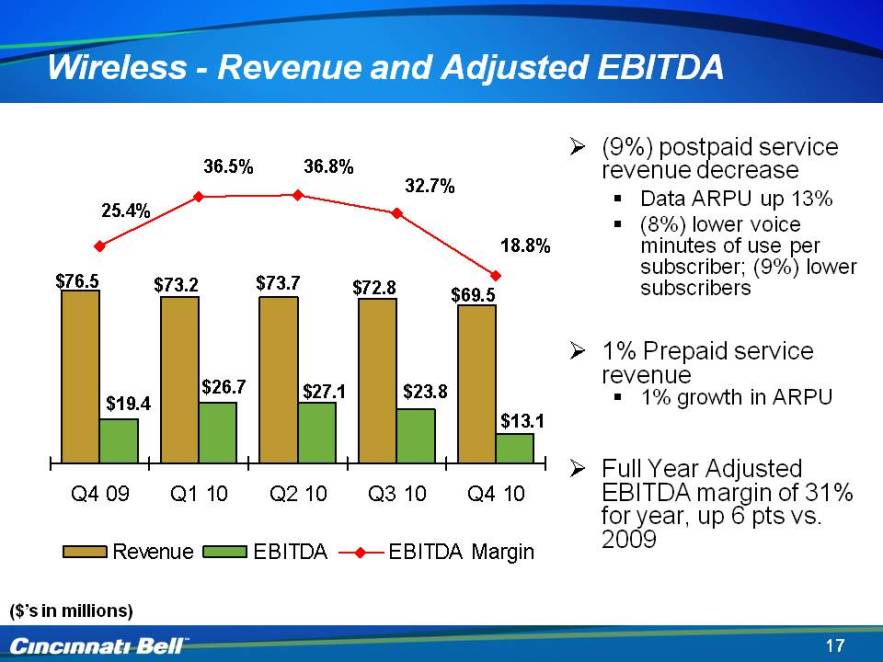
17 Wireless - Revenue and Adjusted EBITDA ($’s in millions) (9%) postpaid service revenue decrease Data ARPU up 13% (8%) lower voice minutes of use per subscriber; (9%) lower subscribers 1% Prepaid service revenue 1% growth in ARPU Full Year Adjusted EBITDA margin of 31% for year, up 6 pts vs. 2009 Revenue EBITDA EBITDA Margin Q4 09 Q1 10 Q2 10 Q3 10 Q4 10 $76.5 $73.2 $73.7 $72.8 $69.5 $19.4 $26.7 $27.1 $23.8 $69.5 $13.1 25.4% 36.5% 36.8% 32.7% 18.8%
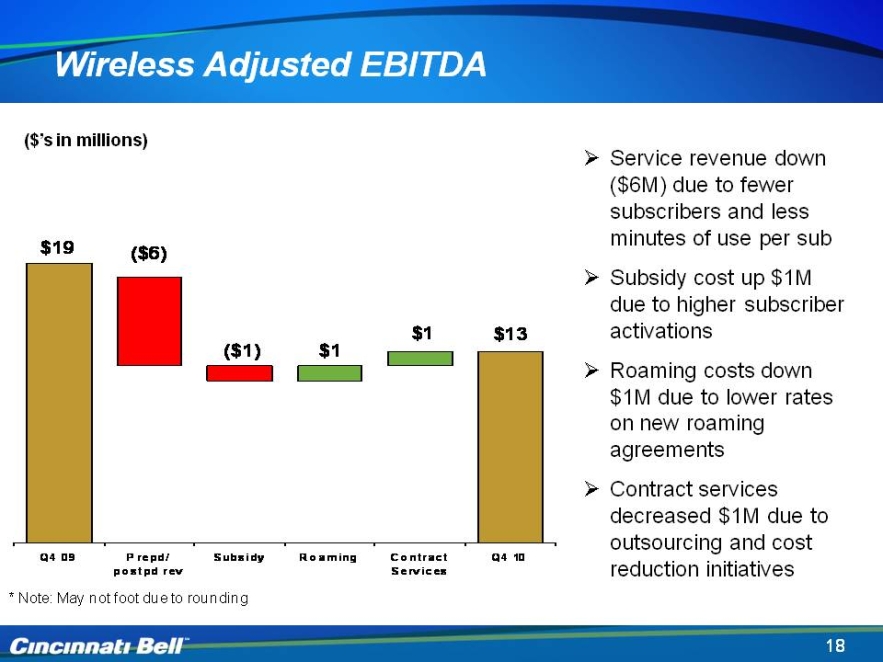
18 Wireless Adjusted EBITDA ($’s in millions) Service revenue down ($6M) due to fewer subscribers and less minutes of use per sub Subsidy cost up $1M due to higher subscriber activations Roaming costs down $1M due to lower rates on new roaming agreements Contract services decreased $1M due to outsourcing and cost reduction initiatives $19 ($6) ($1) $1 $1 $13 Q4 09 Prepd/postpd rev Subsidy Roaming Contract Services Q4 10
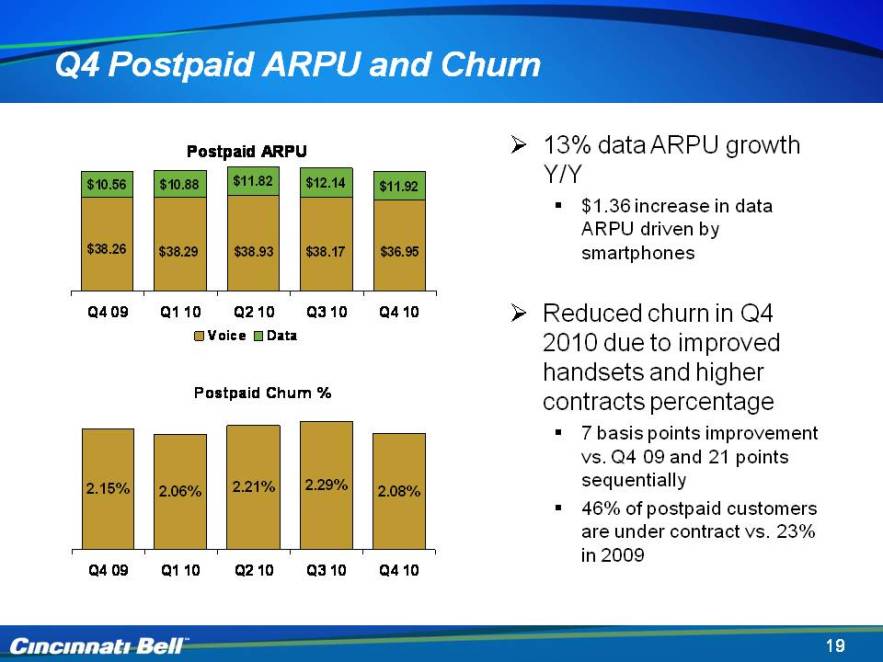
19 4Q Postpaid ARPU and Churn 13% data ARPU growth Y/Y $1.36 increase in data ARPU driven by smartphones Reduced churn in Q4 2010 due to improved handsets and higher contracts percentage 7 basis points improvement vs. Q4 09 and 21 points sequentially 46% of postpaid customers are under contract vs. 23% in 2009 Postpaid ARPU Voice Data Postpaid Churn % Q4 09 Q1 10 Q2 10 Q3 10 Q4 10 $10.56 $10.88 $11.82 $12.14 $11.92 $38.26 $38.29 $38.93 $38.17 $36.95 2.15% 2.06% 2.21% 2.29% 2.08%
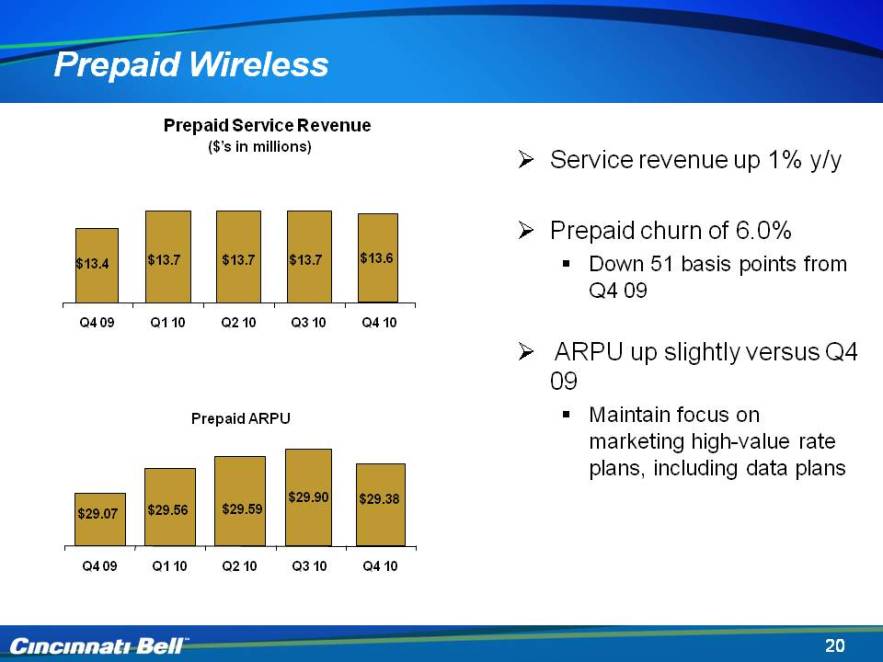
20 Prepaid Wireless Prepaid Service Revenue ($’s in millions) Service revenue up 1% y/y Prepaid churn of 6.0% Down 51 basis points from Q4 09 ARPU up slightly versus Q4 09 Maintain focus on marketing high-value rate plans, including data plans $13.4 $13.7 $13.6 $13.7 $13.7 Q4 09 Q1 10 Q2 10 Q3 10 Q4 10 Prepaid ARPU $29.07 $29.56 $29.38 $29.90 $29.59 Q4 09 Q1 10 Q2 10 Q3 10 Q4 10
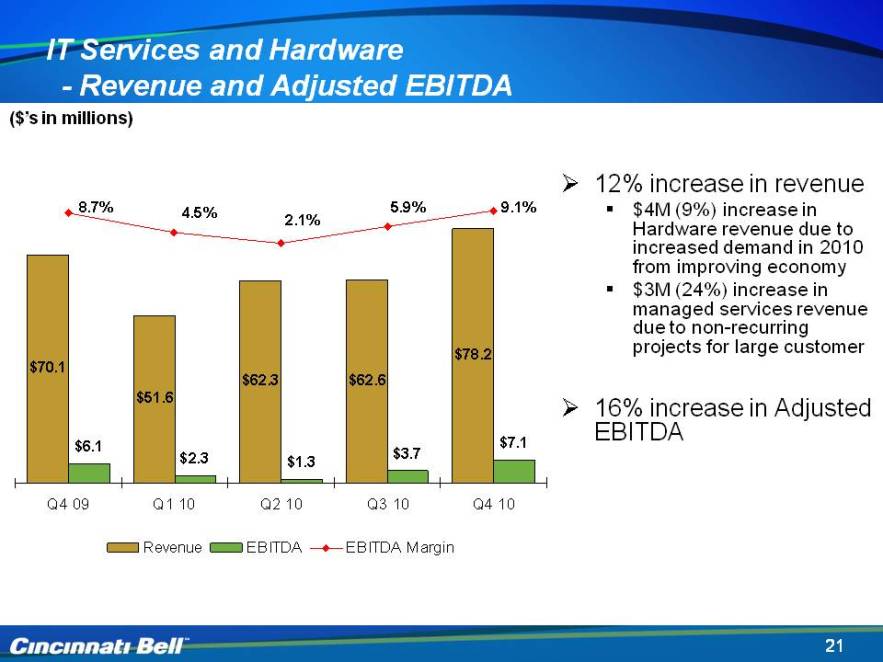
21 IT Services and Hardware - Revenue and Adjusted EBITDA 12% increase in revenue $4M (9%) increase in Hardware revenue due to increased demand in 2010 from improving economy $3M (24%) increase in managed services revenue due to non-recurring projects for large customer 16% increase in Adjusted EBITDA ($’s in millions) Q4 09 Q1 10 Q2 10 Q3 10 Q4 10 Revenue EBITDA EBITDA Margin 8.7% 4.5% 2.1% 5.9% 9.1% $70.1 $6.1 $51.6 $62.3 $62.6 $78.2 $6.1 $2.3 $1.3 $3.7 $7.1
22 Financial Overview Gary Wojtaszek Chief Financial Officer and President of CyrusOne
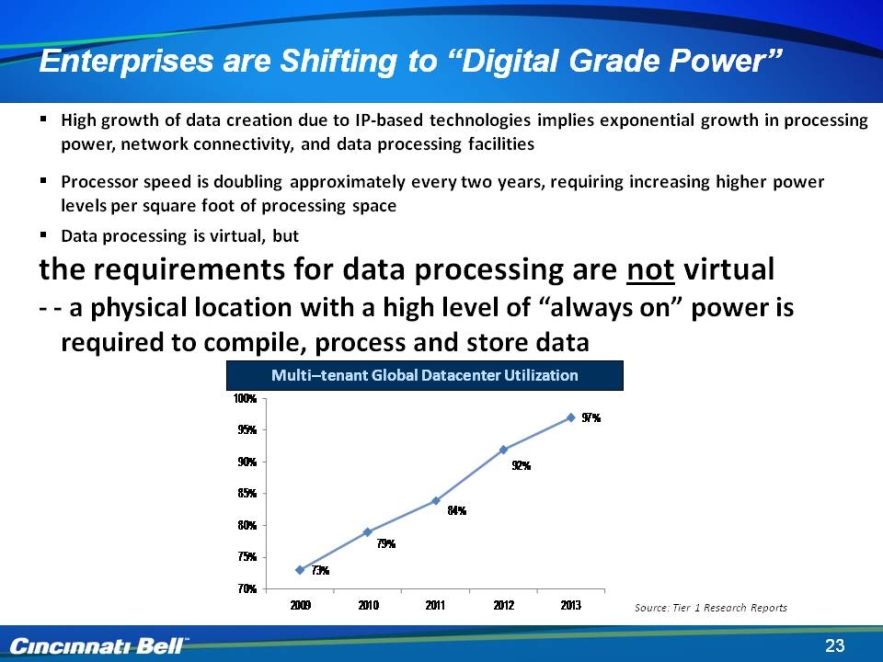
23 High growth of data creation due to IP-based technologies implies exponential growth in processing power, network connectivity, and data processing facilities Processor speed is doubling approximately every two years, requiring increasing higher power levels per square foot of processing space Data processing is virtual, but the requirements for data processing are not virtual - - a physical location with a high level of “always on” power is required to compile, process and store data Multi–tenant Global Datacenter Utilization Enterprises are Shifting to “Digital Grade Power” Power versus Performance Source: Tier 1 Research Reports Source: Energy per Instruction Trends in Intel® Microprocessors", Microarchitecture Research Lab, Intel Corporation 100% 95% 90% 85% 80% 75% 70% 2009 2010 2011 2012 2013 73% 79% 84% 92% 97% Power versus Performance 40 35 30 25 20 15 10 5 0 2 4 6 8 power = prtf ^ 1.75 Pentium 4 (Cedarmill) Pentium MO Dothan Banias Core Duo (Yonah) Pentium Pro Pentium 1486 Figure 2: Normalized Power versus Normalized Scalar Performance for Multiple Generations of Intel Microprocessors
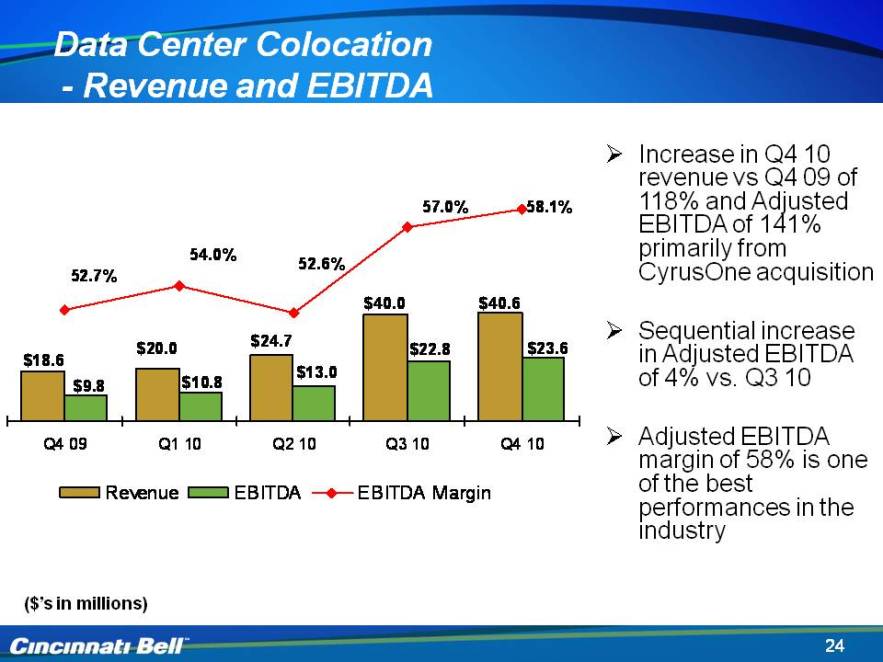
24 Data Center Colocation - Revenue and EBITDA ($’s in millions) Increase in Q410 revenue vs Q409 of 118% and Adjusted EBITDA of 141% primarily from CyrusOne acquisition Sequential increase in Adjusted EBITDA of 4% vs. Q310 Adjusted EBITDA margin of 58% is one of the best performances in the industry Revenue EBITDA EBITDA Q4 09 Q1 10 Q2 10 Q3 10 Q4 10 $18.6 $9.8 $20.0 $10.8 $24.7 $13.0 $40.0 $22.8 $40.6 $23.6 52.7% 54.0% 52.6% 57.0% 58.1%
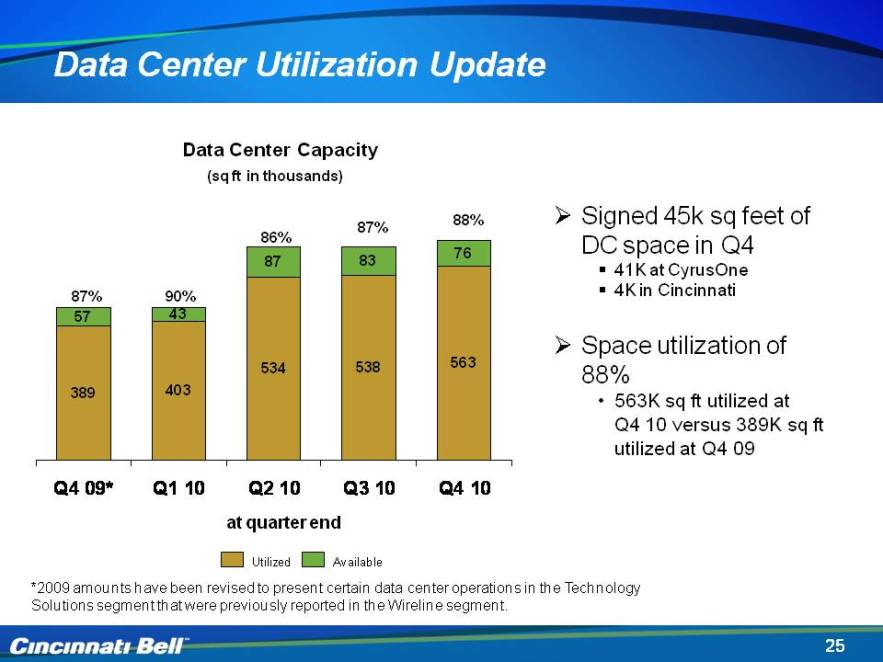
25 Data Center Utilization Update Data Center Capacity at quarter end Signed 45k sq feet of DC space in Q4 41K at CyrusOne 4K in Cincinnati Space utilization of 88% 563K sq ft utilized at 4Q 10 versus 389K sq ft utilized at 4Q 09 (sq ft in thousands) Utilized Available *2009 amounts have been revised to present certain data center operations in the Technology Solutions segment that were previously reported in the Wireline segment. 87% 87% 90% 88% 86% 57 43 87 83 76 389 403 534 538 563 Q4 09 Q1 10 Q2 10 Q3 10 Q4 10 at quarter end
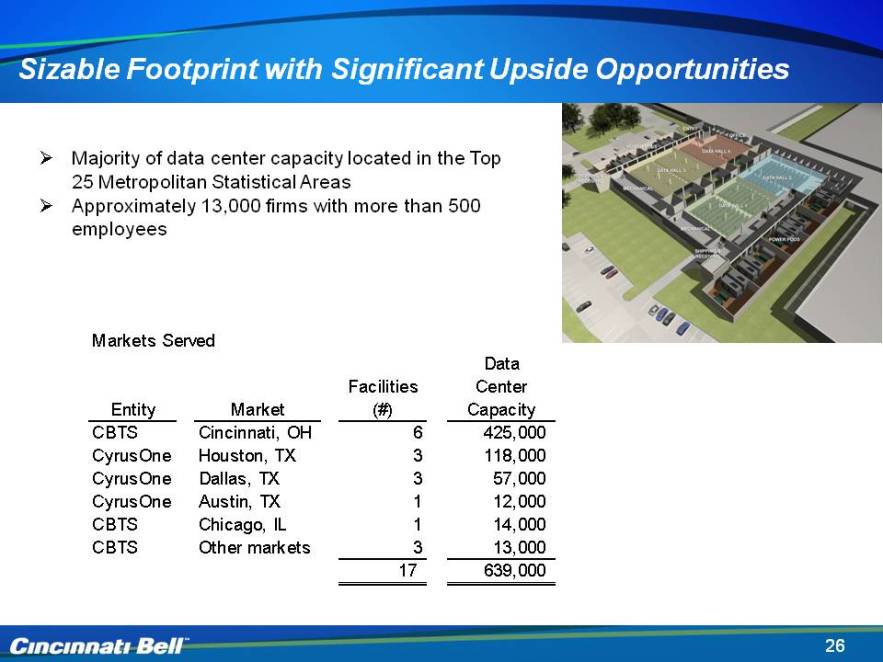
Sizable Footprint with Significant Upside Opportunities Majority of data center capacity located in the Top 25 Metropolitan Statistical Areas Approximately 13,000 firms with more than 500 employees 26 Markets Served Entity CBTS CyrusOne Market Cincinnati, OH Houston, TX Dallas, Austin, Chicago, IL Other markets Facilities (#) Data Center Capacity Data Center Utilization 6 3 1 17 425,000 118,000 57,000 12,000 14,000 13,000 639,000 381,000 105,000 46,000 10,000 8,000 13,000 563,000
Sizable Footprint with Significant Upside Opportunities Majority of data center capacity located in the Top 25 Metropolitan Statistical Areas Approximately 13,000 firms with more than 500 employees 26 Markets Served Entity CBTS CyrusOne Market Cincinnati, OH Houston, TX Dallas, Austin, Chicago, IL Other markets Facilities (#) Data Center Capacity Data Center Utilization 6 3 1 17 425,000 118,000 57,000 12,000 14,000 13,000 639,000 381,000 105,000 46,000 10,000 8,000 13,000 563,000
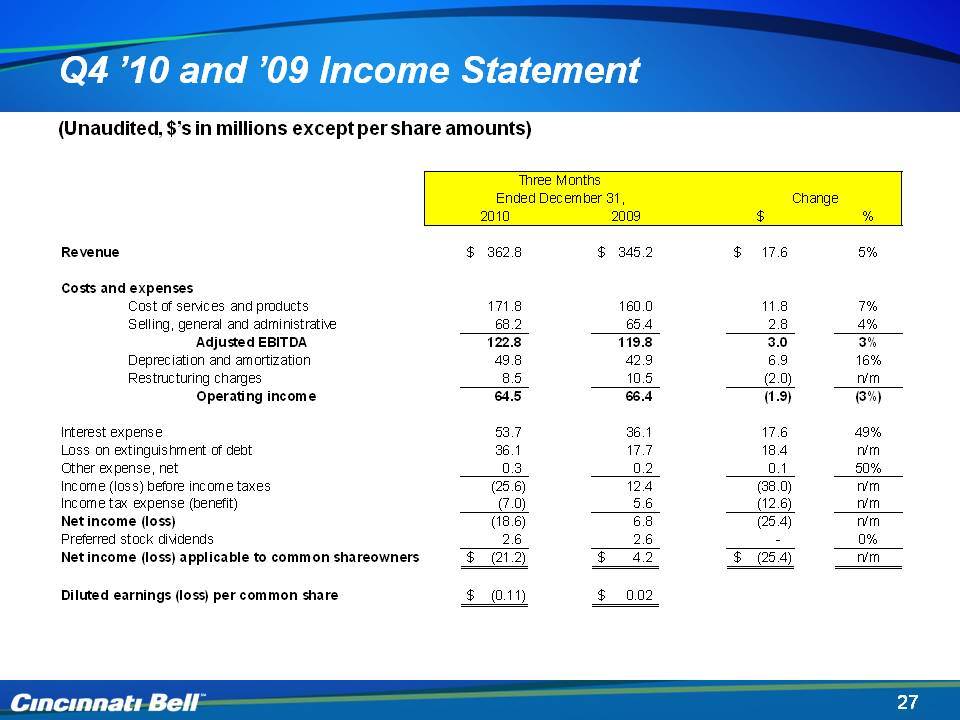
Slide: 27 Title: Q4 ’10 and ’09 Income Statement (Unaudited, $’s in millions except per share amounts) Q4 ’10 and ’09 Income Statement (Unaudited, $’s in millions except per share amounts) Three Months Ended December 31, Change 2010 2009 $ % Revenue 362.8 $ 345.2 $ 17.6 $ 5% Costs and expenses services 171 8 160 0 11 8 7% Cost of and products 171.8 160.0 11.8 Selling, general and administrative 68.2 65.4 2.8 4% Adjusted EBITDA 122.8 119.8 3.0 3% Depreciation and amortization 49.8 42.9 6.9 16% Restructuring charges 8.5 10.5 (2.0) n/m Operating income 64.5 66.4 (1.9) (3%) Interest expense 53.7 36.1 17.6 49% Loss on extinguishment of debt 36.1 17.7 18.4 n/m Other expense, net 0.3 0.2 0.1 50% Income (loss) before income taxes (25.6) 12.4 (38.0) n/m Income tax expense (benefit) (7.0) 5.6 (12.6) n/m Net income (loss) (18.6) 6.8 (25.4) n/m Preferred stock dividends 2.6 2.6 - 0% Net income (loss) applicable to common shareowners (21.2) $ 4.2 $ (25.4) $ n/m Diluted earnings (loss) per common share $(0.11) $ 0.02
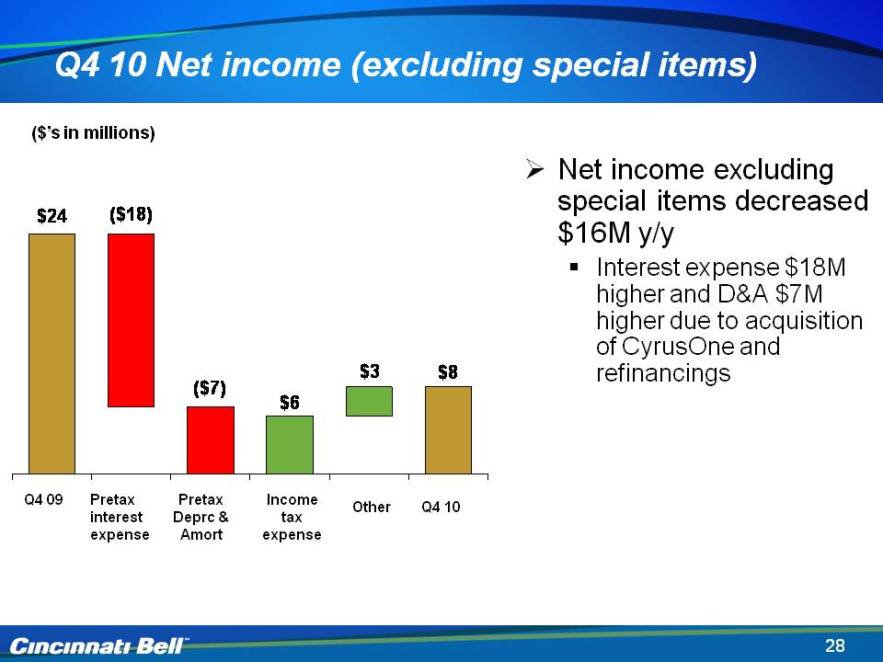
28 4Q 10 Net income (excluding special items) ($’s in millions) Net income excluding special items decreased $16M y/y Interest expense $18M higher and D&A $7M higher due to acquisition of CyrusOne and refinancing Pretax interest expense Other Q4 10 Q4 09 Income tax expense Pretax Deprc & Amort $24 ($18) ($7) $6 $3 $8
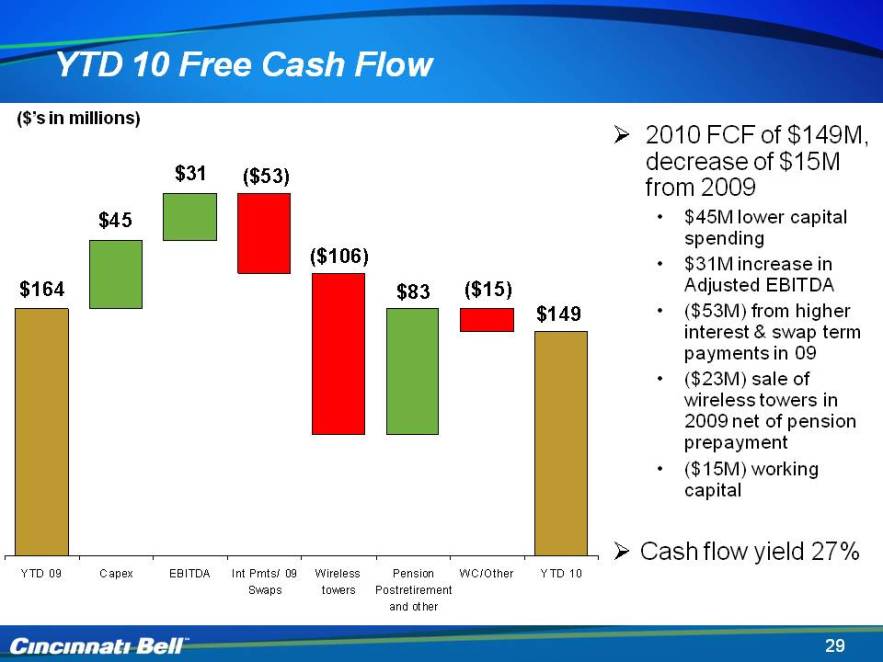
29 YTD 10 Free Cash Flow ($’s in millions) 2010 FCF of $149M, decrease of $15M from 2009 $45M lower capital spending $31M increase in Adjusted EBITDA ($53M) from higher interest & swap term payments in 09 ($23M) sale of wireless towers in 2009 net of pension prepayment ($15M) working capital Cash flow yield 27% YTD 09 Capex EBITDA Int Pmts/09 Swaps Wireless towers Pension Postretirement and other WC/Other YTD 10 $164 $45 $31 ($53) ($106) $83 ($15) $149
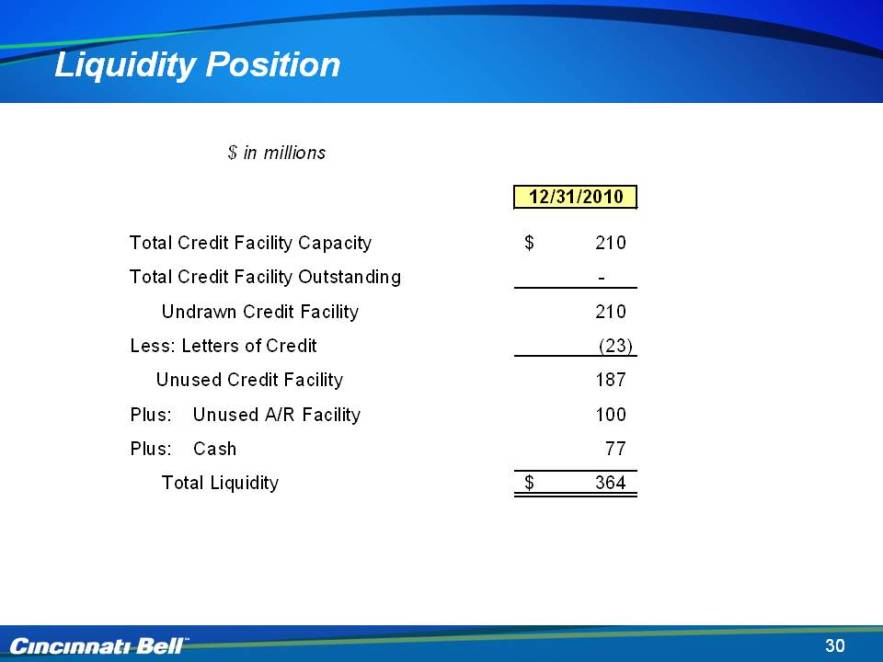
30 Liquidity Position$ in millions 12/31/2010 Total Credit Facility Capacity Total Credit Facility Outstanding Undrawn Credit Facility Less: Letter of Credit Unused Credit Facility Plus: Unused A/R Facility Plus: Cash Total Liquidity $210 – 210 (23) 187 100 77 $364
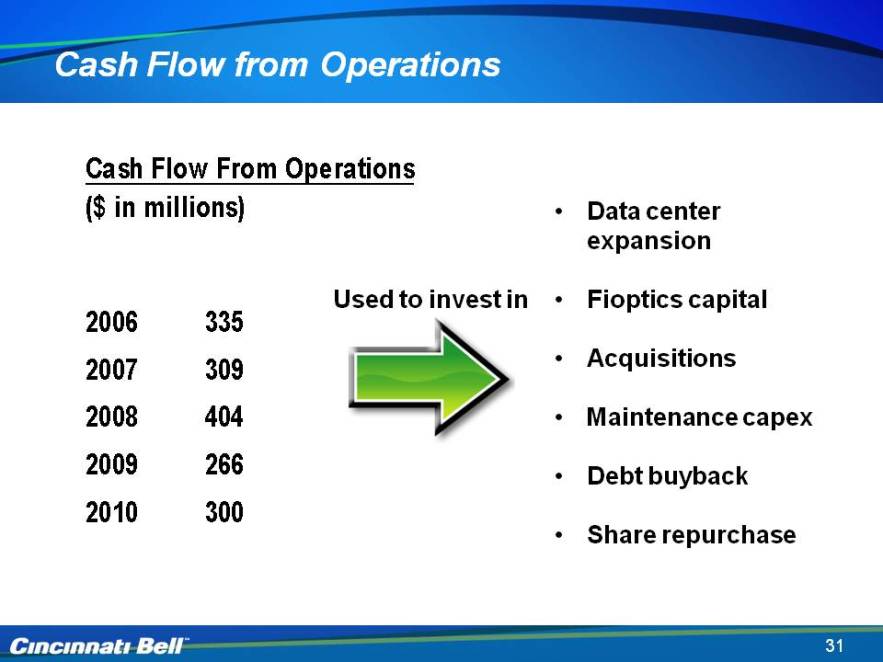
31 Cash Flow from Operations Used to invest in Data center expansion Fioptics capital Acquisitions Maintenance capex Debt buyback Share repurchase ($ in millions) 2006 335 2007 309 2008 404 2009 266 2010 300
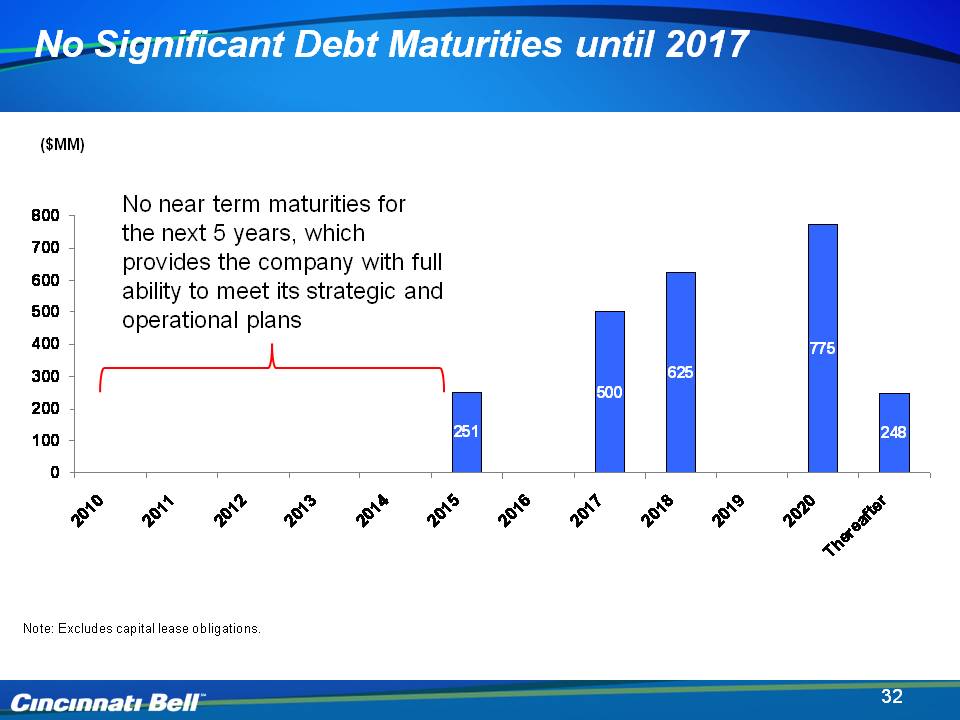
Slide: 32($MM) No Significant Debt Maturities until 2017 No near term maturities for the next 5 years, which provides the company with full ability to meet its strategic and operational plans Note: Excludes capital lease obligations. No Significant Debt Maturities until 2017 ($MM) No near term maturities for the next 5 years, which provides the company with full ability to meet its strategic and operational plans 800 700 600 500 400 300 200 100 0 251 500 625 775 248 2010 2011 2012 2013 2014 2015 2016 2017 2018 2019 2020 Thereafter
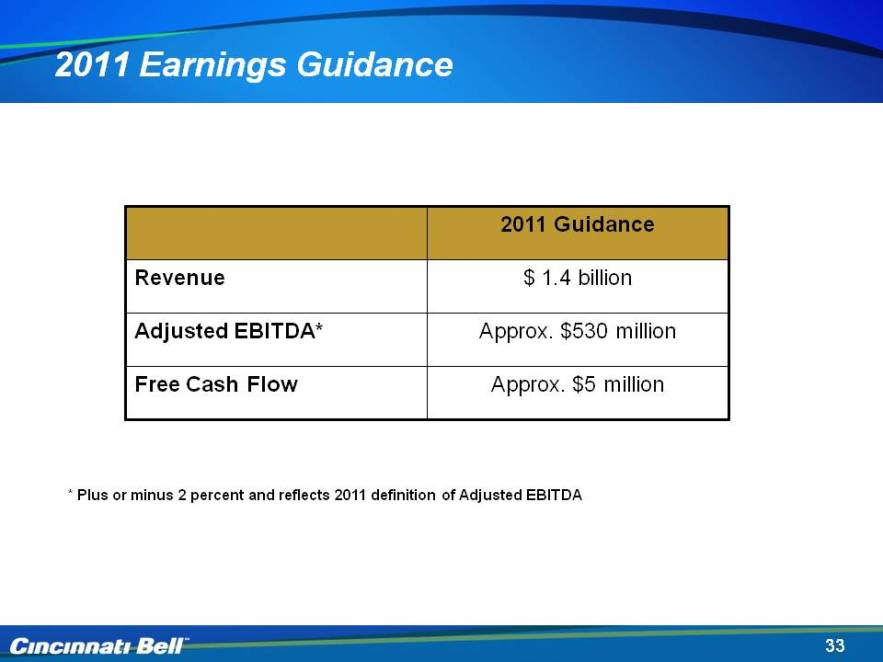
33 2011 Earnings Guidance * Plus or minus 2 percent and reflects 2011 definition of Adjusted EBITDA Revenue Adjust EBITDA* Free Cash Flow 2011 Guidance $1.4 billion Approx. $530 million Approx. $5 million
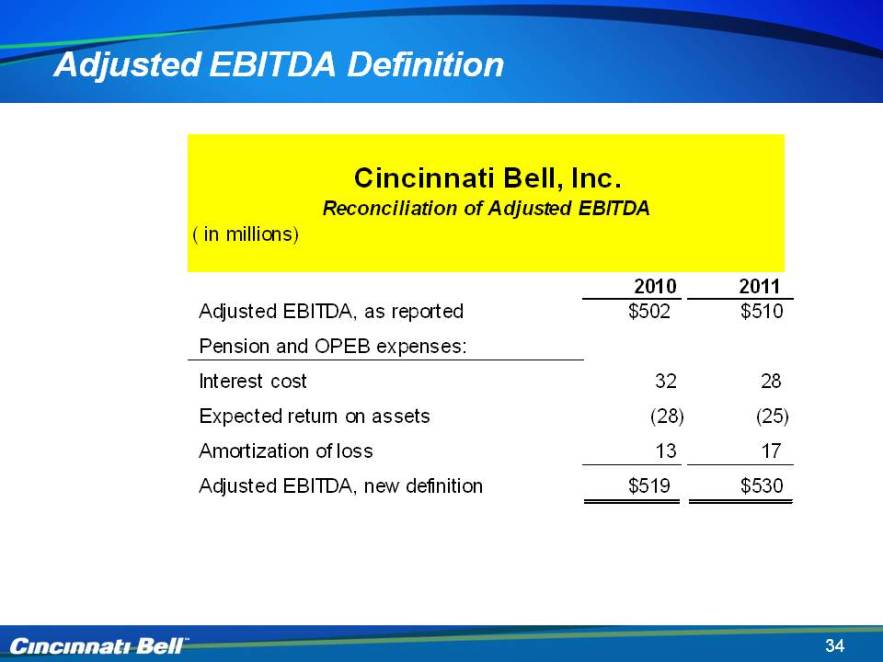
34 Adjusted EBITDA Definition Cincinnati Bell, Inc. Reconciliation of Adjusted EBITDA (in millions) Adjusted EBITDA, as reported Pension and OPEB expenses: Interest cost Expected return on assets Amortization of loss Adjusted EBITDA, new definition 2010 2011 $502 $510 (28) 28 (25) 13 17 $519 $530

Cincinnati Bell 4th Quarter 2010 Review February 15, 2011
36 Non-GAAP Reconciliations (please refer to the Earnings Financials)