Attached files
| file | filename |
|---|---|
| 8-K - FORM 8-K - American Water Works Company, Inc. | d8k.htm |
| EX-99.1 - PRESS RELEASE - American Water Works Company, Inc. | dex991.htm |
 Investor Conference
February 15, 2010
Exhibit 99.2 |
 February 2011
1 |
 Investor Conference
February 15, 2010 |
 February 2011
3
Please review the corresponding video link "Customer
Service Video" on the American Water website |
 Introduction
Ed Vallejo
Vice
President
-
Investor
Relations |
 February 2011
5
Certain statements in this presentation are forward-looking statements within the
meaning of the safe harbor provisions of the Private Securities Litigation
Reform Act of 1995. These forward-looking statements are predictions based on our current
expectations and assumptions regarding future events and may relate to, among
other things, our future financial performance, our growth and portfolio
optimization strategies, our projected capital expenditures and related funding
requirements, our ability to repay debt, our ability to finance current operations
and growth initiatives, the impact of legal proceedings and potential fines
and penalties, business process and technology improvement initiatives, trends in our
industry, regulatory or legal developments or rate adjustments. Actual results could
differ materially because of factors such as the completion of the independent
audit of our financial statements; decisions of governmental and regulatory bodies,
including
decisions
to
raise
or
lower
rates;
the
timeliness
of
regulatory
commissions’
actions
concerning
rates;
changes
in
laws, governmental regulations and policies, including environmental, health and
water quality and public utility regulations and
policies;
weather
conditions,
patterns
or
events,
including
drought
or
abnormally
high
rainfall;
changes
in
customer
demand for, and patterns of use of, water, such as may result from conservation
efforts; significant changes to our business processes and corresponding
technology; our ability to appropriately maintain current infrastructure; our ability to obtain
permits
and
other
approvals
for
projects;
changes
in
our
capital
requirements;
our
ability
to
control
operating
expenses
and
to
achieve efficiencies in our operations; our ability to obtain adequate and
cost-effective supplies of chemicals, electricity, fuel, water and other
raw materials that are needed for our operations; our ability to successfully acquire and integrate water and
wastewater systems that are complementary to our operations and the growth of our
business or dispose of assets or lines of business that are not complementary
to our operations and the growth of our business; cost overruns relating to
improvements or the expansion of our operations; changes in general economic,
business and financial market conditions; access
to
sufficient
capital
on
satisfactory
terms;
fluctuations
in
interest
rates;
restrictive
covenants
in
or
changes
to
the
credit
ratings
on
our
current
or
future
debt
that
could
increase
our
financing
costs
or
affect
our
ability
to
borrow,
make
payments
on
debt
or
pay
dividends;
fluctuations
in
the
value
of
benefit
plan
assets
and
liabilities
that
could
increase
our
cost
and funding requirements; our ability to utilize our U.S. and state net operating
loss carryforwards; migration of customers into or out of our service
territories; difficulty in obtaining insurance at acceptable rates and on acceptable terms and
conditions; the incurrence of impairment charges ability to retain and attract
qualified employees; and civil disturbance, or terrorist threats or acts or
public apprehension about future disturbances or terrorist threats or acts. Any
forward-looking statements we make, speak only as of the date of this presentation. Except as required by law, we do not
have any obligation, and we specifically disclaim any undertaking or intention, to
publicly update or revise any forward- looking statements, whether as a
result of new information, future events, changed circumstances or otherwise.
Cautionary Statement Concerning
Forward-Looking Statements |
 6
Jeff Sterba: Strategy Overview
Walter Lynch: Regulated Overview
Break
Ellen Wolf: Financial Overview
Closing and Q&As
Today’s Agenda
February 2011 |
 American Water Overview:
Strategy & Goals
Jeff Sterba
President and Chief Executive Officer |
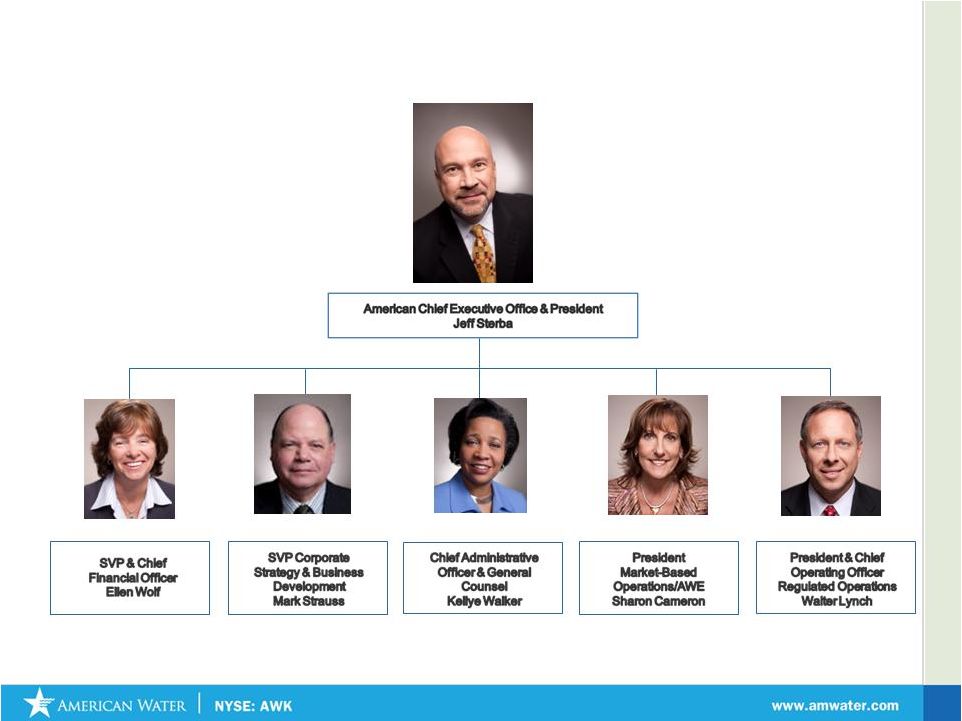 8
Executive Team
February 2011 |
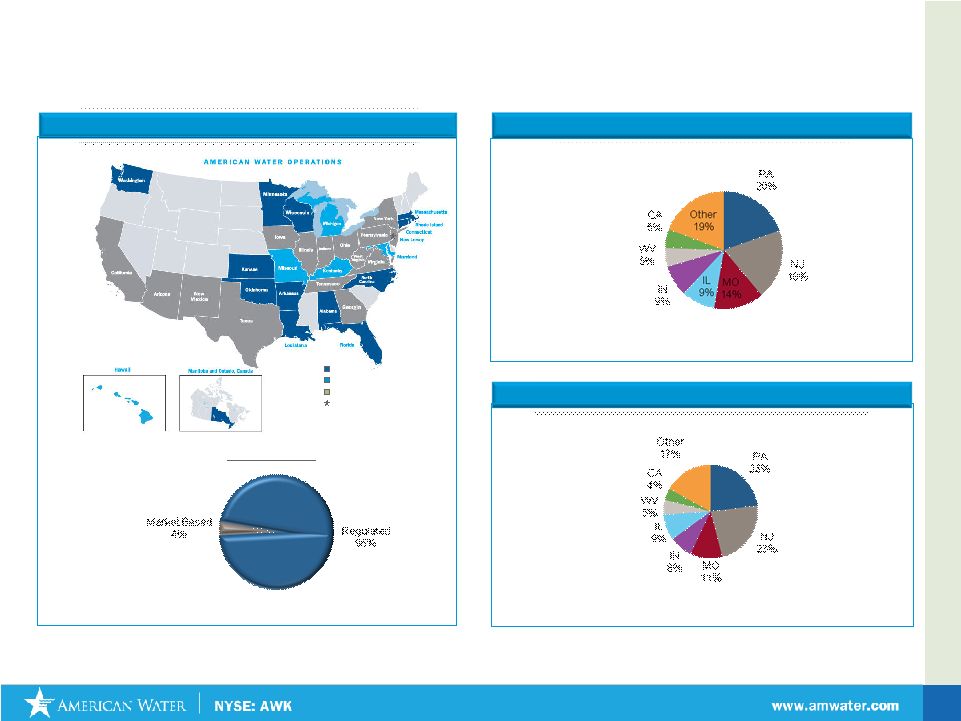
 9
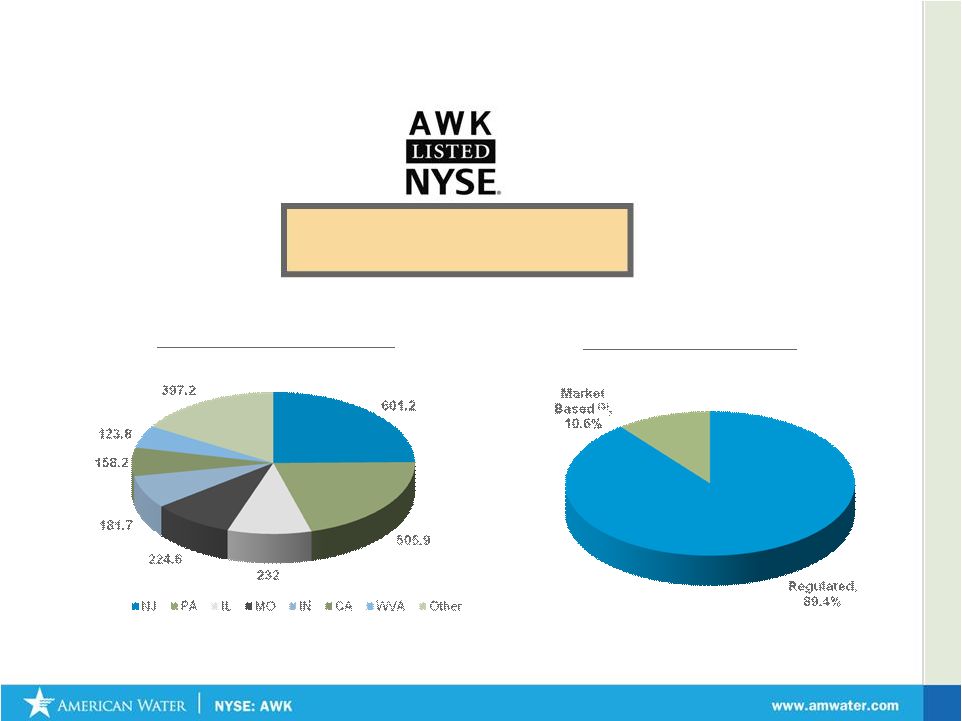
American Water: The Premier Water Services Provider in
North America
Geographic Diversity
(1)
Business Diversity
(1)
Market Cap: $4.7 Billion
Enterprise Value: $10.2 Billion
Average Volume Traded: 1.1 Million shares
(1)
2010 Revenues
(2)
Market data as of 2/9/11
(3)
Market Based includes Other
February 2011 |
 February 2011
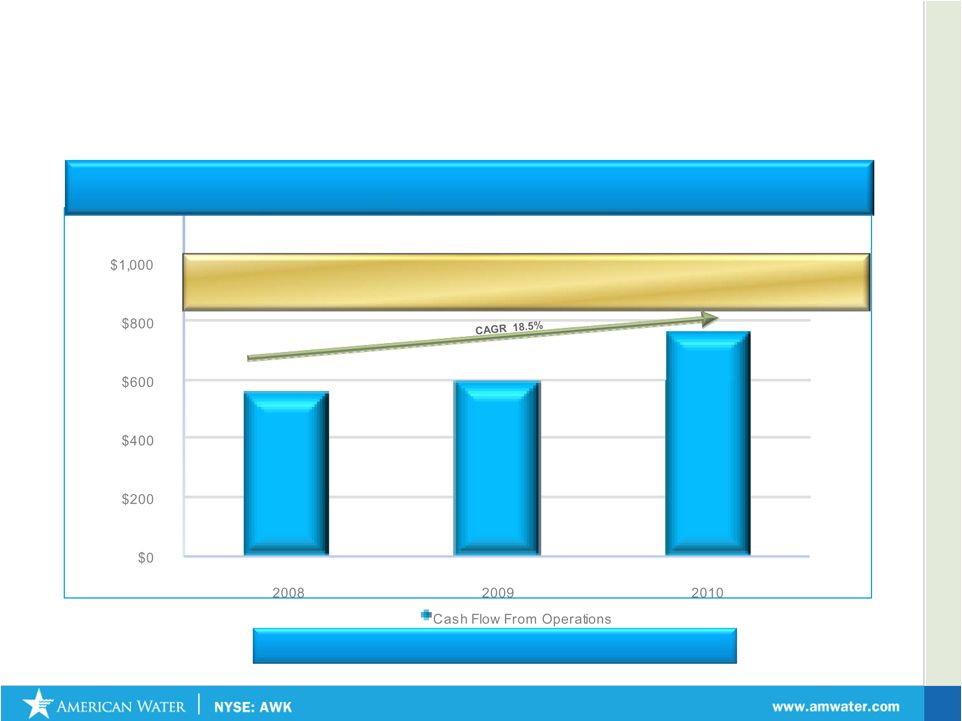
10
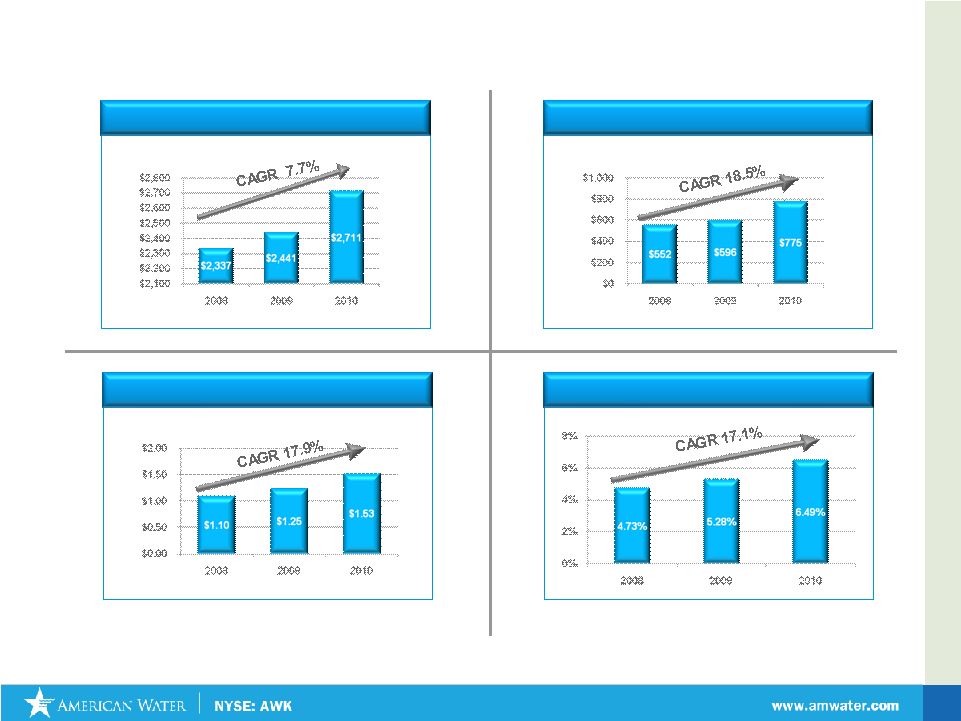
American Water: A Snapshot
•
2010 Preliminary Results
•
EPS and ROE exclude impairment charges
Cash Flow From Operations
(in millions)
Earnings Per Share
Operating Revenues
(in millions)
Return on Equity |
 11
What You’ll Hear Today
Sound Corporate Strategy and Key Initiatives
Portfolio Optimization
Regulatory Policy
Regulated and Market-Based Opportunities
Operational Excellence
Continued Investment in Infrastructure
Driving Excellent Results and Prospects
2010
Financial
Results
–
Expected
$1.53
Long Term Growth
2011 Guidance of $1.65-$1.75
Sustained 7-10% EPS Growth
Improving Rates of Return
Commitment to our Customers, Employees and Shareholders
February 2011 |
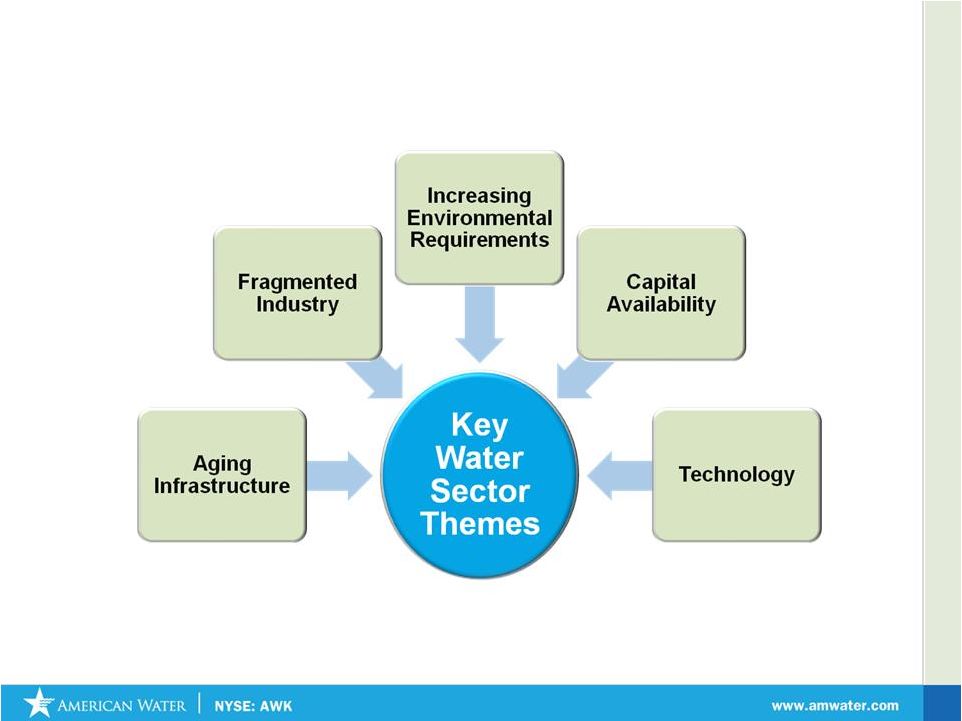 The
U.S. Water Industry February 2011
12 |
 February 2011
13
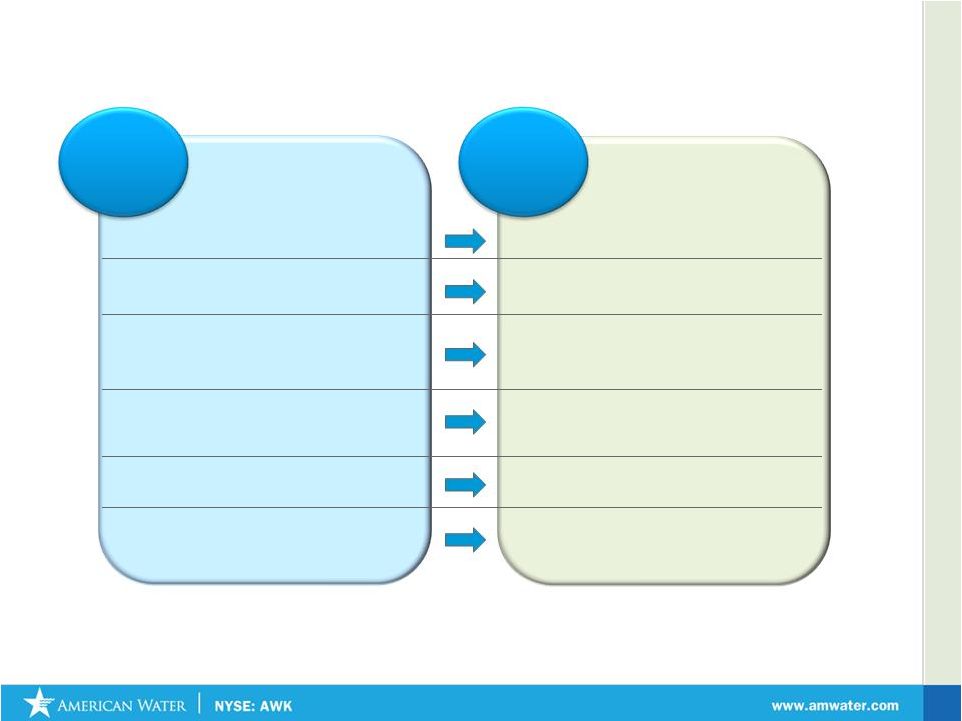
Water Industry Has a Favorable Utility Profile
Water Utility
Characteristics
Implications
•
Capital projects focused on maintaining
public health & safety standards
•
Regulators supportive of prudent projects
•
Water bills low portion of household budget
•
Essential product –
no substitutes
•
Demand is more price inelastic than
electric or gas
•
Raw input costs (i.e. water and chemicals)
less volatile than other utility commodity
costs (i.e. coal and natural gas)
•
More stable rates for customers
•
Cost forecasting and regulatory lag is more
manageable
•
M&A primarily small tuck-ins enabling
targets to meet health & safety standards
•
Regulators generally support the
strengthening of water systems via M&A
•
Water storage more feasible and cheaper
than electricity or gas storage
•
Water utilities can be more cost efficient
and responsive to demand fluctuations
•
Large water utilities diversified across
multiple geographies
•
Mitigates impact of localized severe
weather conditions / regulatory outcomes |
 February 2011
Our Values
•
Honesty and Integrity
•
Communication
•Teamwork
•
Excellence
•
Engagement
Our Mission
•
Providing safe, reliable water services
to our customers and communities
•
Driving Operational Excellence
•
Enabling employees to innovate
•
Ensuring long-term stewardship of all
resources
•Engaging customers, regulators and other
constituencies in solving critical water issues
•Earning a fair return for our shareholders
Our Vision
To be the trusted steward of
your precious resource –
water
What We Stand For
14 |
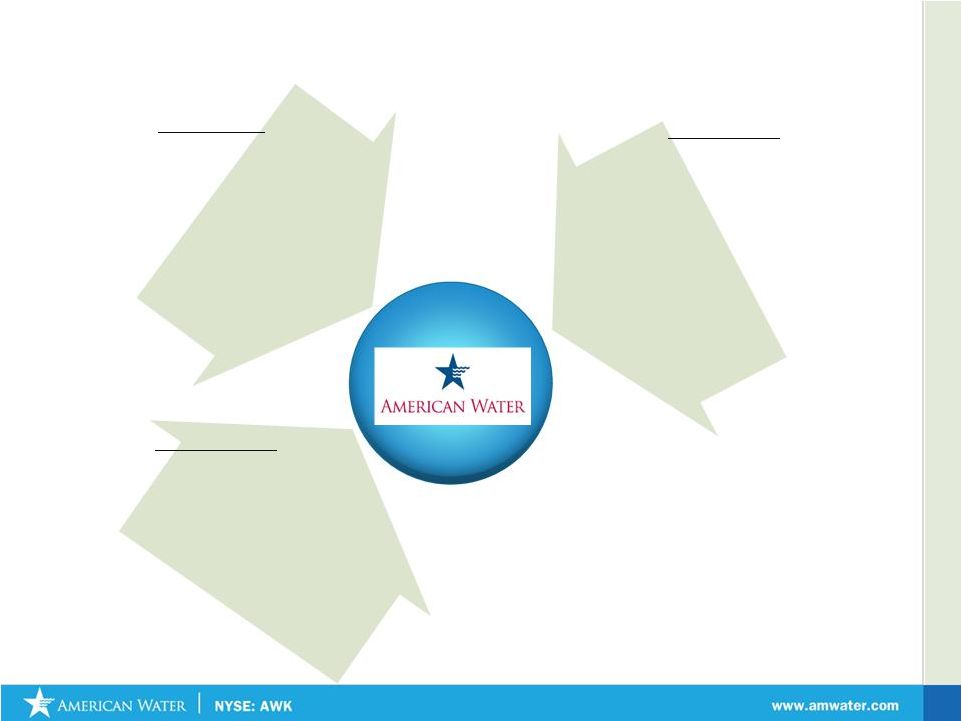
 15
American Water: Providing Value to Customers,
Employees and Shareholders
Operational
Excellence
Employer of
Choice
Sustainability
Customer
Focus
Regulatory &
Public Policy
Targeted
Growth
American Water provides value-added products
and services that address customers’
needs
Investor Driven
Customer Driven
Value
Price
Cost
February 2011 |
 February 2011
•
Earn appropriate
return
on investments
•
Promote constructive
regulatory frameworks
•
Grow Regulated
Businesses
through focused
acquisitions
•
Pursue “regulated-like”
opportunities
•
Focus on Operations
Efficiencies
Goals
Actions
Regulated Operations & Support
•
Invest in states where we can
add
value
to
customers
and
generate
an appropriate return
•
Move from “Rate Case Catchup”
to
“Regulatory Strategy”
•
Drive Operational Excellence
Market Based Operations
•
Regulated-Like
•
Value-Added Services
Future Pursuits
•
Disciplined pursuit of growth through
acquisitions and applying technological
expertise
Strategy Specifics
16 |
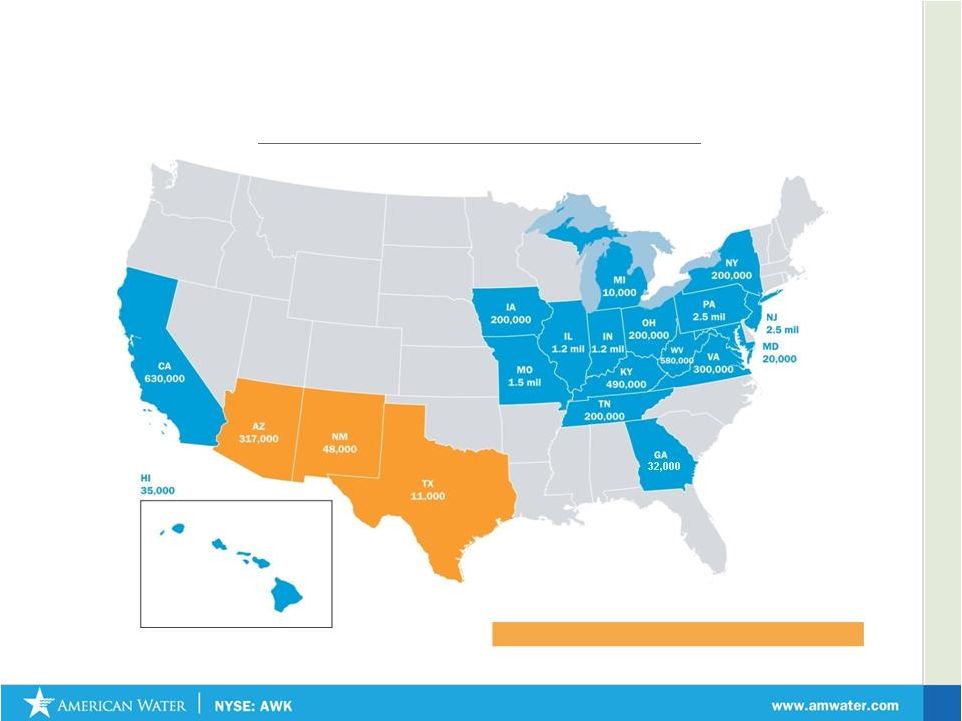 17
Strategy Specifics: Regulated Operations -
Invest in
states where we can add value
American Water Regulated Operations: Population Served
States we are in process of exiting thru Portfolio Optimization
32,000
* 2009 Data
February 2011 |
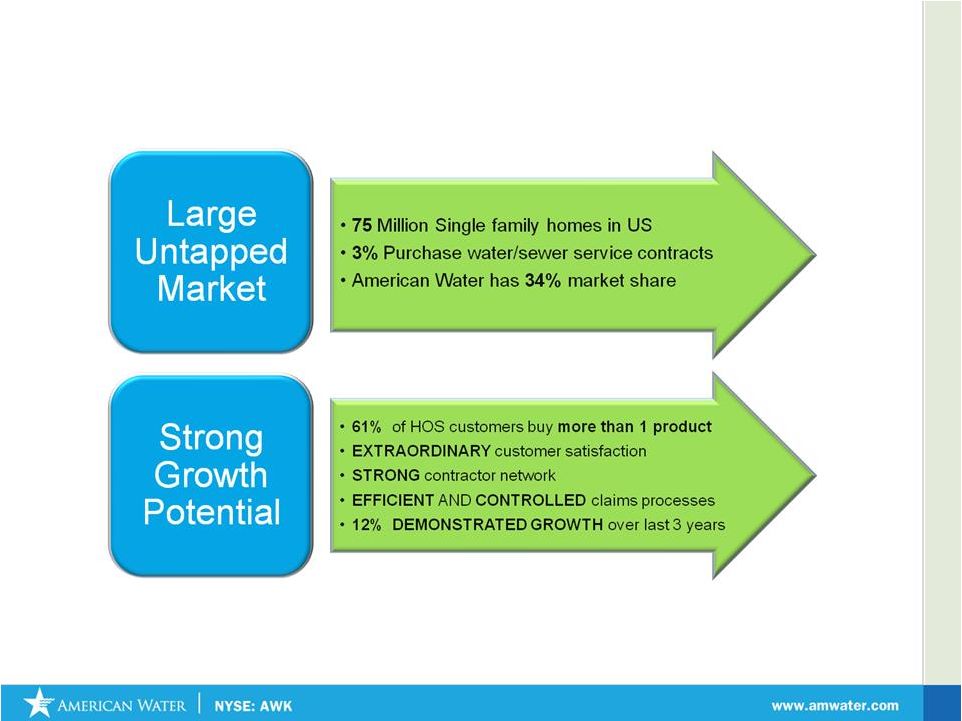 Strategy Specifics: Homeowner Services Growth
18
February 2011 |
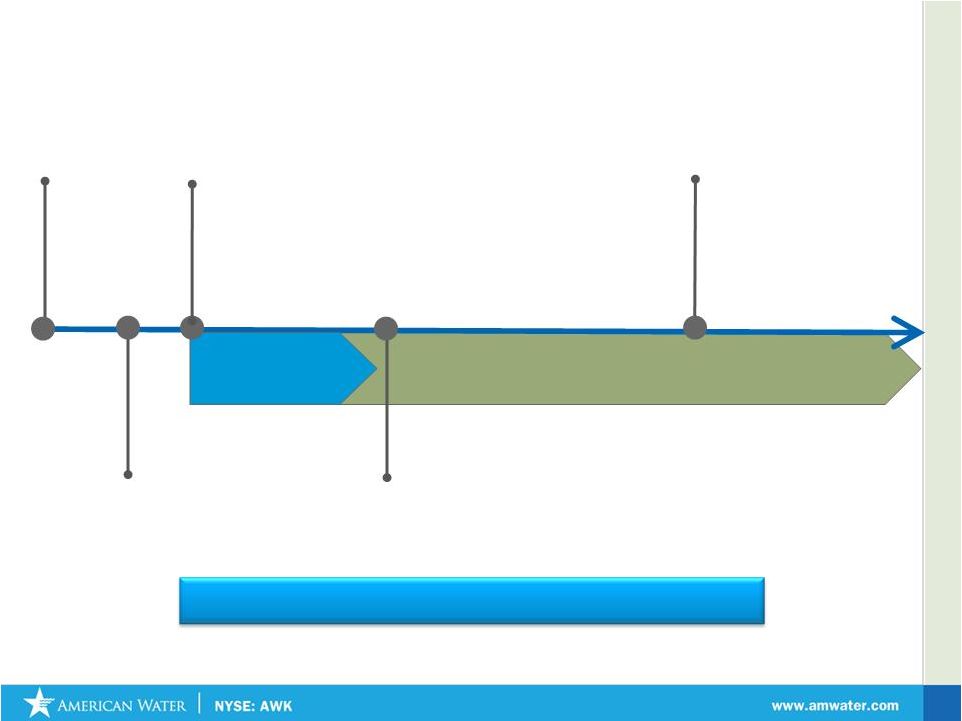
 19
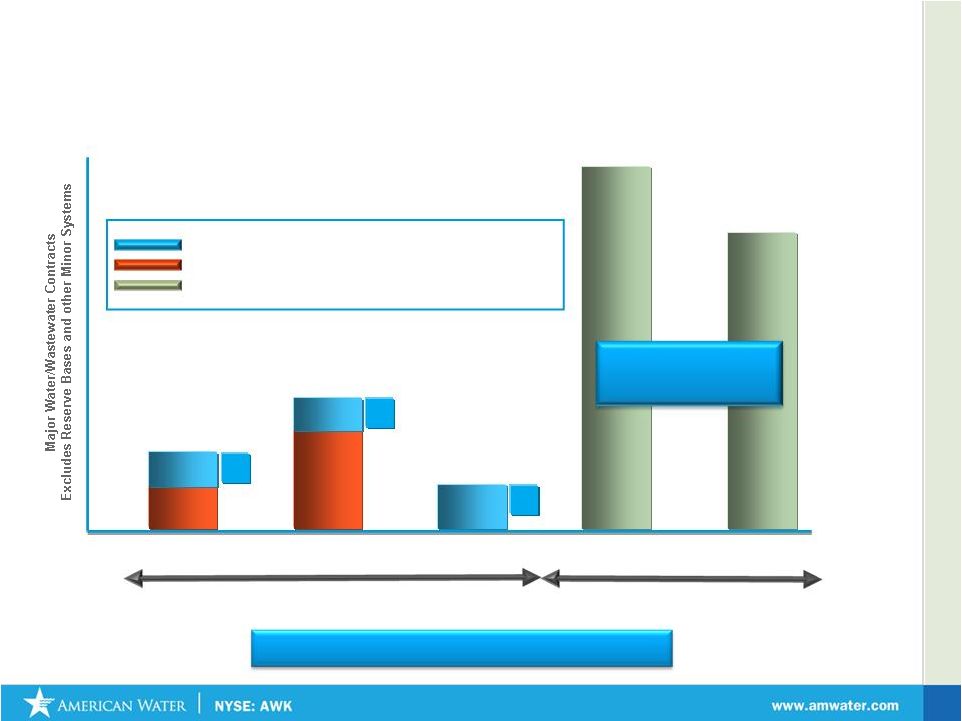
Strategy Specifics: Market Size of Military Utility
Privatizations
2011-13
2014-16
Major Water/Wastewater Contracts
to be Awarded
Contracts Awarded to American Water
Contracts Awarded to Competitors
Contracts Programmed by Dept. of Defense for Award
Over $2 Billion in Revenues Backlog
2002
2005-07
2008-10
Major Water/Wastewater Awards to Date
Market Opportunity
represents approximately
$11Bn in Total Revenues
3
3
4
7
12
4
February 2011 |
 February 2011
20
•
Shorter Term Contracts
•
Heavy Competition
•
High Risk
•
Low Margin
•
Resource Intensive
•
Minimal Scalability
Strategy Specifics –
Municipal Contract
Operations
The Current Model
Our Value Model
•
Longer Term Contracts
•
Form of Public Private
Partnership
•
Shared Risk
•
Performance Metrics
•
Price Redetermination
•
Priority of Payment |
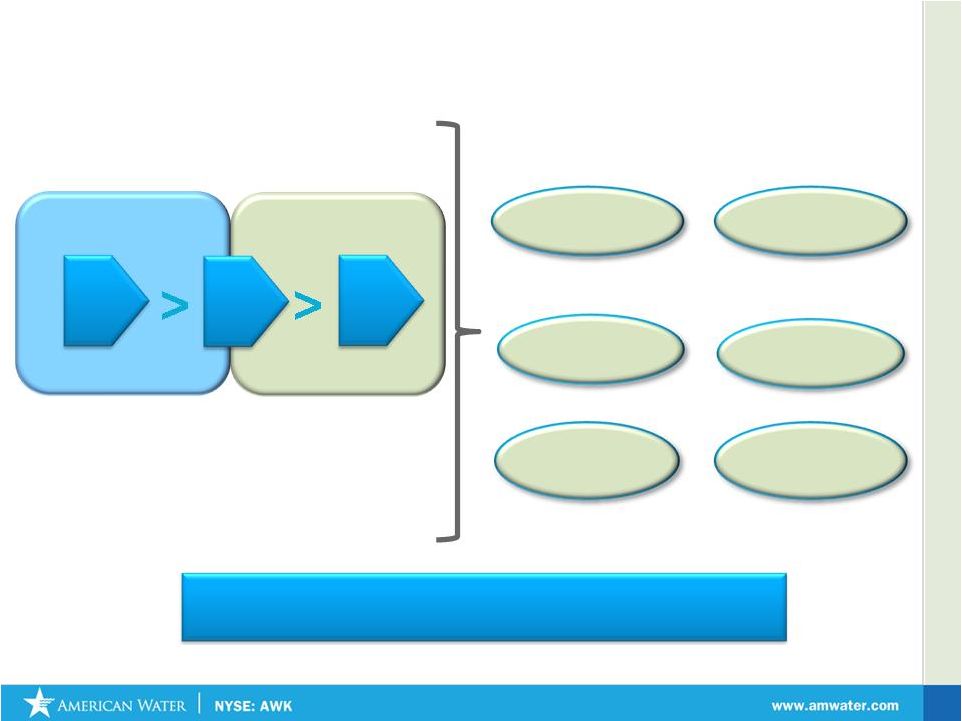
 21
Profitable
Growth
Drivers
Core
Businesses
•
Infrastructure
Investment
•
Tuck Ins
•
Homeowner Services
•
Military Utility
Privatizations
New
Markets
New
Products
Strategy Specifics: Growth Avenues
•
Acquisitions in new
territories
•
Homeowner Services
(new territories)
•
Military (beyond Army)
•
Homeowner Services
(new services)
•
New Municipal Contract
Model
•
Technology
.
February 2011 |
 February 2011
22
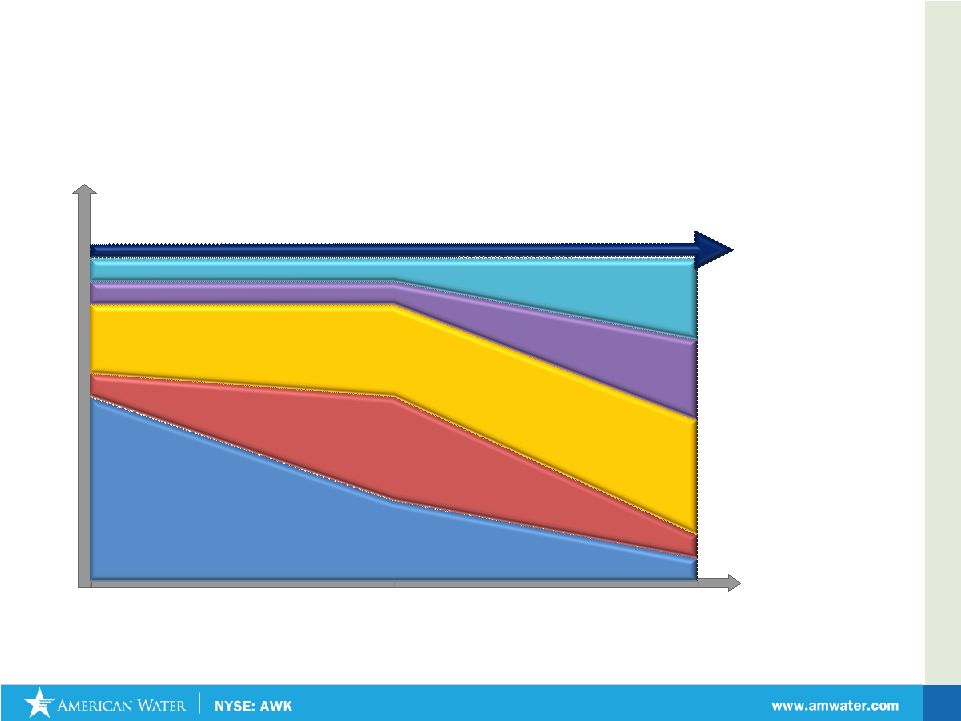
Investment Thesis: Sustained 7-10% EPS Growth
Future Growth
Short Term
Long Term
New Services
Regulated Investments
Acquisitions
Operational Excellence/
Efficiencies
ROE improvement
Long Term Growth
Conceptual Representation |
 Regulated Operations Initiatives
Walter Lynch
President & Chief Operating Officer
Regulated Operations |
 February 2011
24
Regulated Customers
Net Utility Plant
Total = 3,335,518
Regulated
Market Based
Both
Corporate headquarters
2010 EBIT
Total = $748 million
American Water’s Geographic Presence
Total = $11.1 billion
American Water’s Regulated Portfolio |
 American Water: Providing Value to customers
and shareholders
25
Operational
Excellence
Employer of
Choice
Sustainability
Customer
Focus
Regulatory &
Public Policy
Targeted
Growth
Value
Price
Cost
February 2011 |
 February 2011
Goal: To earn
appropriate
rate of return
on investments
Advancing consistent
operational
regulations
Shaping
constructive
regulatory policies
through
participation in
industry, regulatory
and legislative
settings
Working with
stakeholders to
determine
appropriate allowed
ROE
American Water’s Regulatory Initiatives
26 |
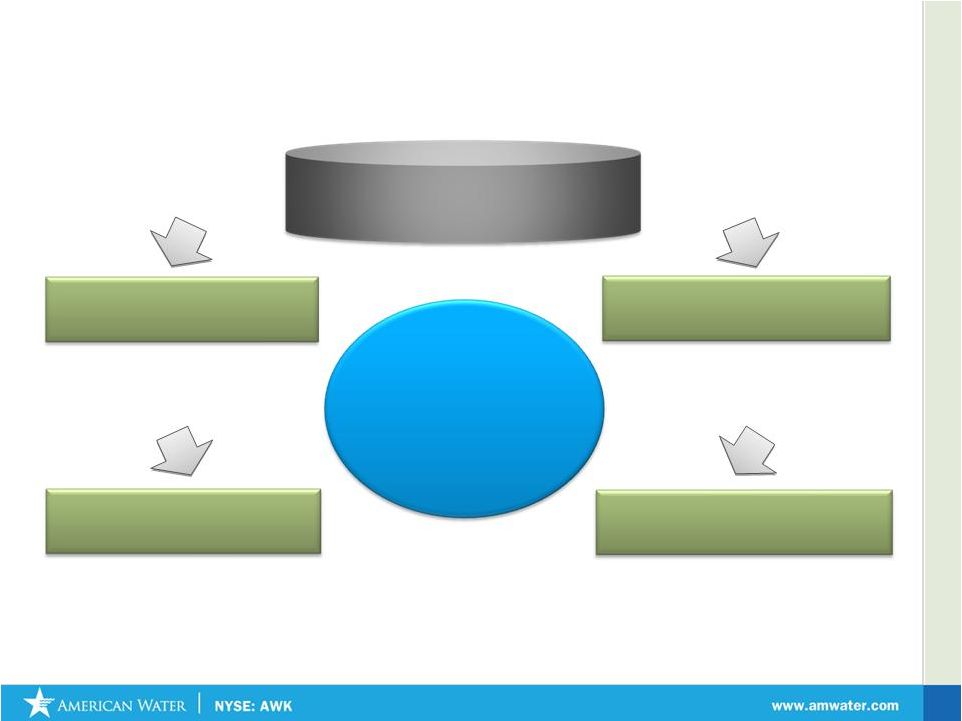
 American Water’s Business Transformation Project
Promote operating
excellence,
efficiency, and
economies of
scale
Business
Transformation
Project
Increase
employee
effectiveness and
satisfaction
Enhance the
customer
experience
Upgrade legacy
systems near
the end of
useful lives
February 2011
27 |
 28
American Water’s Business Transformation Project:
Looking Ahead
Implementation
Oct. ’10
System
Implementer
selection
Sep. ’11
Start EAM & CIS
(Target “go live”
Summer 2014)
May ’11
Start ERP
(Target “go live”
summer 2012)
Blueprint
Project to be completed late 2014
Jan. ’11
Blueprint Phase begins
(Completed in April 2011)
May ’10
SAP
software
selection
February 2011 |
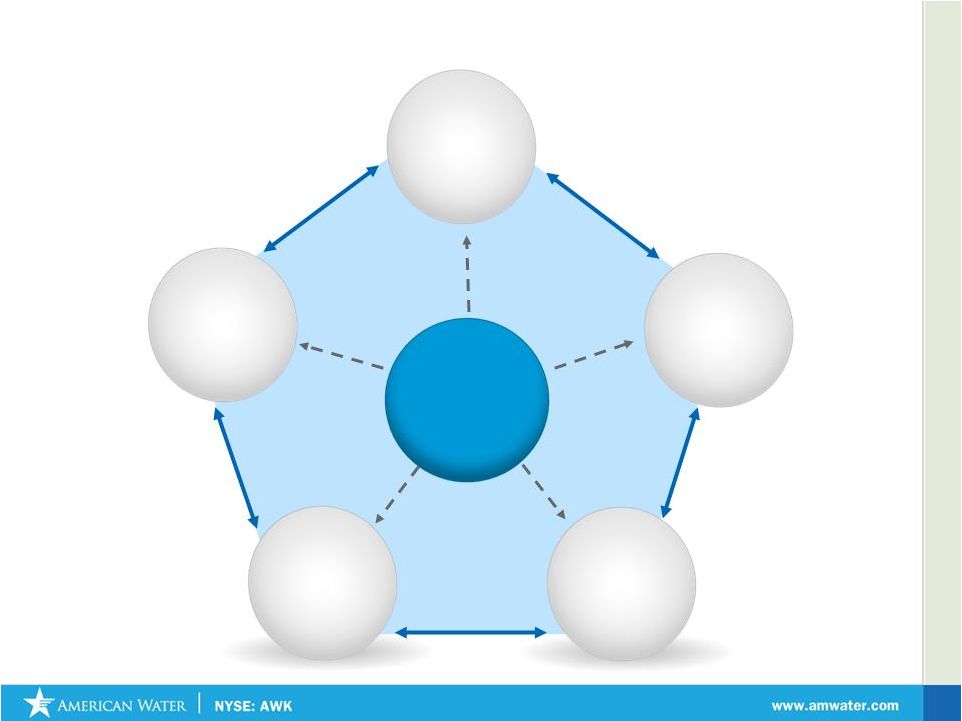
 American Water’s Portfolio Optimization Initiatives
Continue to Lower
Costs
Focus on
Value Drivers
Optimizing
Long-term
Value Through
Proactive
Management
Redeploy Value Into
Core Growth Markets
•
Balanced Portfolio Analysis
•
Focus Achieving Authorized
Rates of Return
•
Monetize Non-Producing Assets
•
Focused Capital Resources
•
Selective Acquisition Opportunities
•
Leverage Internal Growth
Explore Opportunities for
Long-Term Success
Drive Profitability and
Returns
29
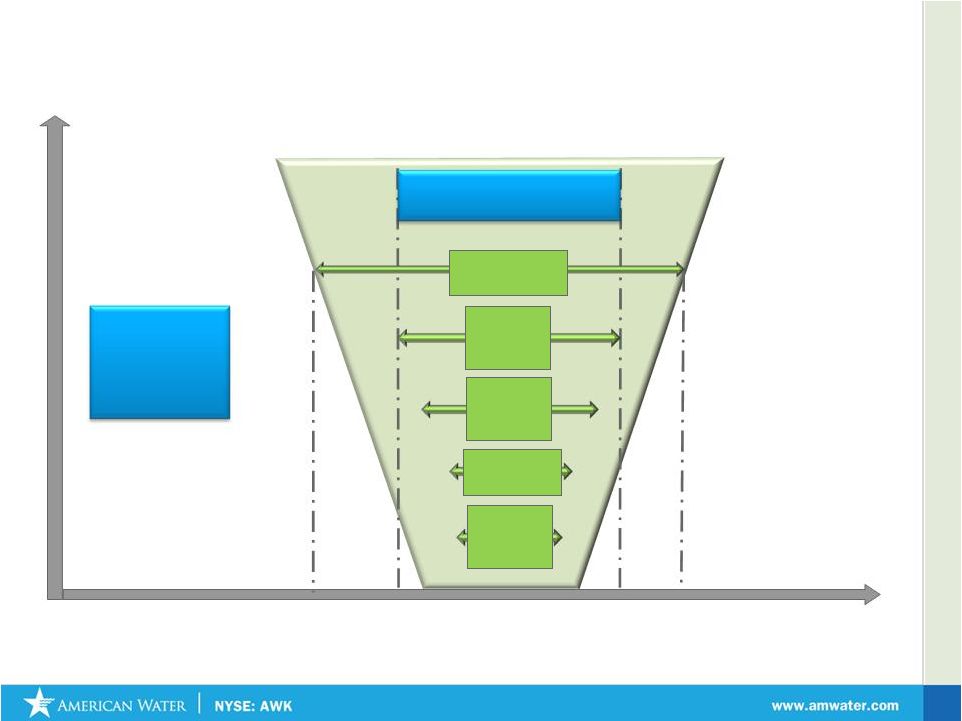
February 2011 |
 Portfolio
Optimization
Criteria
STRATEGIC
IMPORTANCE
& RELEVANCE
MATERIALITY OF
INVESTMENT
PROJECTED
CAPITAL
INTENSITY
REGULATORY
ENVIRONMENT
POTENTIAL TO
ACHIEVE
CRITICAL MASS
American Water’s Portfolio Optimization Criteria
30
February 2011 |
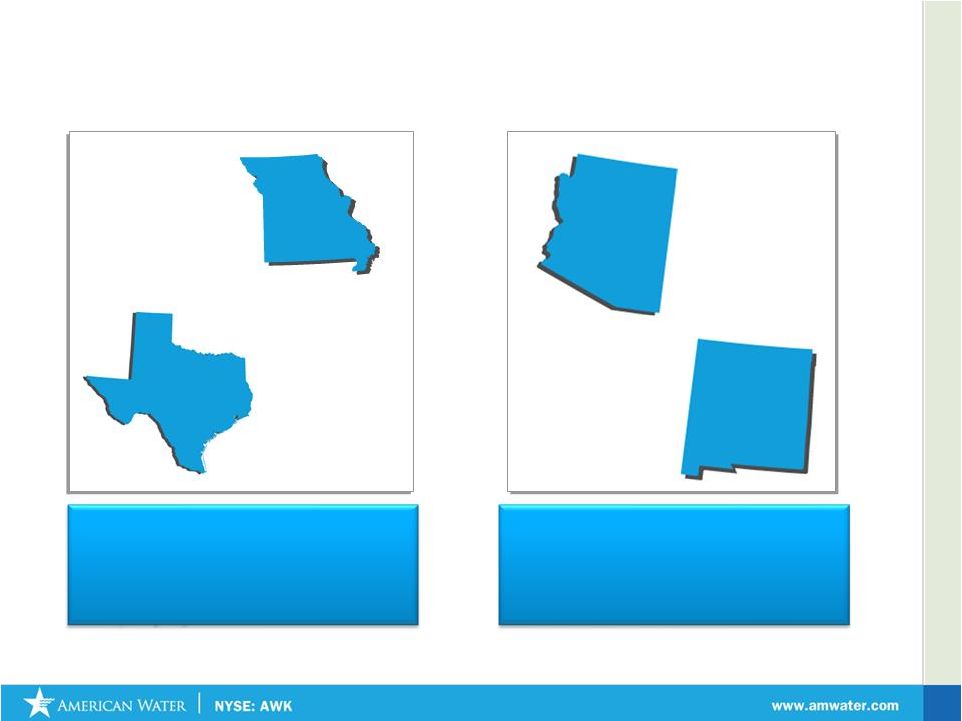 31
Portfolio Optimization Implementation
*Transaction Details
•
Sale Price: $470 million
•
Sale Multiple: 1.14x Book Equity
•
AZ Rate Base
(1)
: $319 mm
•
NM Rate Base
(1)
: $34 mm
Acquired by
American
Water
Sold to AQUA
MO
TX
NM
AZ
Agreement to
sell by
American
Water
* Missouri Transaction Details
•
Purchase Price: $3 million
•
Annual Revenue of $3.4 million
•
59 wastewater systems
•
10,000 people served
(1) Rate base approved in rate cases by respective commissions
*Transactions subject to closing risk and regulatory approval
February 2011 |
 February 2011
32
Please review the corresponding video link "KY Capex
Video" on the American Water website |
 Financial Overview
Ellen Wolf
Senior Vice President & Chief Financial Officer |
 February 2011
85%
90%
95%
100%
105%
110%
115%
120%
AWK
DJ Util
S&P 500
0.40
0.45
0.50
0.55
0.60
0.65
0.70
AWK Beta
34
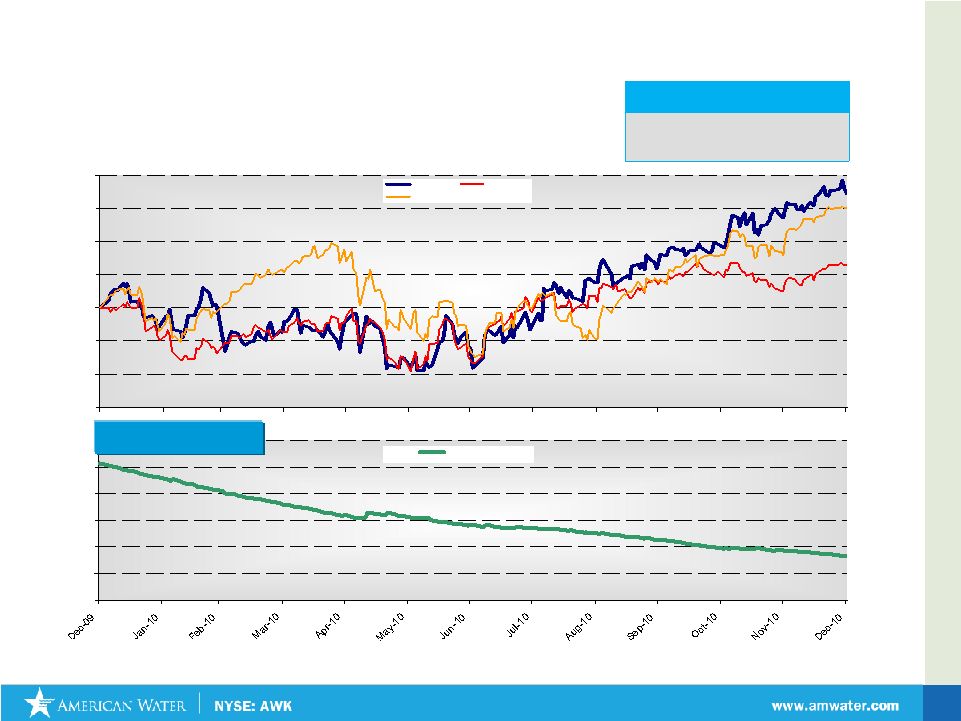
Price as a percent of base (December 31, 2009 = 100%)
Shareholder Return
YTD
American Water
S&P 500
Dow Jones Utilities
+17.3%
+15.1%
+6.5%
S&P 500 Beta = 1
Total Shareholder Return : American Water vs. Indices
(January 1, 2010 –
December 31, 2010) |
 February 2011
35
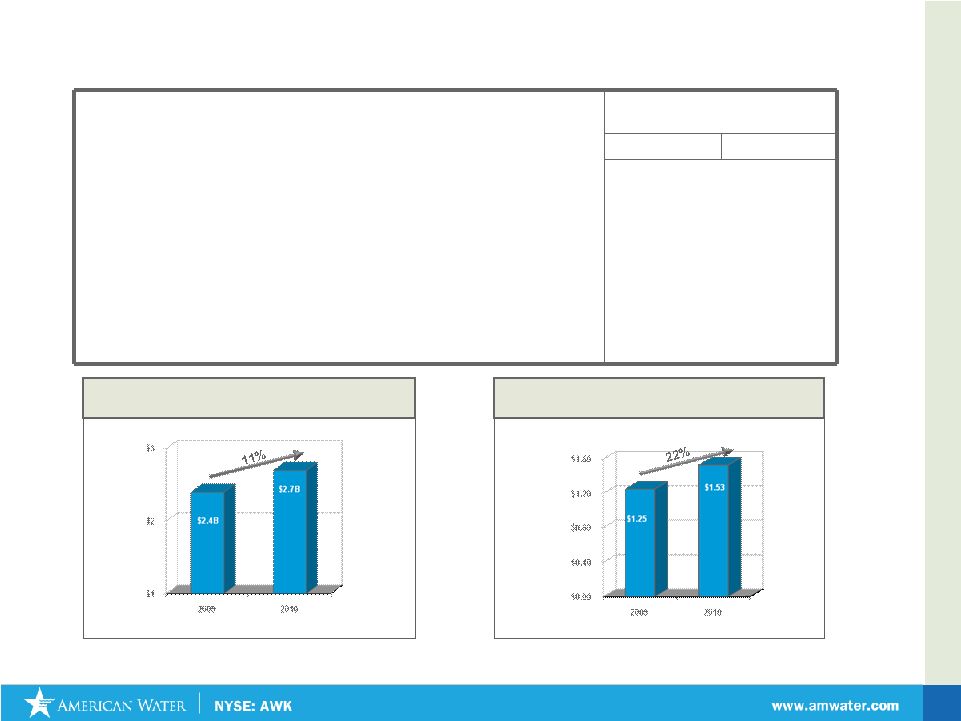
For the Year Ended
December 31,
2010
2009
(In thousands, except per share data)
Revenue
$2,710,677
$2,440,703
Gross Margin
$748,091
$623,609
Gross Margin %
27.6%
25.6%
Net income to common
$267,827
$209,941
Common dividends paid
$150,301
$137,331
Average common shares outstanding during the period
175,124
168,164
Net income per common share
$1.53
$1.25
2010 Preliminary Financial Results
Operating Revenues (in billions)
Earnings per Share
*
Note: 2009 excludes impairment charge |
 February 2011
36
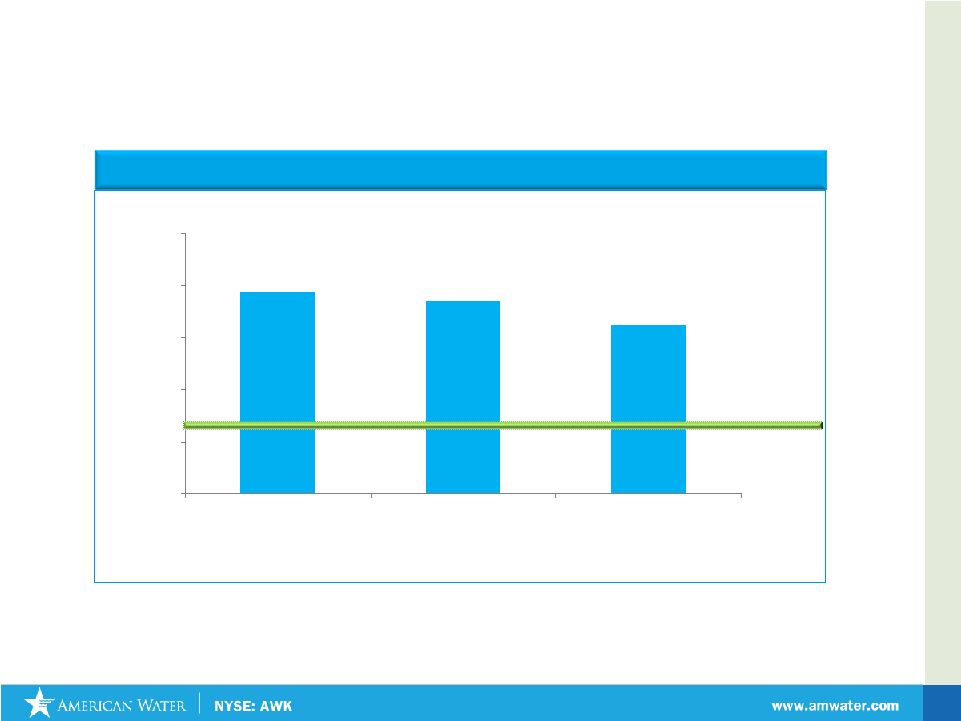
Adjusted O & M Efficiency Ratio*
49.4%
48.5%
46.2%
30%
35%
40%
45%
50%
55%
2008
2009
2010
Regulated O&M Efficiency Ratio Continues to
Improve
*O&M Efficiency Ratio = operating and maintenance expenses / revenues,
adjusted for purchased water Long Term Goal:
Below 40% |
 February 2011
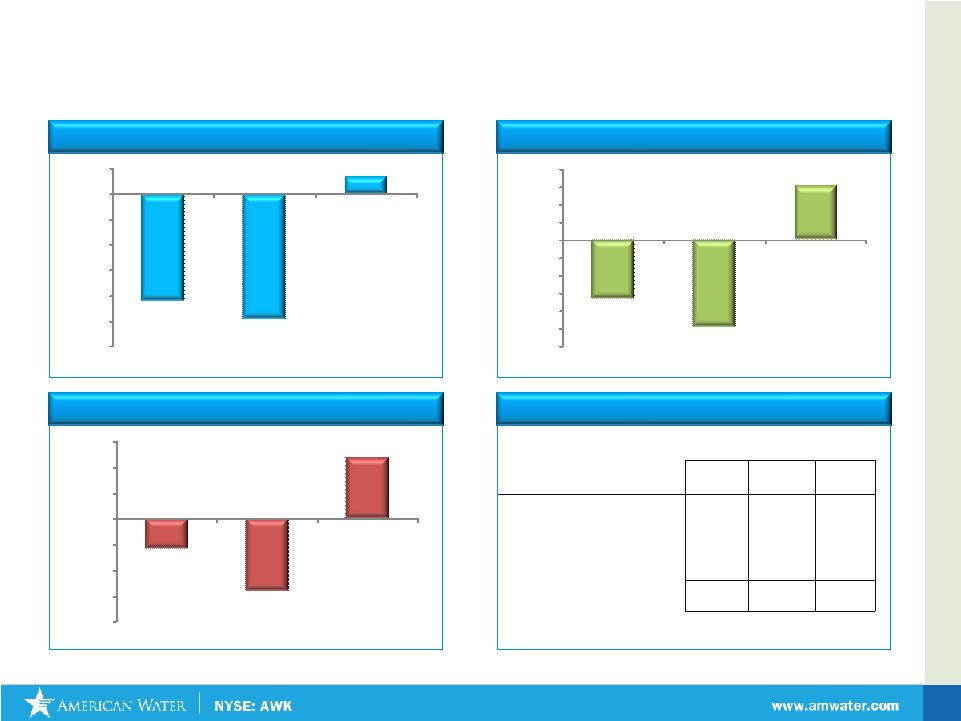
37
Residential
Commercial
Industrial
American Water Total
American Water Customer –
Gallons Consumption –
Period over Period Analysis
-5.8%
-13.8%
11.9%
-20.0%
-15.0%
-10.0%
-5.0%
0.0%
5.0%
10.0%
15.0%
2007-2008
2008-2009
2009-2010
-4.2%
-4.9%
0.7%
-6.0%
-5.0%
-4.0%
-3.0%
-2.0%
-1.0%
0.0%
1.0%
2007-2008
2008-2009
2009-2010
-3.3%
-4.9%
3.1%
-6.0%
-5.0%
-4.0%
-3.0%
-2.0%
-1.0%
0.0%
1.0%
2.0%
3.0%
4.0%
2007-2008
2008-2009
2009-2010
Fiscal Year
Gallons by customer class
2008
2009
2010
Residential
213,423
203,701
204,575
Commercial
90,542
86,120
88,749
Industrial
42,032
36,212
40,539
Public and Other
58,838
55,911
56,604
Total Water Sales Volume
(MM gal)
404,835
381,314
390,467 |
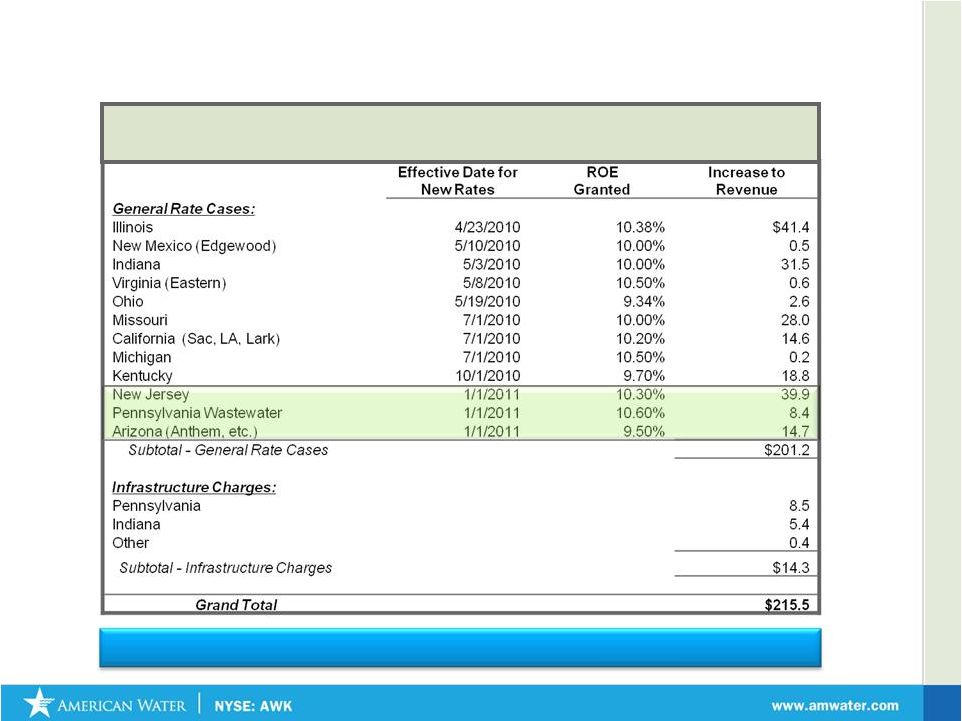 Rate Cases & Infrastructure Charges Granted in
2010 that will have impact on 2011
Core Strategy: Continuing Effort to Earn Appropriate Rate of
Return on Prudent Investments
Average Timing of Rate Cases: Approximately every 2 Years
February 2011
38 |
 February 2011
39
Rate Cases Awaiting Final Order as of December 31, 2010
Index of Rate Case Status
1 - Case Filed
2 - Discovery (Data Requests, Investigation)
3 - Negotiations / Evidentiary Hearings / Briefings
4 - Recommended order issued / settlement reached, without interim
rates 5 - Interim rates in effect, awaiting final order
Docket /
Revenue Increase
ROE
Rate Base
Filing
Case Number
Date Filed
Filed
Requested
(Filed)
Status
Virginia
Case No. PUE 2010-00001
3/8/2010
$6.9
11.50%
$99.1
5
California
Case No. A 10-07-007
7/1/2010
$37.3
10.20%
$409.6
2
West Virginia
Case No 10-920-W-42T
6/22/2010
$18.4
11.50%
$437.6
3
Tennessee
Case No 2010-00189
9/17/2010
$10.0
11.50%
$125.5
2
Arizona
W-01303A-10-0448
11/3/2010
$20.8
11.50%
$148.9
1
Total
$93.4
$1,220.7
* Final Order not yet issued. Interim rates are in effect.
|
 February 2011
40
Key Business Assumptions
Continued decline in water usage per customer
Low flow fixtures
Declining family size
Unemployment
General conservation (promoted by US EPA)
Downward trend has accelerated in most states since the late
1990’s
Continued improvement in operating efficiency and cost structure
Continued rate case recovery of prudent investments
Gradual economic recovery by industrial and commercial
customers
Housing market slow to recover |
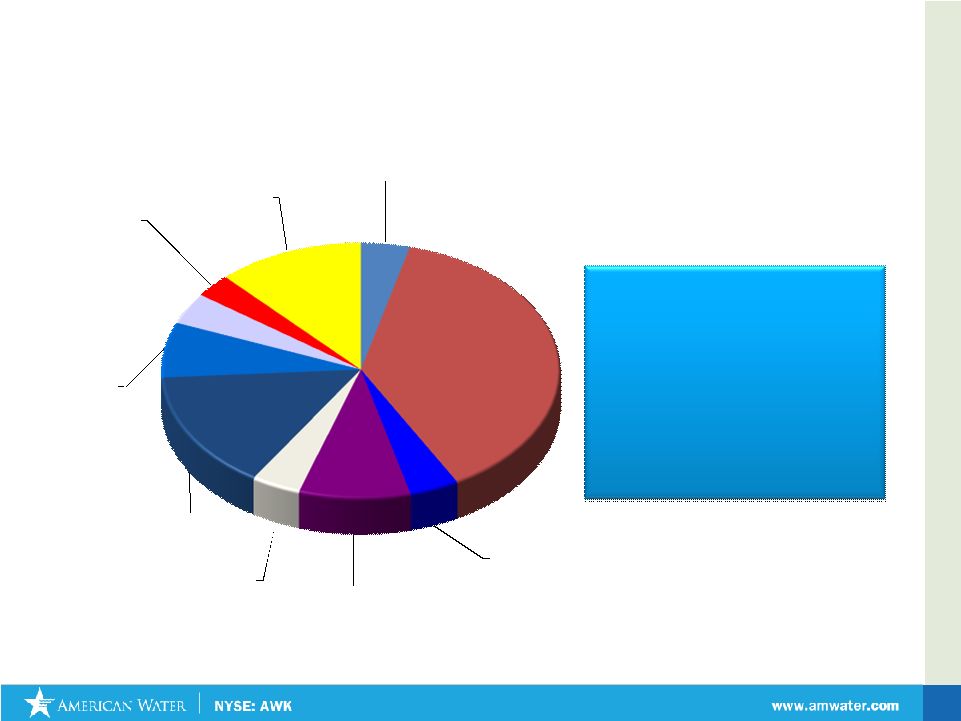 February 2011
Land, Bldgs, &
Structures
4%
Distribution
38%
Pumping and
Power
4%
Treatment
9%
Storage
4%
Customer Meters
15%
Source of Supply
incl Mains
7%
Info. and Comm.
Systems *
4%
Wastewater
3%
Other
12%
Capital Expenditure Plan, by Asset Type: 2011-2013
* includes Business Transformation capital spend
•
$800 -
$1 Billion in Capex
to be spent each year for
the foreseeable future
•
20% of Capital
Expenditures will be
recovered by
Infrastructure Surcharge
mechanisms
41 |
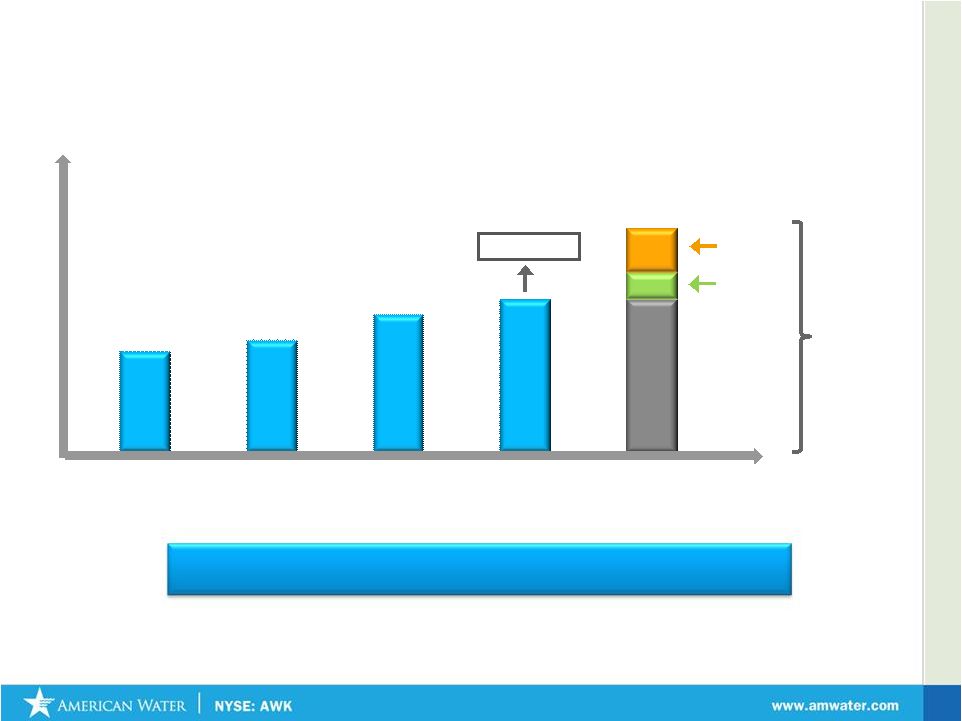
 February 2011
42
Cash Flow from Operations Continues to Improve
Relative to Capital Expenditures (CAPEX)
No anticipated need for Equity Offering in 2011
Improving Cash Flow Metrics Increasingly Offset
Need for Capital Raising
CAPEX $800 Million -
$1 Billion |
 * Not to scale
Key
Factors
Influencing
Earnings
* Not to scale
2011
Earnings
Per
Share
Guidance:
$1.65
-
$1.75
Interest
Rates
(+/-
1%)
2011 EPS Guidance
$1.65 -
$1.75
Consumption
(+/-1%)
Fuel &
Power
(+/-
10%)
Chemicals
(+/-
10%)
O&M
Expense
(+/-
1%)
$1.77
$1.63
$1.65
$1.75
February 2011
43 |
 4.73%
5.28%
6.49%
2008
2009
2010
2011
Allowed ROE
Expected Return on Equity
10 % -
10.5 %
ROE
(2)
6.8% -
7.2%
1.
ROE calculation excludes impairment charges
2.
Range of allowed ROE
1.25%
Parent Co.
Debt
Opportunity
American Water continues to close ROE Gap
February 2011
44 |
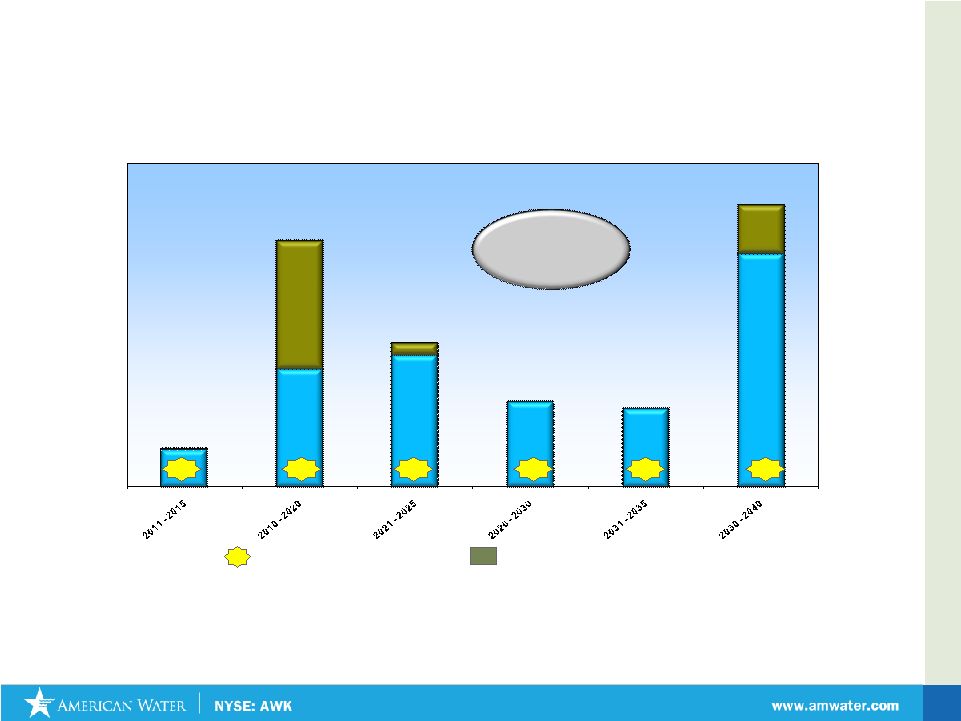 February 2011
45
$235
$728
$816
$524
$485
$1,439
$7
$790
$70
$303
Total Debt:
$5,397M
5.5%
6.0%
6.0%
6.3%
6.0%
Weighted Average Interest Rates
Debt Maturities
(in millions)
Parent Company Debt
6.4%
*
* Amount excludes Preferred Stock with Mandatory Redemptions
|
 February 2011
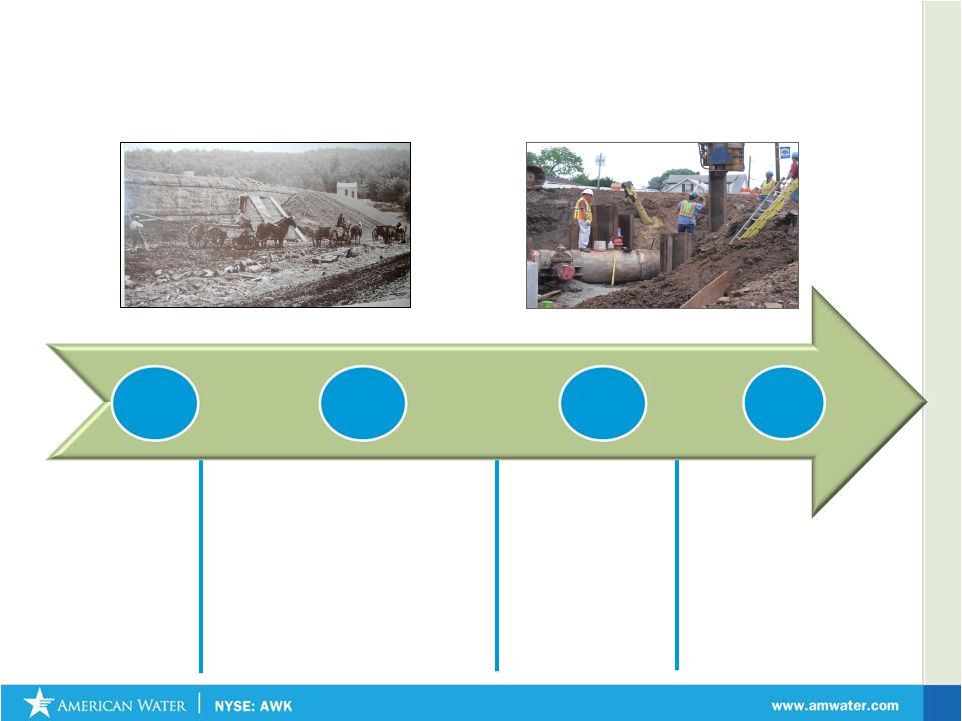
125 years Investing in Water Infrastructure and
paying Dividends to Shareholders
1886
1947
2003
2008
Dividend
paid to
private
holders
American Water
Listed on NYSE –
Dividend paid to
common
shareholders
RWE takes
AWK private.
Dividend
paid to
shareholder
AWK IPO
Lists on
NYSE. Pays
dividends to
common
shareholders
Watermain
work in Pennsylvania. in the early 1900’s
Infrastructure improvement in New Jersey in 2009
46 |
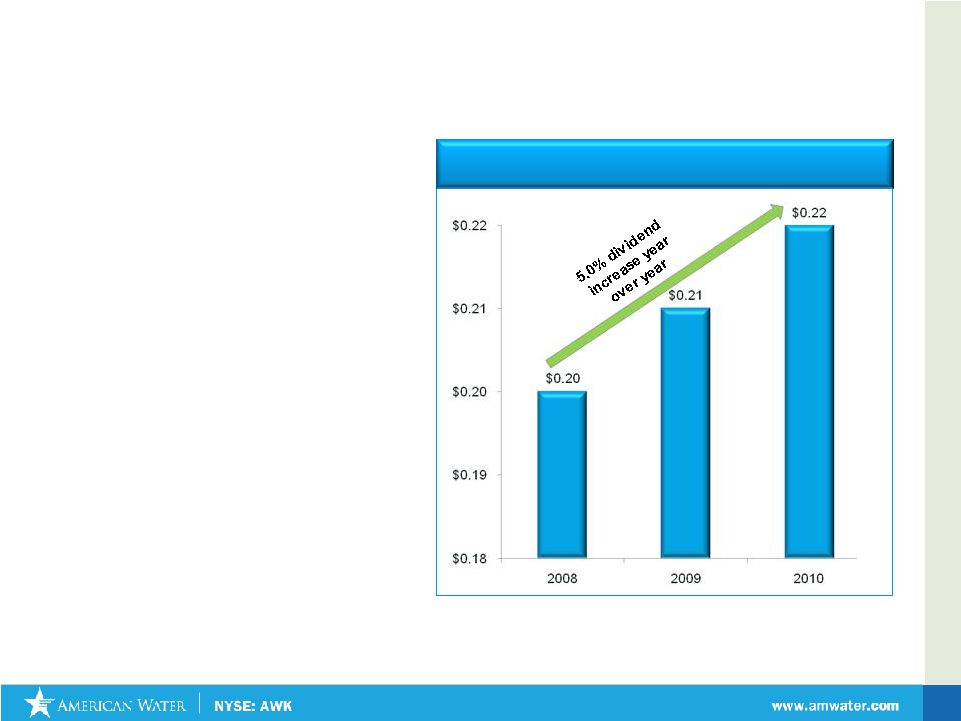 February 2011
Recent Dividend History
Quarterly Dividend Rate as of Year-end
•
Key component of American
Water’s total shareholder return
proposition
•
Dividend Growth –
Board of
Directors increased dividend 5%
to $0.22 or $0.88 annualized
•
Dividend Yield –
3.3% at
2/9/2011
•
Growth in Dividend reflects
growth in Net Income
47 |
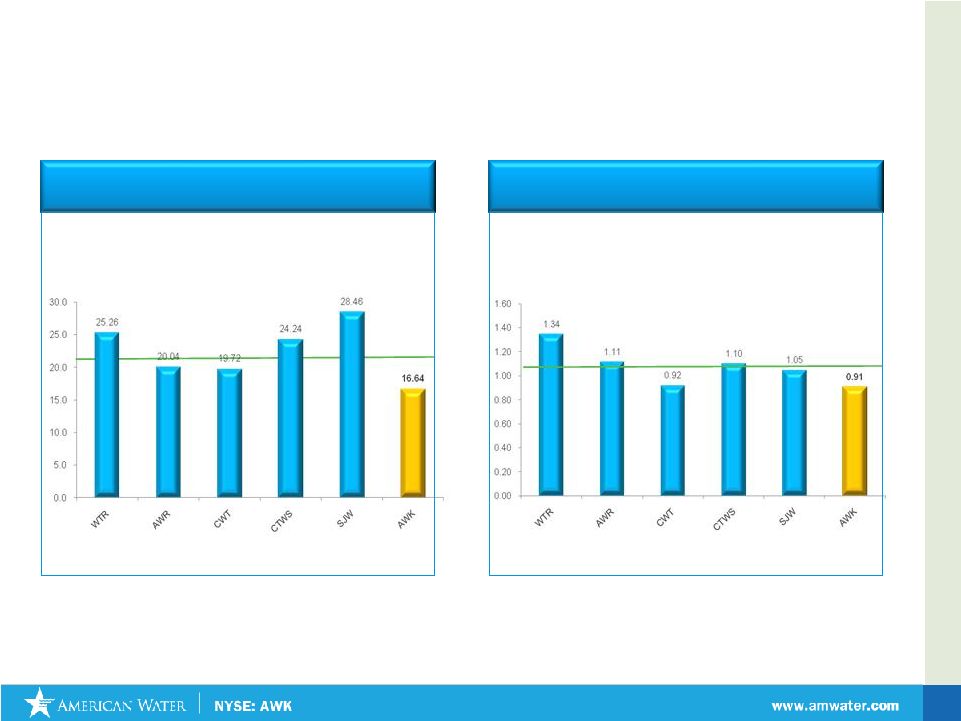 February 2011
P/E Ratio
Enterprise Value* / Net PP&E*
American Water –
A Compelling Value
48
AW Stock Price at Average PE: $34.04
AW Stock Price at Highest PE: $43.26
AW Stock Price at Average EV/Net PP&E: $35.29
AW Stock Price at Highest EV/Net PP&E: $52.30
Average
Average
Close price 12/31/10 unless otherwise indicated; trailing twelve months diluted GAAP EPS as of
9/30/2010 *Data from Bloomberg Data Systems |
 Closing |
 February 2011
50
What to Expect from American Water in 2011
Start execution of Portfolio Optimization Initiative
December 15, 2010: Announcement of acquisition of Missouri
properties & sale of Texas American
January 24, 2011: Announcement of sale of Arizona American and
New Mexico American
Resolve Rate Cases worth $93MM of filed Annualized Revenues by
December 31, 2011
Initiate state specific efforts to address declining usage
Continue reduction in Operating Efficiency Ratio
Five-year goal below 40%
Increase Earned Regulated Return
Expand Market Based businesses with focus on Homeowner Services &
Military Contract Operations
Optimize Municipal Contract Operations Business Model
|
 February 2011
American Water –
A Compelling Value
Value Proposition
Market
Leader
Strong Visible
Growth
Proven
Management
Trades at
Discount to Peers
Sound Regulatory
Framework
51 |
 February 2011
Investor
Relations
Contacts:
•
Ed Vallejo
Vice
President
–
Investor
Relations
Edward.vallejo@amwater.com
•Muriel
Lange Manager
–
Investor
Relations
Muriel.lange@amwater.com
Tel: 856-566-4005
Fax: 856-782-2782
52 |
 |