Attached files
| file | filename |
|---|---|
| 8-K - CURRENT REPORT - Air Transport Services Group, Inc. | d8k.htm |
 Investor Meetings
February 2011
Joe Hete, President & CEO
Quint Turner, CFO
Exhibit 99.1 |
  Safe Harbor,
Non-GAAP Reconciliations Except
for
historical
information
contained
herein,
the
matters
discussed
in
this
release
contain
forward-looking
statements
that
involve
risks
and
uncertainties.
There
are
a
number
of
important
factors
that
could
cause
Air
Transport
Services
Group's
("ATSG's")
actual
results
to
differ
materially
from
those
indicated
by
such
forward-looking
statements.
These
factors
include,
but
are
not
limited
to,
changes
in
market
demand
for
our
assets
and
services,
the
cost
and
timing
associated
with
the
modification
of
Boeing
767-200
and
767-300
aircraft,
ABX
Air’s
ability
to
maintain
on-time
service
and
control
costs
under
its
new
operating
agreement
with
DHL,
and
other
factors
that
are
contained
from
time
to
time
in
ATSG's
filings
with
the
U.S.
Securities
and
Exchange
Commission,
including
its
Annual
Report
on
Form
10-K
and
Quarterly
Reports
on
Form
10-Q.
Readers
should
carefully
review
this
release
and
should
not
place
undue
reliance
on
ATSG's
forward-looking
statements.
These
forward-looking
statements
were
based
on
information,
plans
and
estimates
as
of
the
date
of
this
release.
ATSG
undertakes
no
obligation
to
update
any
forward-looking
statements
to
reflect
changes
in
underlying
assumptions
or
factors,
new
information,
future
events
or
other
changes.
ATSG, Inc. Non-GAAP Reconciliation
EBITDA,
Adjusted
EBITDA
and
Net
Debt
are
non-GAAP
financial
measures
and
should
not
be
considered
alternatives
to
net
income
(loss)
or
any
other
performance
measure
derived
in
accordance
with
GAAP.
EBITDA
is
defined
as
income
(loss)
from
operations
plus
net
interest
expense,
provision
for
income
taxes,
depreciation
and
amortization.
Net
Debt
is
defined
as
Long-term
debt
obligations
plus
Current
portion
of
debt
obligations
minus
Cash
and
cash
equivalents.
The
Company’s
management
uses
these
adjusted
financial
measures
in
conjunction
with
GAAP
finance
measures
to
monitor
and
evaluate
its
performance,
including
as
a
measure
of
liquidity.
EBITDA,
Adjusted
EBITDA
and
Net
Debt
should
not
be
considered
in
isolation
or
as
a
substitute
for
analysis
of
the
Company’s
results
as
reported
under
GAAP,
or
as
alternative
measures
of
liquidity.
2008
2009
9Mo.10
3Q09
3Q10
(56,619)
45,358
43,352
4,647
16,670
Impairment of goodwill & intangibles
91,241
0
0
0
0
34,622
45,358
43,352
4,647
16,670
Interest Income
(2,335)
(449)
(241)
(74)
(83)
Interest Expense
37,002
26,881
14,424
6,236
4,641
Depreciation and amortization
93,752
83,964
65,310
19,954
22,758
163,041
155,754
122,845
30,763
43,986
GAAP Pre-tax Earnings (Loss)
Reconciliation Statement ($ in 000s)
Adjusted EBITDA from Cont. Oper.
from Continuing Operations
Adjusted Pre-Tax
Earnings
from Continuing Operations
Earnings from Continuing Operations Before Interest, Taxes, Depreciation
& Amortization (Adjusted EBITDA) Net Debt
12/31/07
12/31/08
12/31/09
9/30/10
Long term debt obligations
567,987
450,628
325,690
277,031
Current portion of debt obligations
22,815
61,858
51,737
36,112
Cash and cash equivalents
(59,271)
(116,114)
(83,229)
(44,465)
Net Debt
531,531
396,372
294,198
268,678
Reconciliation Statement ($ in 000s)
1 |
 The
ATSG Story Premier Provider of Freighter Leasing & Support Services
Global Reach Via
Long-Term Relationships
With Large Global Clients
Favorable
Air Cargo
Industry Dynamics
ROIC Discipline
Drives Growth Capital
Allocations
Leading Position in
Converted Medium
Widebody Freighter Market
Strong Balance Sheet,
Lower-Risk
Free Cash Flow
Differentiated Model
Features ACMI & Dry
Leasing, Support Services
2 |
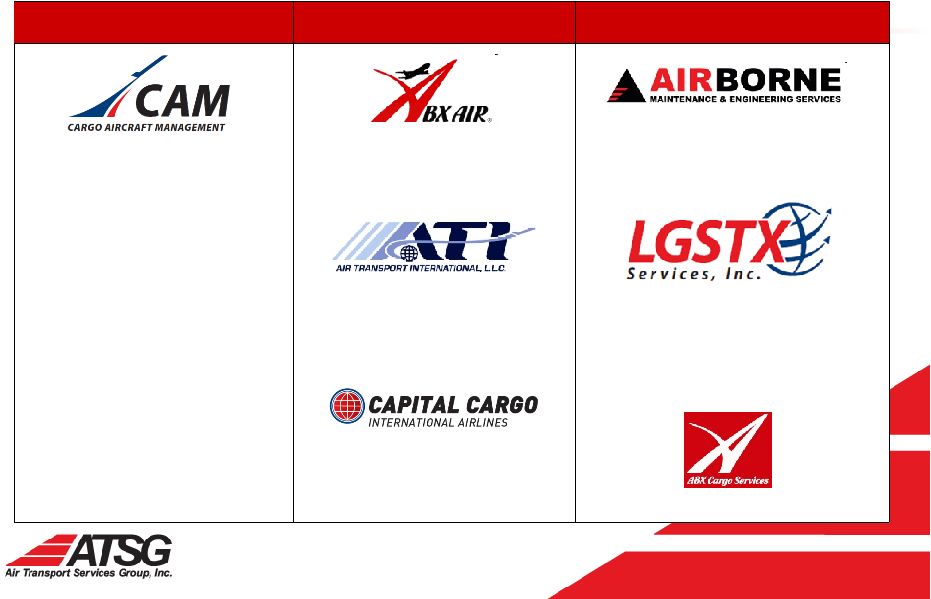 3
•
Provides 727, 757 ACMI services
•
Customers include BAX Schenker
and DHL
•
Provides 767, DC-8, DC-8 Combi
ACMI services
•
Customers include BAX Schenker,
U.S. Military and Qantas
•
Provides 767 ACMI/CMI services
•
Customers include DHL, JAL and
TNT
ACMI / CMI Businesses
Dry Leasing
Support Services
•
Heavy & line maintenance, component
overhaul, engineering & manufacturing
•
Customers include major airlines,
private operators
•
Dry leases 767, 757, 727 and DC-
8 freighters to ATSG airlines and
external customers
•
Access to engine maintenance
and component services
•
External customers include DHL,
Amerijet, CargoJet, First Air
•
Equipment leasing, and equipment and
facility maintenance services
•
Customers include: DHL, Allegiant Air,
Branson Airport, Tampa Intnl
Jet Center
•
Logistic support services
•
Sort management services for USPS
Unique Blend of Complementary Businesses |
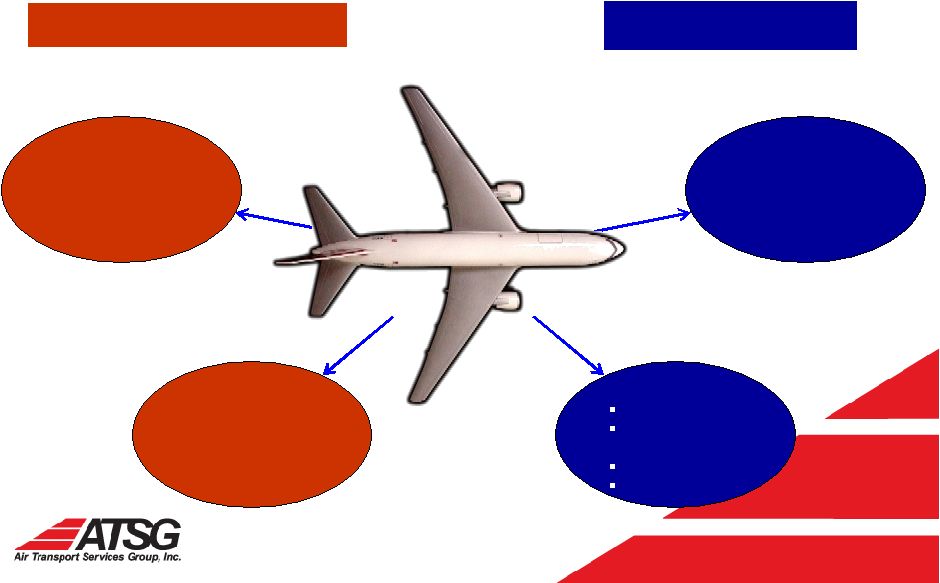 4
ATSG Business Model
Cargo Aircraft Dry or ACMI, with Complementary Services
ACMI:
ACMI:
Dedicated Aircraft,
Dedicated Aircraft,
Crew, Maintenance
Crew, Maintenance
& Insurance
& Insurance
(excludes fuel)
(excludes fuel)
Charter:
Charter:
Unscheduled & military
Unscheduled & military
Dry Lease Plus
Dry Lease Plus
Crew
Crew
Airframe, Engine
Airframe, Engine
Maintenance
Maintenance
Pilot Training
Pilot Training
Cert. Support
Cert. Support
Standard
Standard
Dry Lease
Dry Lease
Leased Externally
Leased to ATSG Airline |
 5
March 2010 DHL Agreements Transform ATSG
Growth with Secure Cash Flows, Minimal Risk
Thirteen seven-year 767F leases,
Aircraft operating agreement for five to ten years
Aircraft (A) Lease Terms
DHL
to
lease
thirteen
767Fs
from
CAM
under
7-year
terms;
DHL
responsible
for
airframe
and
engine maintenance costs
Airborne
Maintenance
and
Engineering
Services
(“AMES”)
will
provide
airframe
heavy
maintenance
DHL
provides
fuel
at
its
own
expense
Crew, Maintenance, Insurance (CMI) Agreement Terms
ABX
operates
13
aircraft
for
DHL
for
5
years,
with
2-year
extension
right
to
DHL,
2
nd
5
years
mutual
Defined-fee
scaled
for
the
number
of
aircraft;
logical
choice
to
support
domestic
network
expansion
ABX operates with monthly performance incentive bonuses
Subject
to
$70mm
amortizing
break-up
fee
if
DHL
prematurely
terminates
$26.35
million
balance
of
the
DHL
Note
(at
December
31,
2010)
amortizes
to
zero
over
the
CMI’s
term;
no
cash,
interest
fully
reimbursable |
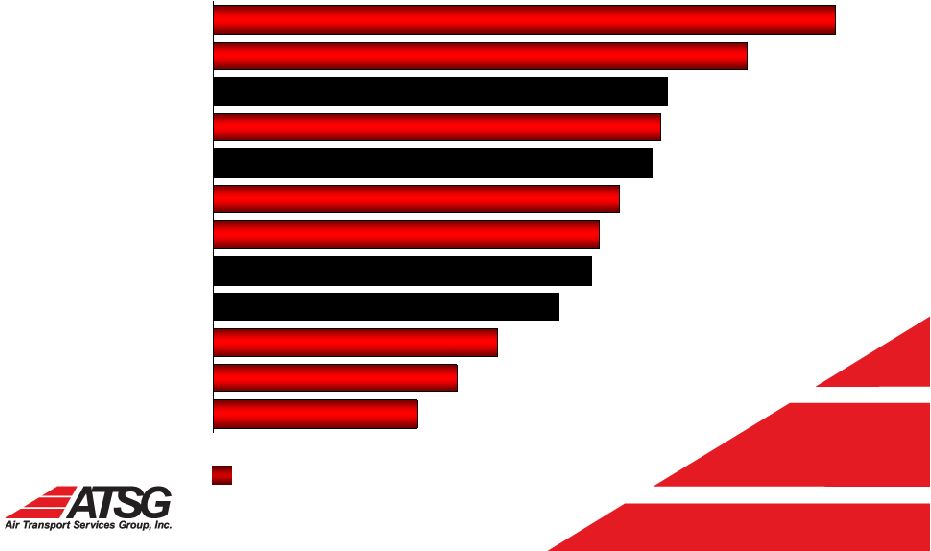 6
ATSG Global Opportunities
3.0%
3.6%
4.2%
5.1%
5.6%
5.7%
6.0%
6.5%
6.6%
6.7%
7.9%
9.2%
Intra North America
Intra Europe
Europe-N. America
Europe-Africa
Europe-Latin America
L. America-N. America
Europe-Middle East
S. Asia-Europe
Europe-Asia
Asia-N. America
Intra Asia
Intra China
ATSG target markets
Average Annual Demand Growth By Region, 2009-2029
Source: Boeing World Air Cargo Forecast, 2010-2011
|
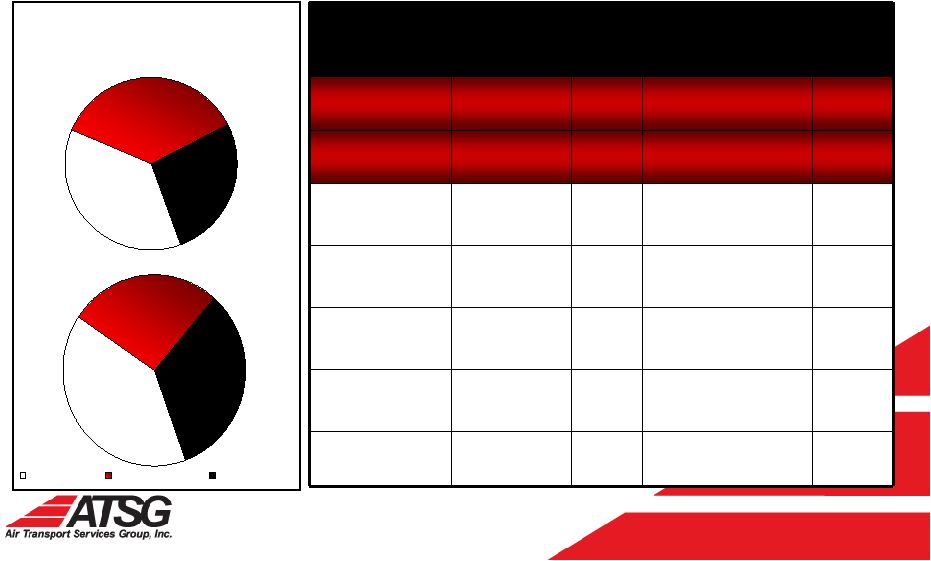 7
Global Freighter Fleets
Big Opportunity in Medium-Size Market
Aircraft
Fuel
(gallon/
block hr)*
Crew
Payload (lbs.)/
Capacity (cu. ft.)
Range
(NM)
767-
300SF
1,775
2
124,900 / 16,034
3,200
767-
200SF
1,380
2
100,000 / 11,138
2,800
A300-B4
1,900
3
99,200 / 11,445
1,680
A300-600F
1,850
2
104,900 / 14,654
2,650
A310-300F
1,390
2
88,420 / 10,922
3,360
DC-8 63
1,760
3
96,800 / 10,060
2,150
DC-8 73
1,600
3
111,800 / 10,060
2,470
Sources: Boeing, Airbus
Medium Freighter Comparisons
Standard body
Medium Widebody
Large Widebody
2009: 1,755 freighters
2029: 2967 freighters (est.)
650
475
630
800
980
1187
Medium Wide-bodies
Gaining Freighter Share |
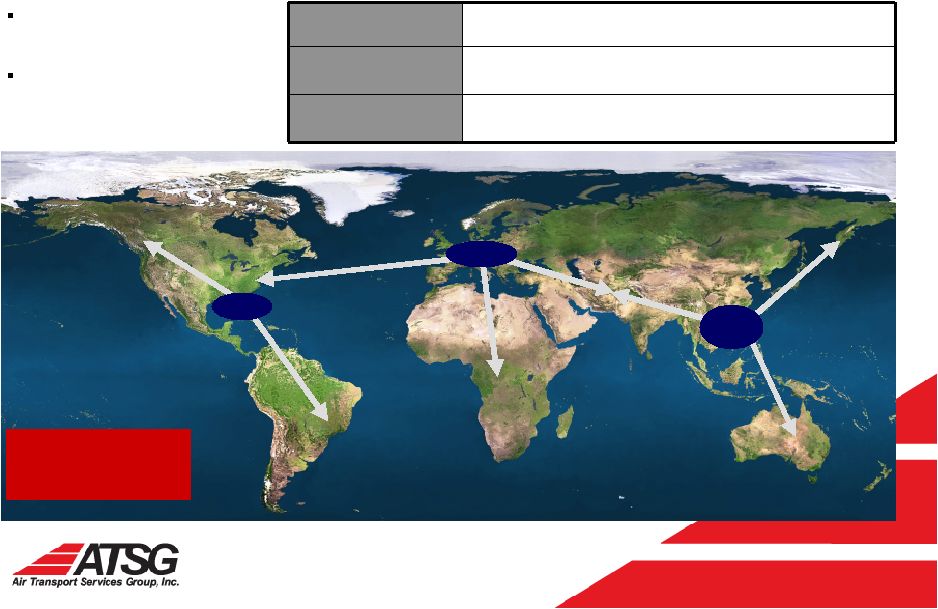 8
767s Serve Asia, Americas, Europe:
‘Spoke’
Routes from Global Airfreight Hubs
767-200ER,
767-300ER Ranges
w/ max. payload
Frankfurt
Miami
Hong
Kong
45-60 ton payload potential to
global “gateway”
cargo
airports, regional hub cities.
Pallet size, layout options
complement larger 747/ 777s.
Miami
767 reaches booming Brazil markets, perishable food and
floral markets in Colombia, Venezuela, Puerto Rico, etc.
Frankfurt
Range covers NE U.S., entire Middle East, Mumbai &
New Delhi, Lagos, Moscow, etc.
Hong Kong
Entire Asian continent from India to all of China and
Japan, plus Australia/New Zealand |
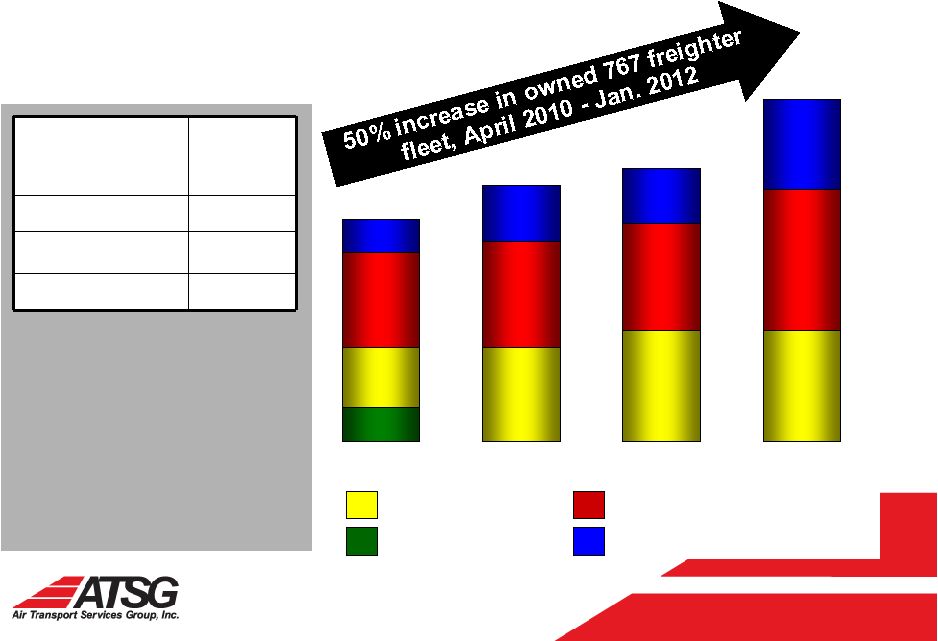 9
ATSG Investment Strategy:
Value-Creating Freighter Conversions
11-13
11-20*
April 2011
Jan. 2012
DHL-CAM Dry Leased
Other Customers-CAM Dry Leased
14
11
Jan. 2011
4
*
Includes conversion by 2012 of ten owned Boeing 767-200s,
three Boeing 767-300s. Excludes one 767-300 in ACMI
service under 45-mo. operating lease beginning Nov. 2010.
Deployment as leased vs. ACMI operated aircraft subject to
market conditions, customer preference.
7
11
April 2010
DHL-Interim Leased
ACMI Services-ACMI/Charter
13
13
4
5
6-8
6-15*
26
30*
32*
39*
Dry Lease Investment
Return Illustration*
(in millions)
(13)
767-Series
Freighters
Capex Required
$200 MM
Projected EBIT
$23.4 MM
Unlevered ROIC
11.7%
*
Margin from ACMI or other
complementary services would be
incremental. |
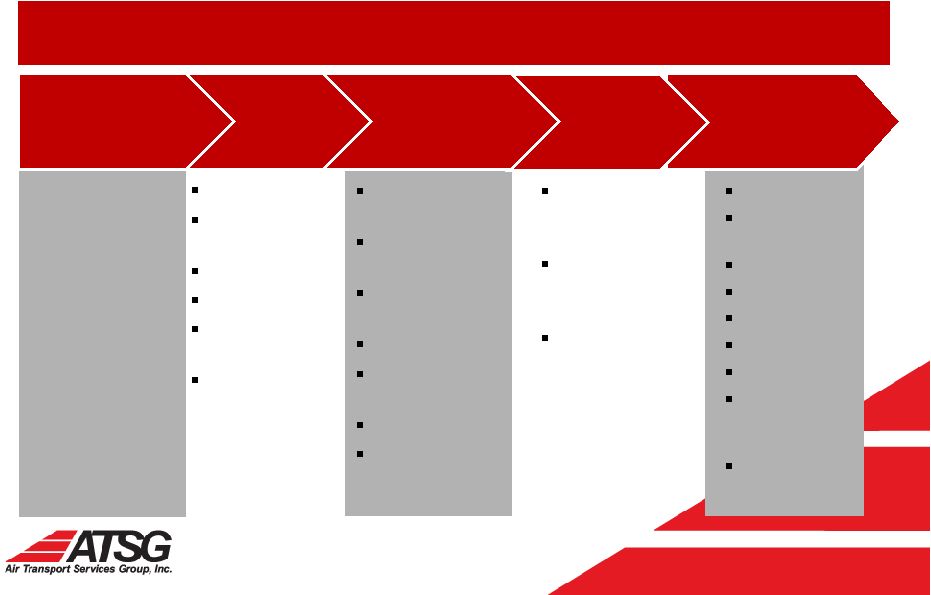
 10
Go-to-Market Strategy
Drive higher return on capital by optimally
positioning opportunities and bundling
additional services
Bundled marketing strategy led by neutral,
non-airline, lead sales organization
Develop packaged programs cross-selling
entities
Amerijet International program (ACMI
migration to CAM-leased 767s, with full
ATSG support) symbolizes this approach
Market Approach
Market Opportunities
Airline Operators
Key drivers
Replacement
Capacity growth
New markets
Non-Operators
Examples
Forwarders/Brokers
Integrators
Shippers |
 11
Flexible
Global
Solutions
Premier Source of Medium Freighter Solutions
•
767-200, -300
with GE CF6
engines
•
Low fuel burn
•
Low
maintenance
cost
•
Flexible
configuration
•
Power By Hour
engine services
The Global Leader of Medium Wide Body Operating and Leasing Solutions
Efficient Medium
Wide-Body
Aircraft
Dry leasing
ACMI/ wet
leasing
CMI
Combi
Full service
charter
Flight
operations
Heavy
maintenance
Line
maintenance
Maintenance
programs
Engineering
Technical
support
Manual services
Parts,
components
sales & service
Aircraft
conversion
services
Global
aircraft
deployment
Logistics
support
DHL
BAX
Schenker
TNT
JAL
UPS
Qantas
Amerijet
Air
Mobility
Command
CargoJet
Bundled
Maintenance
Solutions
Program
Management
Diverse,
Blue-Chip
Customer Base |
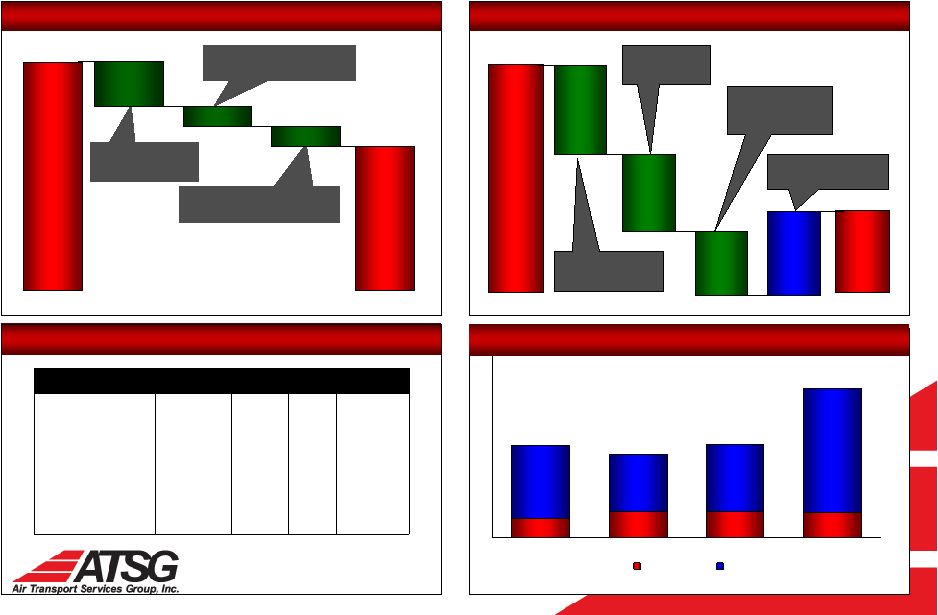
 12
Balance Sheet Improves as Earnings Grow
EBITDA* (from continuing operations)
Pre-tax Earnings (from continuing operations)
Net Debt*
Stockholders’
Equity
$531.5
$396.4
$294.2
$268.7
$200.0
$80.4
$246.0
$297.2
$155.8
$122.8
2008
2009
9Mo 2010
$30.8
$44.0
2009
2010
Year
Third Quarter
Year
Third Quarter
-$56.6
$45.4
$43.4
2008
2009
9 Mo 2010
$34.6**
$4.6
$16.7
2009
2010
12/31/07
12/31/08
12/31/09
9/30/10
12/31/07
12/31/08
12/31/09
9/30/10
$163.0**
No settlement or
severance from legacy
DHL agreements.
*
EBITDA is defined as income (loss) from operations plus net interest expense, provision for income
taxes, depreciation and amortization. Net Debt is defined as Long-Term Debt Obligations
plus Current Portion of Debt Obligations minus Cash and Cash Equivalents. EBITDA, and Net Debt are non-GAAP financial
measures and should not be considered alternatives to net income (loss) or any other performance
measure derived in accordance with GAAP. See non-GAAP Reconciliation
Tables. * * 2008 EBITDA and 2008 Pre-tax Earnings adjusted to exclude
impairment charges of $91.2 million. |
 13
Employer
Employer
contributions
contributions
DHL promissory
DHL promissory
note extinguishment
note extinguishment
De-levering Continues:
Cash Flow Available for Current Capex Commits
Transfer of aircraft
Transfer of aircraft
capital leases to DHL
capital leases to DHL
Principal
Principal
payments
payments
$313.1
$512.5
12/31/2008
9/30/2010
Total Debt Reduced 39%
Credit Facility Covenant Compliance
$98.3
$297.3
Actuarial costs
Actuarial costs
& adjustments
& adjustments
$119.6
$102.5
$102.4
Workforce
Workforce
contraction
contraction
& plan freeze
& plan freeze
$79.3
$ in millions
Gains on
Gains on
assets
assets
12/31/2008
9/30/2010
Post-Retirement Liabilities Reduced 64%
$ in millions
$31
$32
$30
$90
$70
$82
$22
Maintenance
Growth
2008
2009
2010
2011 est.
$170-200
$112
$101
$ in millions
* Requirements at year-end 2008 were 3.00 / 3.50 /
1.50 / 1.25
** Based upon twelve months trailing EBITDA
Capital Spending Trends
$104.2
$49.5
$45.7
Required*
2008
2009
3Q2010**
First Lien Debt /
EBITDA
< 2.75
2.58
2.17
1.83
Total Debt /
EBITDA
< 3.25
3.10
2.44
1.99
Fixed Charge
Coverage Ratio
> 1.50
2.55
1.99
2.17
Capital
Expenditures
> 1.05
1.58
1.65
1.20
$114
$140-
170*
* Actual 2011 growth capital spending will depend on the cost and timing to acquire
and convert additional aircraft, including Boeing 757 aircraft into
combi configuration. |
 14
New Business on Three Continents
•
On
November
1,
ABX
Air
began
operating
one
Boeing
767-200
freighter
for
Japan
Airlines
in
ACMI
service
in
Asia.
•
Also on November 1, ATI added one DC-8 freighter and CCIA added
one
727
freighter
to
BAX
Global’s
North
American
network.
•
Amerijet
exercised
the
first
of
three
options
for
a
767-200
freighter
for
a
seven-year
dry
lease,
to
be
delivered
in
the
first
quarter.
Amerijet
currently
leases
two
767-200
freighters
from
CAM.
•
On
November
7,
ABX
Air
began
transatlantic
ACMI
service
for
DHL
between
England
and
Cincinnati
via
a
767-300
freighter
that
ABX
Air
has
leased
from
a
third
party.
•
In
October,
DHL
selected
ABX
Air
to
operate
four
of
DHL’s
own
Boeing
767
freighters
in
its
U.S.
network,
under
terms
of
the
CMI
agreement.
The
four
are
in
addition
to
13
Boeing
767s
that
CAM
will
lease
and
ABX
Air
operates
in
the
U.S.
for
DHL. |
 15
ATSG Value Gaining Altitude
Limited
risk,
strong
cash
and
asset-value
returns
from
converted
767Fs
Expanding
767
freighter
fleet
will
yield
attractive,
annuity-like
cash
ROIs
via
long-term
leases
ACMI/CMI
flexibility
offers
options,
low-risk
transition
to
widebody
767s
from
older
narrow-bodies
767
platform
flexible
as
transcontinental
leader,
compatible
feeder
to
intercontinental
747s/777s
Significant
market-value
gains
on
P-2-F
aircraft
conversion
investments
Long-term
agreements
with
key
customers
Lease/CMI
approach
unlocks
value
of
aircraft
from
ACMI,
creates
more
options
for
customers
18
767s
&
757s
now
under
fixed
3-7
year
leases
or
operating
agreements
with
DHL,
CargoJet,
Amerijet,
etc.
5-year
CMI
with
DHL,
with
performance
factor
plus
$31m
amortized
note
forgiveness,
DPW
backing
Integrated, value-added services
Increase
return
on
invested
capital
Comprehensive
mix
allows
for
turnkey
customer
solutions
Competitive
terms
and
service
packages
for
third
party
maintenance
business
Attractive
balance
sheet
and
liquidity,
growth
capital
capacity
Low
debt-to-EBITDA
leverage;
limited
off-balance
sheet
obligations
2011
capital
requirements
can
be
financed
using
existing
cash
and
credit
resources
Secure
long-term
cash
flow
enhances
access
to
growth
capital
if
needed
Expanding opportunities around the globe
Expanding
presence
in
large,
fast-growing
air
cargo
regions:
Asia,
South
America,
Europe,
Middle
East/Africa
Sole
provider
of
combi
airlift
to
military
Uniquely
positioned
as
largest
independent
source
of
the
premier
medium
wide-body
freighter
–
the
Boeing
767 |
 16
*
*
*
*
*
Appendix |
 17
Balance Sheet Trend
September 30,
Dec. 31,
September 30,
Dec. 31
2010
2009
2009
2008
ASSETS
CURRENT ASSETS:
Cash and cash equivalents
44,465
$
83,229
89,699
$
116,114
Marketable securities - available-for-sale
-
-
-
26
Accounts receivable, net of allowances
37,331
87,708
95,071
87,857
Inventory
5,769
5,226
6,523
11,259
Prepaid supplies and other
10,480
7,093
8,900
11,151
Deferred income taxes
31,597
31,597
20,171
20,172
Aircraft and engines held for sale
-
30,634
32,521
2,353
TOTAL CURRENT ASSETS
129,642
245,487
252,885
248,932
Property and equipment, net
660,988
636,089
614,433
671,552
Other assets
28,463
21,307
22,225
25,281
Deferred income taxes
-
-
1,040
54,807
Intangibles
9,472
10,113
10,335
11,000
Goodwill
89,777
89,777
89,777
89,777
TOTAL ASSETS
918,342
$
$1,002,773
990,695
$
$1,101,349
LIABILITIES AND STOCKHOLDERS' EQUITY
CURRENT LIABILITIES:
Accounts payable
37,329
$
38,174
32,825
$
36,618
Accrued salaries, wages and benefits
23,651
44,077
37,605
63,500
Accrued severance and retention
1,039
18,959
13,718
67,846
Accrued expenses
15,367
16,429
20,628
13,772
Current portion of debt obligations
36,112
51,737
55,487
61,858
Unearned revenue
14,335
15,340
17,251
14,813
TOTAL CURRENT LIABILITIES
127,833
184,716
177,514
258,407
Long-term obligations
277,031
325,690
350,463
450,628
Post-retirement liabilities
97,292
152,297
239,292
294,881
Other liabilities
54,863
44,044
44,321
17,041
Deferred income taxes
64,172
50,044
-
-
STOCKHOLDERS' EQUITY:
Preferred stock, 20,000,000 shares authorized, including 75,000 Series
A Junior Participating Preferred Stock
-
-
-
-
Common stock, par value $0.01 per share;
638
634
635
632
Additional paid-in capital
513,898
502,822
495,551
460,155
Accumulated deficit
(183,090)
(211,085)
(222,593)
(245,534)
Accumulated other comprehensive loss
(34,295)
(46,389)
(94,488)
(134,861)
TOTAL STOCKHOLDERS' EQUITY
297,151
245,982
179,105
80,392
TOTAL LIABILITIES AND STOCKHOLDERS' EQUITY
918,342
$
1,002,773
$
990,695
$
1,101,349
$
|