Attached files
| file | filename |
|---|---|
| 8-K - 8-K - Aon plc | a11-5927_18k.htm |
Exhibit 99.1
|
|
Aon Corporation (NYSE: AON) February 2011 |
|
|
Greg Case Chief Executive Officer Christa Davies Chief Financial Officer Scott Malchow Vice President, Investor Relations |
|
|
Safe Harbor Statement This presentation contains certain statements related to future results, or states our intentions, beliefs and expectations or predictions for the future which are forward-looking statements as that term is defined in the Private Securities Litigation Reform Act of 1995. These forward-looking statements are subject to certain risks and uncertainties that could cause actual results to differ materially from either historical or anticipated results depending on a variety of factors. Potential factors that could impact results include: the possibility that the expected efficiencies and cost savings from the merger with Hewitt will not be realized, or will not be realized within the expected time period; the risk that the Aon and Hewitt businesses will not be integrated successfully; disruption from the merger with Hewitt making it more difficult to maintain business and operational relationships; general economic conditions in different countries in which Aon does business around the world; changes in global equity and fixed income markets that could affect the return on invested assets; fluctuations in exchange and interest rates that could influence revenue and expense; rating agency actions that could affect Aon's ability to borrow funds; funding of Aon's various pension plans; changes in the competitive environment; changes in commercial property and casualty markets and commercial premium rates that could impact revenues; the outcome of inquiries from regulators and investigations related to compliance with the U.S. Foreign Corrupt Practices Act and non-U.S. anti-corruption laws; the impact of investigations brought by U.S. state attorneys general, U.S. state insurance regulators, U.S. federal prosecutors, U.S. federal regulators, and regulatory authorities in the U.K. and other countries; the impact of class actions and individual lawsuits including client class actions, securities class actions, derivative actions and ERISA class actions; the cost of resolution of other contingent liabilities and loss contingencies, including potential liabilities arising from error and omissions claims against Aon; the extent to which Aon retains existing clients and attract new businesses; the extent to which Aon manages certain risks created in connection with the various services, including fiduciary and advisory services, among others, that Aon currently provides, or will provide in the future, to clients; the impact of, and potential challenges in complying with, legislation and regulation in the jurisdictions in which Aon operates, particularly given the global scope of Aon’s businesses and the possibility of conflicting regulatory requirements across jurisdictions in which Aon does business; and the ability to realize the anticipated benefits to Aon of the Benfield merger. Further information concerning Aon, Hewitt, and their business, including factors that potentially could materially affect Aon's financial results, is contained in Aon's and, historically, Hewitt's filings with the SEC. See Aon’s and Hewitt’s Annual Reports on Form 10-K and Annual Reports to Stockholders for the fiscal years ended December 31, 2009 and September 30, 2009, respectively, Quarterly Reports on Form 10-Q for the subsequent fiscal quarters, and other public filings with the SEC for a further discussion of these and other risks and uncertainties applicable to our businesses. Aon does not undertake, and expressly disclaims, any duty to update any forward-looking statement whether as a result of new information, future events or changes in their respective expectations, except as required by law. Additionally, at certain times the Company will use non-GAAP financial measures. Management believes that these measures are important to make meaningful period-to-period comparisons and that this supplemental information is helpful to investors. The required reconciliation of these measures to GAAP measures are included in the “Appendix” of this presentation. |
|
|
Agenda Section 1 Industry-Leading Franchise Focused on Risk and People #1 in Risk Solutions and #1 in HR Solutions Largest Globally Owned Network of Resources and Capabilities Operating in Markets Growing Long-Term in both Size and Complexity Section 2 What We Have Achieved Over the Last 5 Years Section 3 What We Will Do Over the Next 5 Years |
|
|
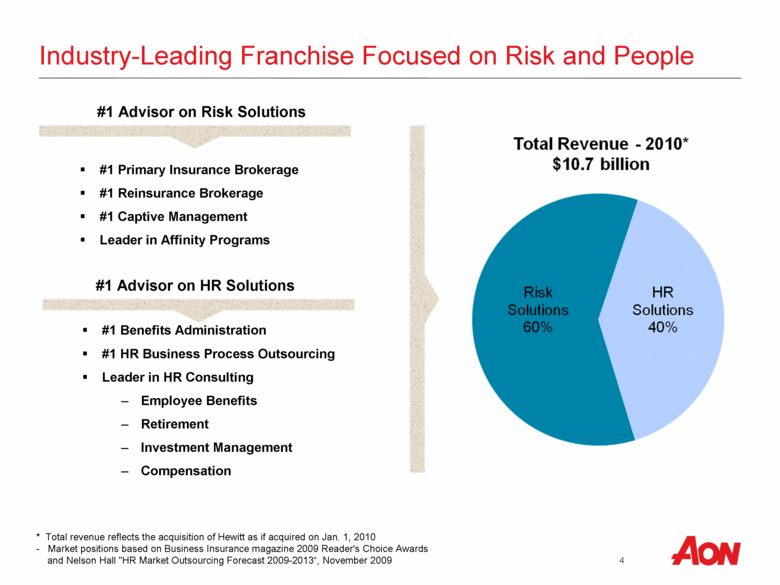
Industry-Leading Franchise Focused on Risk and People #1 Advisor on Risk Solutions #1 Primary Insurance Brokerage #1 Reinsurance Brokerage #1 Captive Management Leader in Affinity Programs #1 Advisor on HR Solutions * Total revenue reflects the acquisition of Hewitt as if acquired on Jan. 1, 2010 Market positions based on Business Insurance magazine 2009 Reader's Choice Awards and Nelson Hall "HR Market Outsourcing Forecast 2009-2013”, November 2009 #1 Benefits Administration #1 HR Business Process Outsourcing Leader in HR Consulting Employee Benefits Retirement Investment Management Compensation |
|
|
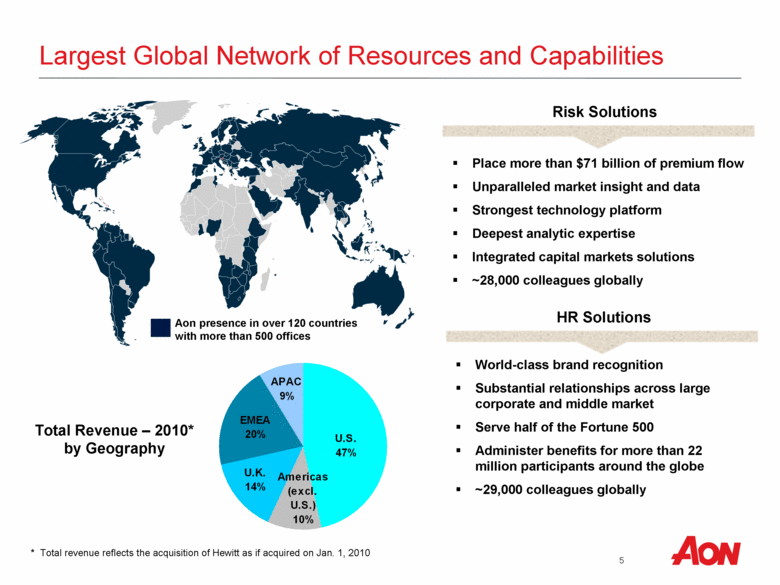
Largest Global Network of Resources and Capabilities Aon presence in over 120 countries with more than 500 offices Risk Solutions Place more than $71 billion of premium flow Unparalleled market insight and data Strongest technology platform Deepest analytic expertise Integrated capital markets solutions ~28,000 colleagues globally HR Solutions World-class brand recognition Substantial relationships across large corporate and middle market Serve half of the Fortune 500 Administer benefits for more than 22 million participants around the globe ~29,000 colleagues globally Total Revenue – 2010* by Geography * Total revenue reflects the acquisition of Hewitt as if acquired on Jan. 1, 2010 Americas (excl. U.S.) 10% U.K. 14% EMEA 20% APAC 9% U.S. 47% |
|
|
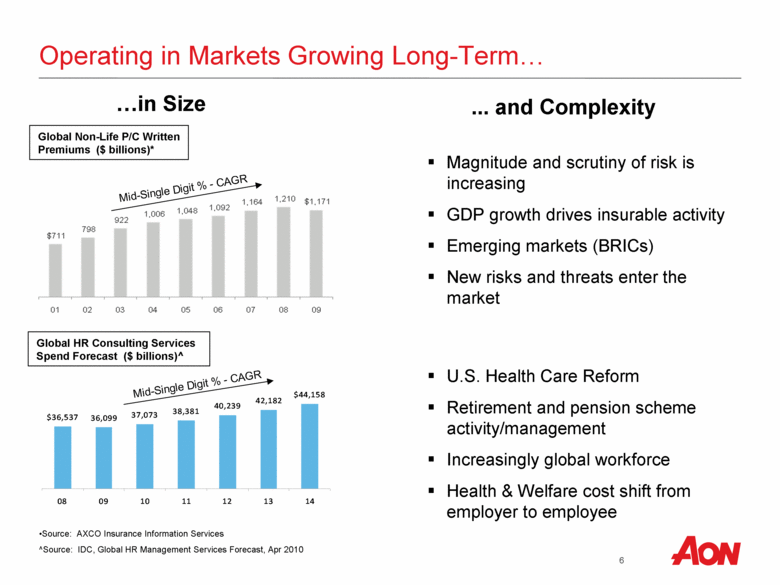
Operating in Markets Growing Long-Term Source: AXCO Insurance Information Services ^Source: IDC, Global HR Management Services Forecast, Apr 2010 Global Non-Life P/C Written Premiums ($ billions)* and Complexity in Size Magnitude and scrutiny of risk is increasing GDP growth drives insurable activity Emerging markets (BRICs) New risks and threats enter the market Global HR Consulting Services Spend Forecast ($ billions)^ U.S. Health Care Reform Retirement and pension scheme activity/management Increasingly global workforce Health & Welfare cost shift from employer to employee Mid-Single Digit % - CAGR Mid-Single Digit % - CAGR $36,537 36,099 37,073 38,381 40,239 42,182 $44,158 08 09 10 11 12 13 14 $711 798 922 1,006 1,040 1,092 1,164 1,210 $1,171 01 02 03 04 05 06 07 08 09 |
|
|
Agenda Section 1 Industry-Leading Franchise Focused on Risk and People Section 2 What We Have Achieved Over the Last 5 Years Focused the Portfolio Significantly Invested in Global Capabilities Delivered on Key Financial Metrics Section 3 What We Will Do Over the Next 5 Years |
|
|
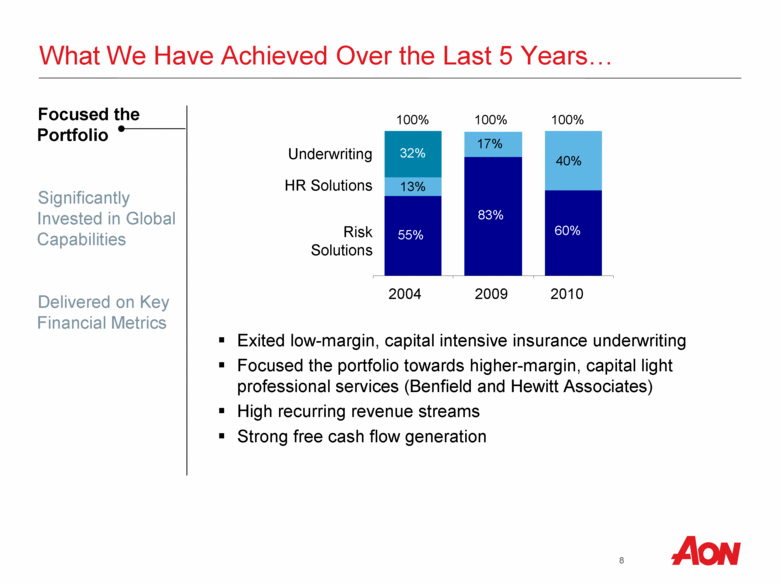
Focused the Portfolio Significantly Invested in Global Capabilities Delivered on Key Financial Metrics 100% 100% Underwriting HR Solutions Risk Solutions 32% 13% 55% 17% 83% Exited low-margin, capital intensive insurance underwriting Focused the portfolio towards higher-margin, capital light professional services (Benfield and Hewitt Associates) High recurring revenue streams Strong free cash flow generation 2004 2009 40% 60% 100% 2010 What We Have Achieved Over the Last 5 Years |
|
|
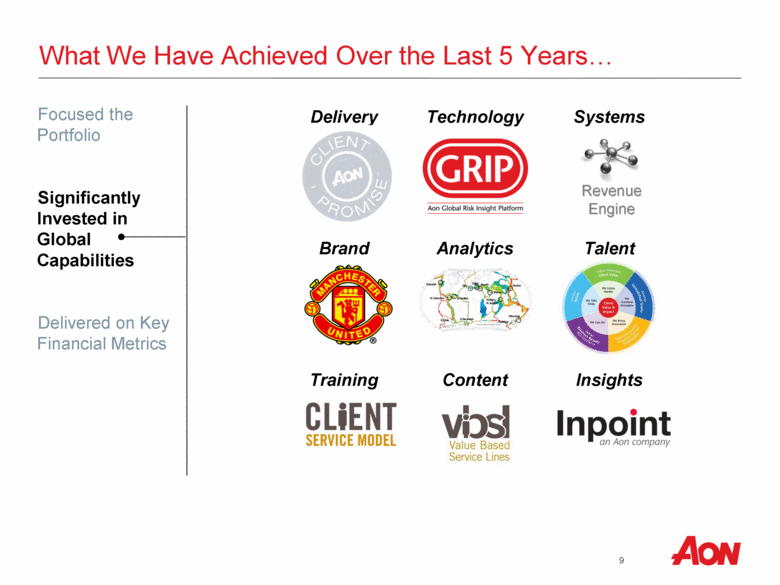
Focused the Portfolio Significantly Invested in Global Capabilities Delivered on Key Financial Metrics What We Have Achieved Over the Last 5 Years Delivery Technology Systems Brand Analytics Talent Training Content Insights Revenue Engine |
|
|
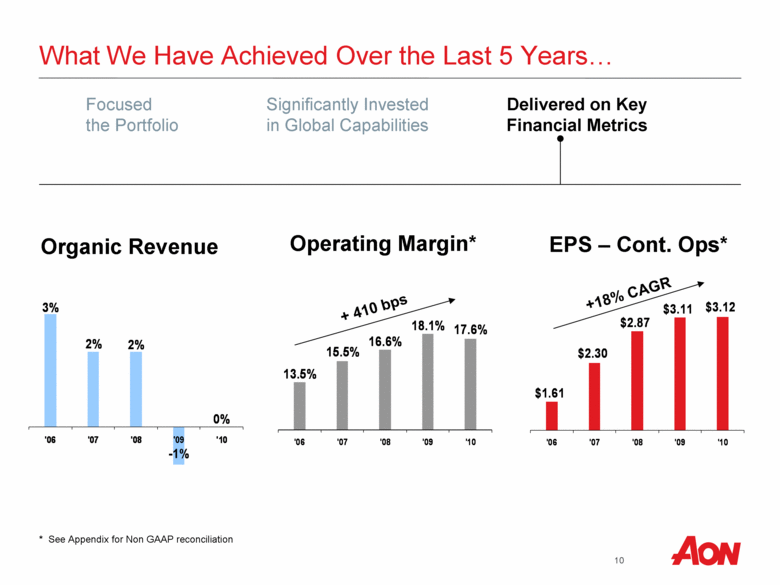
Focused Significantly Invested Delivered on Key the Portfolio in Global Capabilities Financial Metrics What We Have Achieved Over the Last 5 Years Organic Revenue Operating Margin* EPS – Cont. Ops* +18% CAGR + 410 bps * See Appendix for Non GAAP reconciliation 17.6% 18.1% 16.6% 15.5% 13.5% '06 '07 '08 '09 '10 $3.12 $3.11 $2.87 $2.30 $1.61 '06 '07 '08 '09 '10 0% -1% 2% 2% 3% '06 '07 '08 '09 '10 |
|
|
Agenda Section 1 Industry-Leading Franchise Focused on Risk and People Section 2 What We Have Achieved Over the Last 5 Years Section 3 What We Will Do Over the Next 5 Years United Aon to Drive Sustainable Long-Term Growth Fully Integrate Hewitt and Deliver Operational Excellence Continue to Deliver on Long-Term Operating Margin Targets Effectively Allocate Capital through Strong Free Cash Flow Generation |
|
|
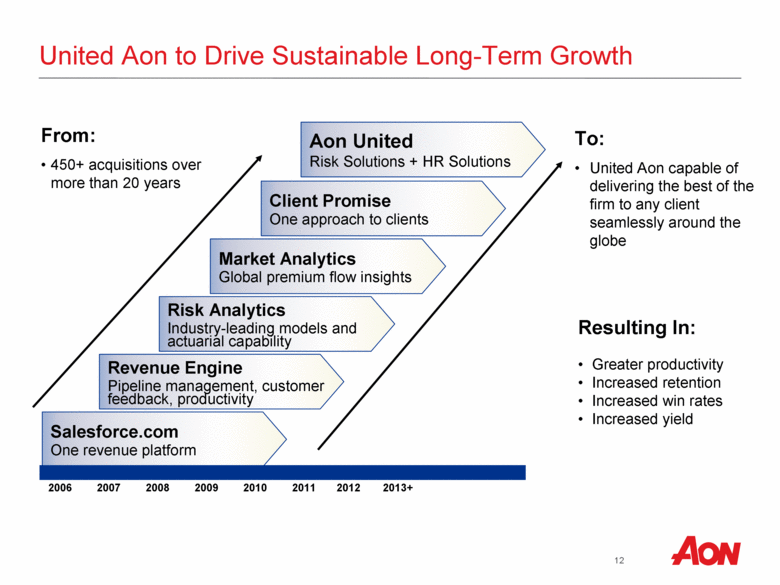
United Aon to Drive Sustainable Long-Term Growth 2006 Salesforce.com One revenue platform Revenue Engine Pipeline management, customer feedback, productivity Market Analytics Global premium flow insights Client Promise One approach to clients 2008 2009 2010 2007 2011 Risk Analytics Industry-leading models and actuarial capability 2012 2013+ Aon United Risk Solutions + HR Solutions From: 450+ acquisitions over more than 20 years To: United Aon capable of delivering the best of the firm to any client seamlessly around the globe Resulting In: Greater productivity Increased retention Increased win rates Increased yield |
|
|
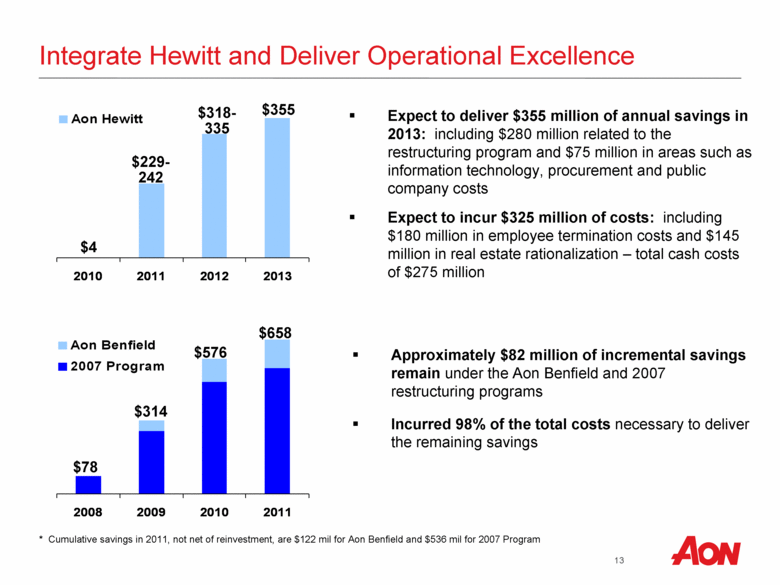
Integrate Hewitt and Deliver Operational Excellence $78 $314 $576 $658 * Cumulative savings in 2011, not net of reinvestment, are $122 mil for Aon Benfield and $536 mil for 2007 Program $4 $229- 242 $318- 335 $355 Expect to deliver $355 million of annual savings in 2013: including $280 million related to the restructuring program and $75 million in areas such as information technology, procurement and public company costs Expect to incur $325 million of costs: including $180 million in employee termination costs and $145 million in real estate rationalization – total cash costs of $275 million Approximately $82 million of incremental savings remain under the Aon Benfield and 2007 restructuring programs Incurred 98% of the total costs necessary to deliver the remaining savings 2008 2009 2010 2011 Aon Benfield 2007 Program 2010 2011 2012 2013 Aon Hewitt |
|
|
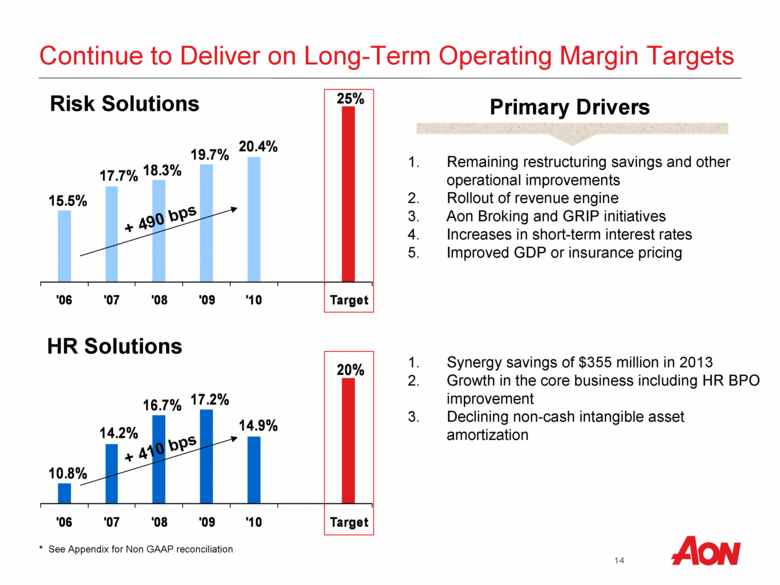
Continue to Deliver on Long-Term Operating Margin Targets Risk Solutions HR Solutions Remaining restructuring savings and other operational improvements Rollout of revenue engine Aon Broking and GRIP initiatives Increases in short-term interest rates Improved GDP or insurance pricing Primary Drivers Synergy savings of $355 million in 2013 Growth in the core business including HR BPO improvement Declining non-cash intangible asset amortization + 490 bps + 410 bps * See Appendix for Non GAAP reconciliation 25% 20.4% 19.7% 18.3% 17.7% 15.5% '06 '07 '08 '09 '10 Target 20% 14.9% 17.2% 16.7% 14.2% 10.8% '06 '07 '08 '09 '10 Target 1. 2. 3. 4. 5. 1. 2. 3. |
|
|
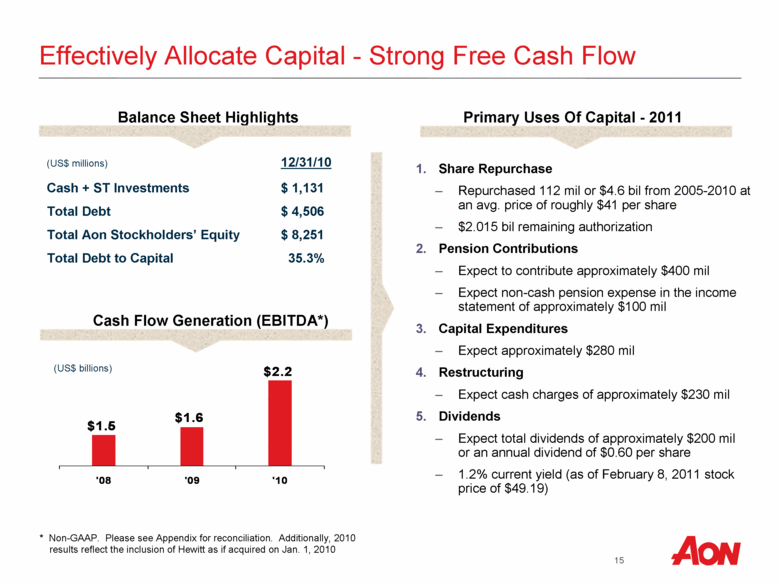
Effectively Allocate Capital - Strong Free Cash Flow Share Repurchase Repurchased 112 mil or $4.6 bil from 2005-2010 at an avg. price of roughly $41 per share $2.015 bil remaining authorization Pension Contributions Expect to contribute approximately $400 mil Expect non-cash pension expense in the income statement of approximately $100 mil Capital Expenditures Expect approximately $280 mil Restructuring Expect cash charges of approximately $230 mil Dividends Expect total dividends of approximately $200 mil or an annual dividend of $0.60 per share 1.2% current yield (as of February 8, 2011 stock price of $49.19) Primary Uses Of Capital - 2011 Balance Sheet Highlights (US$ millions) 12/31/10 Cash + ST Investments $ 1,131 Total Debt $ 4,506 Total Aon Stockholders’ Equity $ 8,251 Total Debt to Capital 35.3% Cash Flow Generation (EBITDA*) (US$ billions) * Non-GAAP. Please see Appendix for reconciliation. Additionally, 2010 results reflect the inclusion of Hewitt as if acquired on Jan. 1, 2010 $2.2 $1.6 $1.5 '08 '09 '10 1. 2. 3. 4. 5. |
|
|
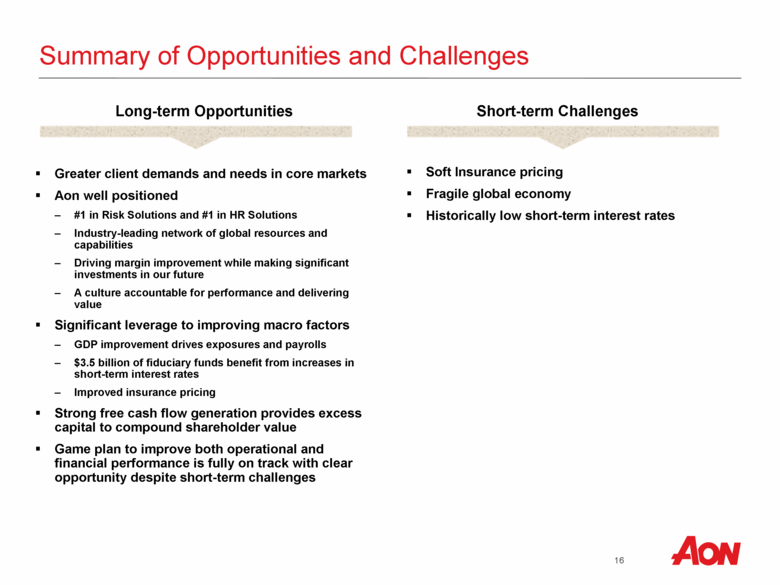
Summary of Opportunities and Challenges Greater client demands and needs in core markets Aon well positioned #1 in Risk Solutions and #1 in HR Solutions Industry-leading network of global resources and capabilities Driving margin improvement while making significant investments in our future A culture accountable for performance and delivering value Significant leverage to improving macro factors GDP improvement drives exposures and payrolls $3.5 billion of fiduciary funds benefit from increases in short-term interest rates Improved insurance pricing Strong free cash flow generation provides excess capital to compound shareholder value Game plan to improve both operational and financial performance is fully on track with clear opportunity despite short-term challenges Short-term Challenges Long-term Opportunities Soft Insurance pricing Fragile global economy Historically low short-term interest rates |
|
|
Appendix |
|
|
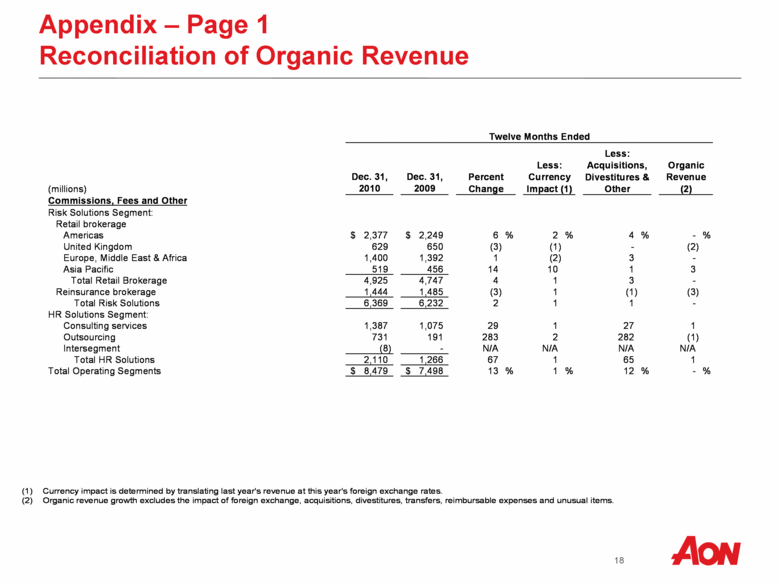
Appendix – Page 1 Reconciliation of Organic Revenue (millions) Dec. 31, 2010 Dec. 31, 2009 Commissions, Fees and Other Risk Solutions Segment: Retail brokerage Americas 2,377 $ 2,249 $ 6 % 2 % 4 % - % United Kingdom 629 650 (3) (1) - (2) Europe, Middle East & Africa 1,400 1,392 1 (2) 3 - Asia Pacific 519 456 14 10 1 3 Total Retail Brokerage 4,925 4,747 4 1 3 - Reinsurance brokerage 1,444 1,485 (3) 1 (1) (3) Total Risk Solutions 6,369 6,232 2 1 1 - HR Solutions Segment: 1,387 1,075 29 1 27 1 Outsourcing 731 191 283 2 282 (1) Intersegment (8) - N/A N/A N/A N/A Total HR Solutions 2,110 1,266 67 1 65 1 Total Operating Segments $8,479 $ 7,498 $ 13 % 1 % 12 % - % Less: Acquisitions, Divestitures & Other Percent Change Consulting services Organic Revenue (2) Twelve Months Ended Less: Currency Impact (1) Curency impact is determined by translating last year’s revenue at this year’s foreign exchange rates.(2) Organic revenue growth excludes the impact of foreign exchange, acquisitions, divestitures, transfers, reimbursable expenses and unusual items. Twelve Months Ended |
|
|
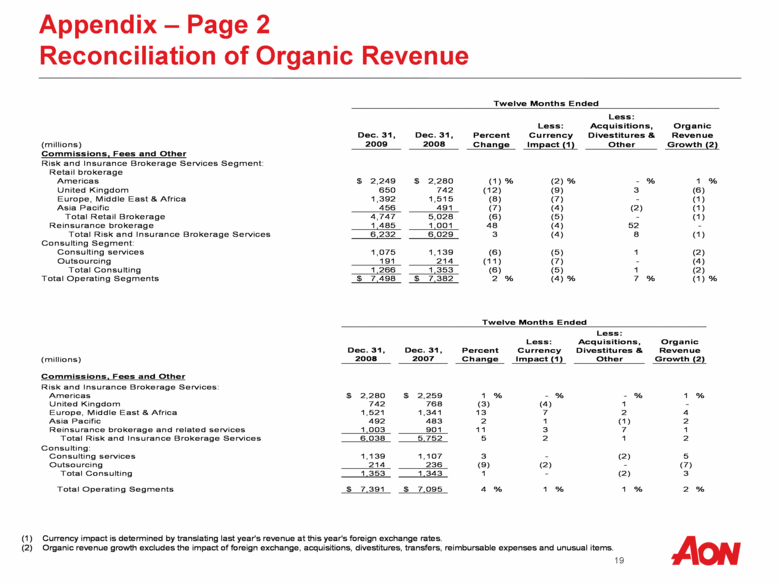
Appendix – Page 2 Reconciliation of Organic Revenue (millions) Dec. 31, 2008 Dec. 31, 2007 Commissions, Fees and Other Risk and Insurance Brokerage Services: Americas 2,280 $ 2,259 $ 1 % - % - % 1 % United Kingdom 742 768 (3) (4) 1 - Europe, Middle East & Africa 1,521 1,341 13 7 2 4 Asia Pacific 492 483 2 1 (1) 2 Reinsurance brokerage and related services 1,003 901 11 3 7 1 Total Risk and Insurance Brokerage Services 6,038 5,752 5 2 1 2 Consulting: 1,139 1,107 3 - (2) 5 Outsourcing 214 236 (9) (2) - (7) Total Consulting 1,353 1,343 1 - (2) 3 Total Operating Segments 7,391 $ 7,095 $ 4 % 1 % 1 % 2 % Percent Change Consulting services Less: Currency Impact (1) Less: Acquisitions, Divestitures & Other Organic Revenue Growth (2) Twelve Months Ended (1) Currency impact is determined by translating last year's revenue at this year's foreign exchange rates. (2) Organic revenue growth excludes the impact of foreign exchange, acquisitions, divestitures, transfers, reimbursable expenses and unusual items. Twelve Months Ended Less: (millions) Commissions, Fees and Other Dec. 31, 2009 Dec. 31, 2008 Less: Currency Impact (1) Acquisitions, Divestitures & Other Percent Change Organic Revenue Growth (2) Risk and Insurance Brokerage Services Segment: Retail brokerage Americas 2,249 $ 2,280 $ (1) % (2) % - % 1 % United Kingdom 650 742 (12) (9) 3 (6) Europe, Middle East & Africa 1,392 1,515 (8) (7) - (1) Asia Pacific 456 491 (7) (4) (2) (1) Total Retail Brokerage 4,747 5,028 (6) (5) - (1) Reinsurance brokerage 1,485 1,001 48 (4) 52 - Total Risk and Insurance Brokerage Services 6,232 6,029 3 (4) 8 (1) Consulting Segment: Consulting services 1,075 1,139 (6) (5) 1 (2) Outsourcing 191 214 (11) (7) - (4) Total Consulting 1,266 1,353 (6) (5) 1 (2) Total Operating Segments 7,498 $ 7,382 $ 2 % (4) % 7 % (1) % |
|
|
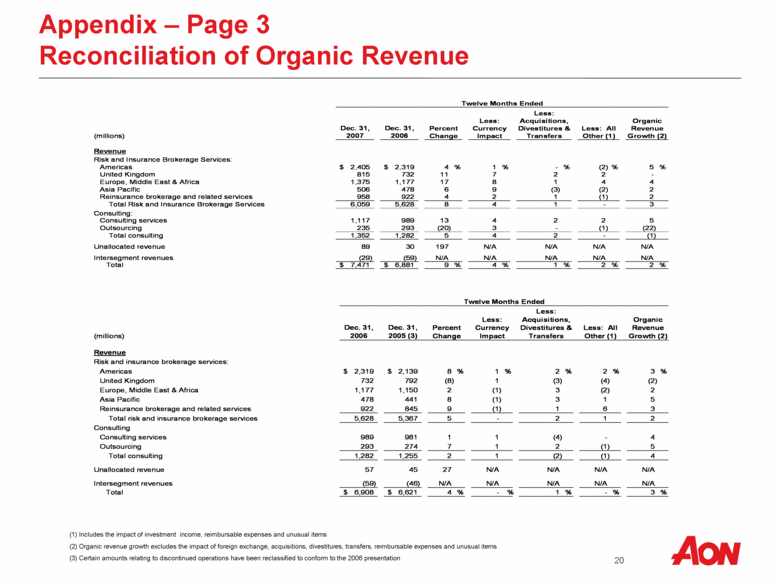
Appendix – Page 3 Reconciliation of Organic Revenue (1) Includes the impact of investment income, reimbursable expenses and unusual items (2) Organic revenue growth excludes the impact of foreign exchange, acquisitions, divestitures, transfers, reimbursable expenses and unusual items (3) Certain amounts relating to discontinued operations have been reclassified to conform to the 2006 presentation (millions) Dec. 31, 2007 Dec. 31, 2006 Revenue Risk and Insurance Brokerage Services: Americas 2,405 $ 2,319 $ 4 % 1 % - % (2) % 5 % United Kingdom 815 732 11 7 2 2 - Europe, Middle East & Africa 1,375 1,177 17 8 1 4 4 Asia Pacific 506 478 6 9 (3) (2) 2 Reinsurance brokerage and related services 958 922 4 2 1 (1) 2 Total Risk and Insurance Brokerage Services 6,059 5,628 8 4 1 - 3 Consulting: 1,117 989 13 4 2 2 5 Outsourcing 235 293 (20) 3 - (1) (22) Total consulting 1,352 1,282 5 4 2 - (1) Unallocated revenue 89 30 197 N/A N/A N/A N/A Intersegment revenues (29) (59) N/A N/A N/A N/A N/A Total 7,471 $ 6,881 $ 9 % 4 % 1 % 2 % 2 % Twelve Months Ended Less: All Other (1) Organic Revenue Growth (2) Less: Currency Impact Less: Acquisitions, Divestitures & Transfers Percent Change Consulting services (millions) Dec. 31, 2006 Dec. 31, 2005 (3) Revenue Risk and insurance brokerage services: Americas 2,319 $ 2,139 $ 8 % 1 % 2 % 2 % 3 % United Kingdom 732 792 (8) 1 (3) (4) (2) Europe, Middle East & Africa 1,177 1,150 2 (1) 3 (2) 2 Asia Pacific 478 441 8 (1) 3 1 5 Reinsurance brokerage and related services 922 845 9 (1) 1 6 3 Total risk and insurance brokerage services 5,628 5,367 5 - 2 1 2 Consulting 989 981 1 1 (4) - 4 Outsourcing 293 274 7 1 2 (1) 5 Total consulting 1,282 1,255 2 1 (2) (1) 4 Unallocated revenue 57 45 27 N/A N/A N/A N/A Intersegment revenues (59) (46) N/A N/A N/A N/A N/A Total 6,908 $ 6,621 $ 4 % - % 1 % - % 3 % Less: Acquisitions, Divestitures & Transfers Less: All Other (1) Organic Revenue Growth (2) Twelve Months Ended Percent Change Less: Currency Impact Consulting services |
|
|
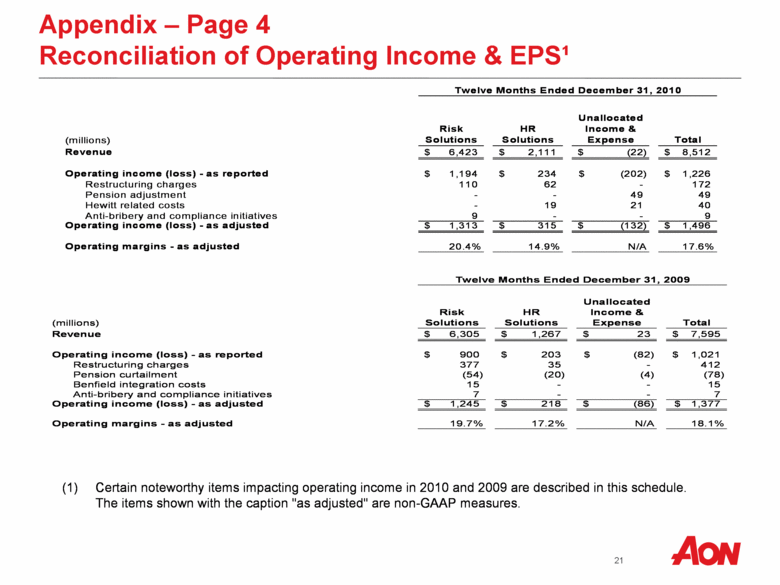
Appendix – Page 4 Reconciliation of Operating Income & EPS¹ (millions) Risk Solutions HR Solutions Unallocated Income & Expense Total Revenue 6,305 $ 1,267 $ 23 $ 7,595 $ Operating income (loss) - as reported 900 $ 203 $ (82) $ 1,021 $ Restructuring charges 377 35 - 412 Pension curtailment (54) (20) (4) (78) Benfield integration costs 15 - - 15 Anti-bribery and compliance initiatives 7 - - 7 Operating income (loss) - as adjusted 1,245 $ 218 $ (86) $ 1,377 $ Operating margins - as adjusted 19.7% 17.2% N/A 18.1% Twelve Months Ended December 31, 2009 (millions) Risk Solutions HR Solutions Unallocated Income & Expense Total Revenue 6,423 $ 2,111 $ (22) $ 8,512 $ Operating income (loss) - as reported 1,194 $ 234 $ (202) $ 1,226 $ Restructuring charges 110 62 - 172 Pension adjustment - - 49 49 Hewitt related costs - 19 21 40 Anti-bribery and compliance initiatives 9 - - 9 Operating income (loss) - as adjusted 1,313 $ 315 $ (132) $ 1,496 $ Operating margins - as adjusted 20.4% 14.9% N/A 17.6% Twelve Months Ended December 31, 2010 (1) Certain noteworthy items impacting operating income in 2010 and 2009 are described in this schedule. The items shown with the caption "as adjusted" are non-GAAP measures. |
|
|
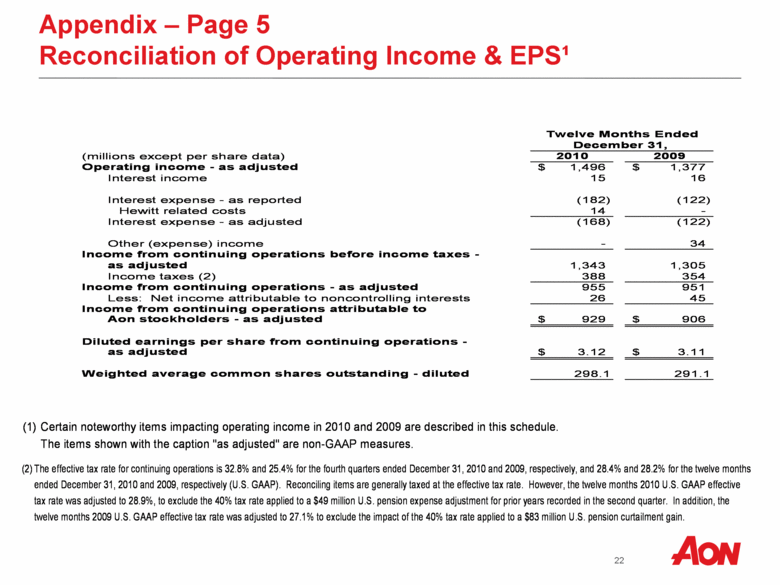
Appendix – Page 5 Reconciliation of Operating Income & EPS¹ (1) Certain noteworthy items impacting operating income in 2010 and 2009 are described in this schedule. The items shown with the caption "as adjusted" are non-GAAP measures. (2) The effective tax rate for continuing operations is 32.8% and 25.4% for the fourth quarters ended December 31, 2010 and 2009, respectively, and 28.4% and 28.2% for the twelve months ended December 31, 2010 and 2009, respectively (U.S. GAAP). Reconciling items are generally taxed at the effective tax rate. However, the twelve months 2010 U.S. GAAP effective tax rate was adjusted to 28.9%, to exclude the 40% tax rate applied to a $49 million U.S. pension expense adjustment for prior years recorded in the second quarter. In addition, the twelve months 2009 U.S. GAAP effective tax rate was adjusted to 27.1% to exclude the impact of the 40% tax rate applied to a $83 million U.S. pension curtailment gain. (millions except per share data) 2010 2009 Operating income - as adjusted 1,496 $ 1,377 $ Interest income 15 16 Interest expense - as reported (182) (122) Hewitt related costs 14 - Interest expense - as adjusted (168) (122) Other (expense) income - 34 Income from continuing operations before income taxes - as adjusted 1,343 1,305 Income taxes (2) 388 354 Income from continuing operations - as adjusted 955 951 Less: Net income attributable to noncontrolling interests 26 45 Income from continuing operations attributable to Aon stockholders - as adjusted 929 $ 906 $ Diluted earnings per share from continuing operations - as adjusted 3.12 $ 3.11 $ Weighted average common shares outstanding - diluted 298.1 291.1 Twelve Months Ended December 31, |
|
|
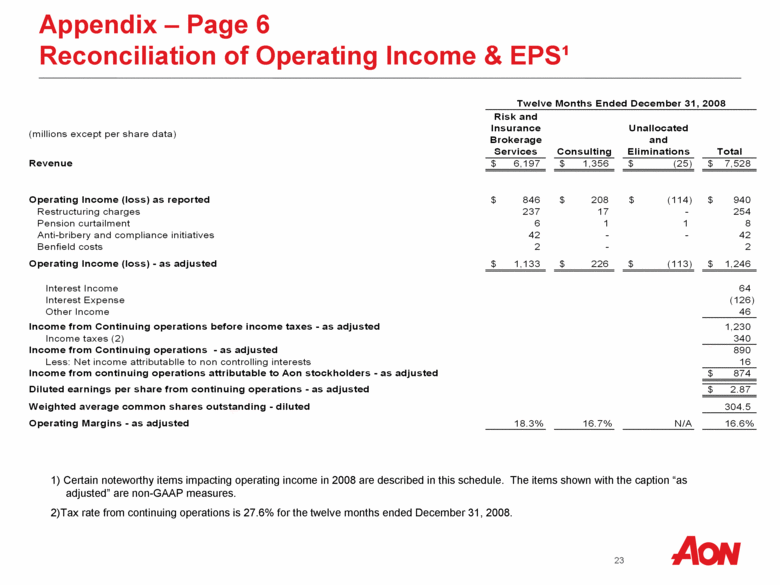
Appendix – Page 6 Reconciliation of Operating Income & EPS¹ 1) Certain noteworthy items impacting operating income in 2008 are described in this schedule. The items shown with the caption “as adjusted” are non-GAAP measures. 2)Tax rate from continuing operations is 27.6% for the twelve months ended December 31, 2008. (millions except per share data) Risk and Insurance Brokerage Services Consulting Unallocated and Eliminations Total Revenue 6,197 $ 1,356 $ (25) $ 7,528 $ Operating Income (loss) as reported 846 $ 208 $ (114) $ 940 $ Restructuring charges 237 17 - 254 Pension curtailment 6 1 1 8 Anti-bribery and compliance initiatives 42 - - 42 Benfield costs 2 - 2 Operating Income (loss) - as adjusted 1,133 $ 226 $ (113) $ 1,246 $ Interest Income 64 Interest Expense (126) Other Income 46 Income from Continuing operations before income taxes - as adjusted 1,230 Income taxes (2) 340 Income from Continuing operations - as adjusted 890 Less: Net income attributablle to non controlling interests 16 Income from continuing operations attributable to Aon stockholders - as adjusted 874 $ Diluted earnings per share from continuing operations - as adjusted 2.87 $ Weighted average common shares outstanding - diluted 304.5 Operating Margins - as adjusted 18.3% 16.7% N/A 16.6% Twelve Months Ended December 31, 2008 |
|
|
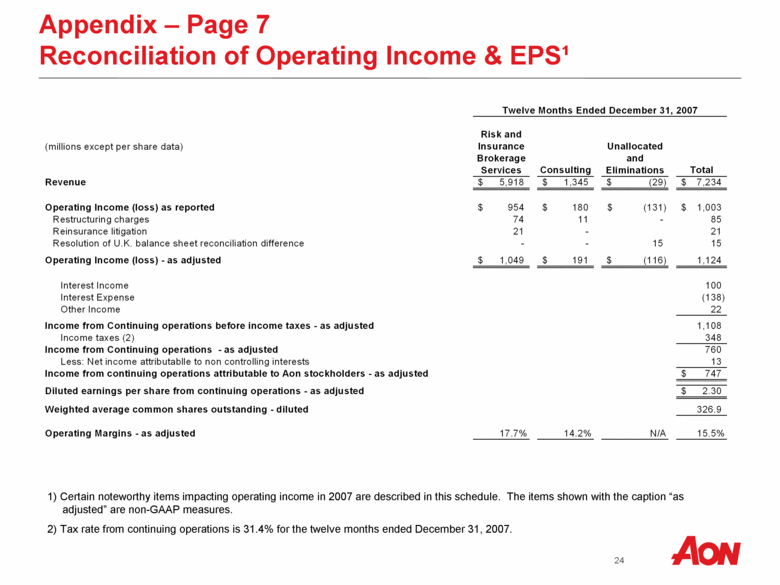
Appendix – Page 7 Reconciliation of Operating Income & EPS¹ 1) Certain noteworthy items impacting operating income in 2007 are described in this schedule. The items shown with the caption “as adjusted” are non-GAAP measures. 2) Tax rate from continuing operations is 31.4% for the twelve months ended December 31, 2007. (millions except per share data) Risk and Insurance Brokerage Services Consulting Unallocated and Eliminations Total Revenue 5,918 $ 1,345 $ (29) $ 7,234 $ Operating Income (loss) as reported 954 $ 180 $ (131) $ 1,003 $ Restructuring charges 74 11 - 85 Reinsurance litigation 21 - 21 Resolution of U.K. balance sheet reconciliation difference - - 15 15 Operating Income (loss) - as adjusted 1,049 $ 191 $ (116) $ 1,124 Interest Income 100 Interest Expense (138) Other Income 22 Income from Continuing operations before income taxes - as adjusted 1,108 Income taxes (2) 348 Income from Continuing operations - as adjusted 760 Less: Net income attributablle to non controlling interests 13 Income from continuing operations attributable to Aon stockholders - as adjusted 747 $ Diluted earnings per share from continuing operations - as adjusted 2.30 $ Weighted average common shares outstanding - diluted 326.9 Operating Margins - as adjusted 17.7% 14.2% N/A 15.5% Twelve Months Ended December 31, 2007 |
|
|
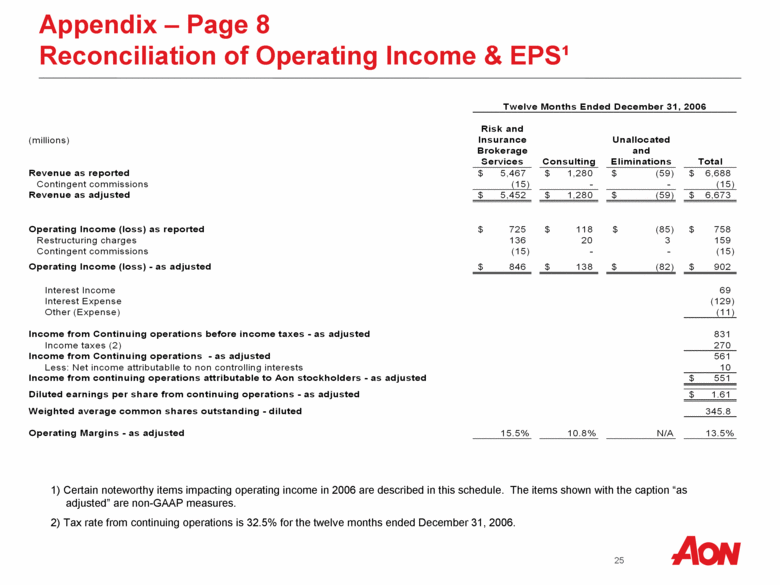
Appendix – Page 8 Reconciliation of Operating Income & EPS¹ 1) Certain noteworthy items impacting operating income in 2006 are described in this schedule. The items shown with the caption “as adjusted” are non-GAAP measures. 2) Tax rate from continuing operations is 32.5% for the twelve months ended December 31, 2006. (millions) Risk and Insurance Brokerage Services Consulting Unallocated and Eliminations Total Revenue as reported 5,467 $ 1,280 $ (59) $ 6,688 $ Contingent commissions (15) - - (15) Revenue as adjusted 5,452 $ 1,280 $ (59) $ 6,673 $ Operating Income (loss) as reported 725 $ 118 $ (85) $ 758 $ Restructuring charges 136 20 3 159 Contingent commissions (15) - - (15) Operating Income (loss) - as adjusted 846 $ 138 $ (82) $ 902 $ Interest Income 69 Interest Expense (129) Other (Expense) (11) Income from Continuing operations before income taxes - as adjusted 831 Income taxes (2) 270 Income from Continuing operations - as adjusted 561 Less: Net income attributablle to non controlling interests 10 Income from continuing operations attributable to Aon stockholders - as adjusted 551 $ Diluted earnings per share from continuing operations - as adjusted 1.61 $ Weighted average common shares outstanding - diluted 345.8 Operating Margins - as adjusted 15.5% 10.8% N/A 13.5% Twelve Months Ended December 31, 2006 |
|
|
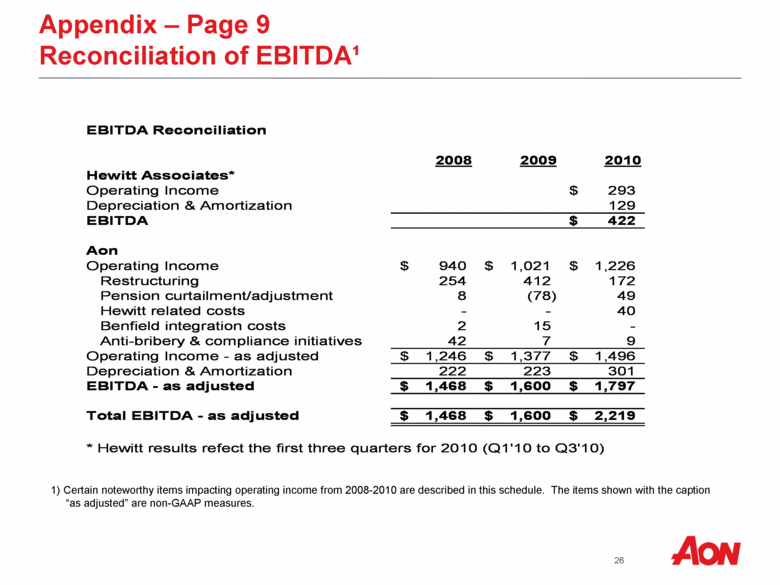
Appendix – Page 9 Reconciliation of EBITDA¹ 1) Certain noteworthy items impacting operating income from 2008-2010 are described in this schedule. The items shown with the caption “as adjusted” are non-GAAP measures. EBITDA Reconciliation 2008 2009 2010 Hewitt Associates* Operating Income 293 $ Depreciation & Amortization 129 EBITDA 422 $ Aon Operating Income 940 $ 1,021 $ 1,226 $ Restructuring 254 412 172 Pension curtailment/adjustment 8 (78) 49 Hewitt related costs - - 40 Benfield integration costs 2 15 - Anti-bribery & compliance initiatives 42 7 9 Operating Income - as adjusted 1,246 $ 1,377 $ 1,496 $ Depreciation & Amortization 222 223 301 EBITDA - as adjusted 1,468 $ 1,600 $ 1,797 $ Total EBITDA - as adjusted 1,468 $ 1,600 $ 2,219 $ * Hewitt results refect the first three quarters for 2010 (Q1'10 to Q3'10) |

