Attached files
| file | filename |
|---|---|
| 8-K - AMERICAN EXPRESS CO | c64401_8k.htm |

American Express Company
Financial Community Meeting
Kenneth Chenault
Chairman and Chief Executive Officer
Doug Buckminster
President, International Consumer Card and Small
Business Services
February 9, 2011

This presentation contains certain non-GAAP financial disclosures, including information regarding the
Company’s “International Business Operations” and information that is reported
on a “managed” basis.
International Business Operations (IBO) includes the Company's International Card Services (ICS)
segment as well as the international portions of the Global Commercial Services (GCS) and the Global
Network
& Merchant Services (GNMS) segments. Reconciliations of this information to GAAP
information is included in the annexes. The Company is presenting information on an IBO basis
because management believes it presents a useful
perspective on the performance of the Company’s
international businesses. International represents the sum of the Europe, Middle East and Africa
(EMEA) region, the Japan, Asia/Pacific and Australia (JAPA) region and the Latin America,
Caribbean
and Canada (LACC) region to be set forth in the geographic operations footnote to the Company’s 2010
consolidated financial statements. Due to system limitations related to geographic reporting prior to
2008, the Company
is unable to identify the specific nature of the reconciling items related to amounts
previously reported in the Company’s financial statements and the IBO basis presentation. Managed
basis assumes no securitization transactions, i.e.,
all securitized loans and related income effects are
reflected as if they were in the Company's balance sheet and income statement, respectively. The
Company is presenting information on a managed basis because that is the way management
views
and manages the business. Management believes that a full picture of trends in the Company's
cardmember lending business can only be derived by evaluating the performance of both securitized
and non-securitized cardmember loans,
and that use of a managed basis presentation presents a more
comprehensive portrayal of the key dynamics of the cardmember lending business. These non-GAAP
measures are not intended to replace the Company’s GAAP information.
2
Note Relating to Non-GAAP Financial
Disclosures

This presentation includes forward-looking statements within the meaning of the Private Securities Litigation Reform Act of 1995, which are subject to
risks and uncertainties. The
forward-looking statements, which address the company’s expected business and financial performance, among other
matters, contain words such as “believe,” “expect,” “estimate,” “anticipate,” “optimistic,”
“intend,” “plan,” “aim,” “will,” “may,” “should,” “could,” “would,”
“likely,” and similar expressions. Readers are cautioned not to place undue reliance
on these forward-looking statements, which speak only as of the
date on which they are made. The Company undertakes no obligation to update or revise any forward-looking statements. Factors that could cause
actual results to differ
materially from these forward-looking statements, include, but are not limited to, the following:
changes in global economic and business conditions, including consumer and business spending, the availability and cost of credit, unemployment and
political conditions, all of which may significantly
affect spending on the Card, delinquency rates, loan balances and other aspects of our business and
results of operations;
changes in capital and credit market conditions, which may significantly affect the Company’s ability to meet its liquidity needs, access to capital and
cost of capital, including changes
in interest rates; changes in market conditions affecting the valuation of our assets; or any reduction in our credit
ratings or those of our subsidiaries, which could materially increase the cost and other terms of our funding, restrict our access to the
capital markets or
result in contingent payments under contracts;
litigation, such as class actions or proceedings brought by governmental and regulatory agencies (including the lawsuit filed against the Company by
the U.S. Department of Justice and certain
state attorneys general), that could result in (i) the imposition of behavioral remedies against the Company or
the Company’s voluntarily making certain changes to its business practices, the effects of which in either case could have a material adverse
impact on
the Company’s financial performance; (ii) the imposition of substantial monetary damages in private actions against the Company; and/or (iii) damage
to the Company’s global reputation and brand;
the Company’s net interest yield on U.S. cardmember loans not trending over time to historical levels as expected, which will be influenced by, among
other things, the effects of the CARD
Act (including the regulations requiring the Company to periodically reevaluate APR increases), interest rates,
changes in consumer behavior that affect loan balances, such as paydown rates, the Company’s cardmember acquisition strategy, product mix,
credit
actions, including line size and other adjustments to credit availability, and pricing changes;
legal and regulatory developments wherever we do business, including legislative and regulatory reforms in the United States, such as the Dodd-Frank
Act’s stricter regulation of large, interconnected
financial institutions, changes in requirements relating to securitization and the establishment of the
Bureau of Consumer Financial Protection, which could make fundamental changes to many of our
business practices or materially affect our capital
requirements, results of operations, ability to pay dividends or repurchase our stock; or actions and potential future actions by the FDIC and credit rating
agencies applicable to securitization trusts,
which could impact the company’s ABS program;
changes in the substantial and increasing worldwide competition in the payments industry, including competitive pressure that may impact the prices
we charge merchants that accept our Cards and
the success of marketing, promotion or rewards programs;
changes in technology or in our ability to protect our intellectual property (such as copyrights, trademarks, patents and controls on access and
distribution), and invest in and compete
at the leading edge of technological developments across our businesses, including technology and intellectual
property of third parties whom we rely on, all of which could materially affect our results of operations;
3
Cautionary Note Regarding Forward-
Looking Statements

data breaches and fraudulent activity, which could damage our brand, increase our costs or have regulatory implications, and changes in regulation
affecting privacy and data security under federal,
state and foreign law, which could result in higher compliance and technology costs to ourselves or our
vendors;
changes in our ability to attract or retain qualified personnel in the management and operation of the company’s business, including any changes that may
result from increasing regulatory
supervision of compensation practices;
changes in the financial condition and creditworthiness of our business partners, such as bankruptcies, restructurings or consolidations, involving
merchants that represent a significant portion
of our business, such as the airline industry, or our partners in Global Network Services or financial
institutions that we rely on for routine funding and liquidity, which could materially affect our financial condition or results of operations;
uncertainties associated with business acquisitions, including the ability to realize anticipated business retention, growth and cost savings or effectively
integrate the acquired business into
our existing operations;
the underlying assumptions related to the Company’s pending acquisition of Loyalty Partner proving to be inaccurate; unrealized events impacting the
likelihood and timing of the completion
of the transaction; the Company’s ability to exploit the assets to be acquired upon consummation of the transaction;
and the Company's ability to execute its acquisition strategy including expanding to other countries, cross-selling and developing
new products;
changes affecting the success of our reengineering and other cost control initiatives, which may result in the company not realizing all or a significant
portion of the benefits that
we intend;
the actual amount to be spent by the Company on investments in the business, including on marketing, promotion, rewards and cardmember services and
certain other operating expenses, which will
be based in part on management’s assessment of competitive opportunities and the Company’s performance
and the ability to control and manage operating, infrastructure, advertising and promotion expenses as business expands or changes;
the effectiveness of the Company’s risk management policies and procedures, including credit risk relating to consumer debt, liquidity risk in meeting
business requirements and operational
risks;
changes affecting our ability to accept or maintain deposits due to market demand or regulatory constraints, such as changes in interest rates and
regulatory restrictions on our ability to obtain
deposit funding or offer competitive interest rates, which could affect our liquidity position and our ability to
fund our business; and
factors beyond our control such as fire, power loss, disruptions in telecommunications, severe weather conditions, natural disasters, terrorism, “hackers”
or fraud, which could affect
travel-related spending or disrupt our global network systems and ability to process transactions.
A further description of these uncertainties and other risks can be found in the Company’s Annual Report on Form 10-K for the year ended December 31, 2009,
its Quarterly Reports on Form
10-Q for the three months ended March 31, June 30, and September 30, 2010, and the Company’s other reports filed with
the SEC.
4
Cautionary Note Regarding Forward-
Looking Statements (cont’d)

5
Annex 1
($ in millions)
2010
2009
%Inc/(Dec)
GAAP Total Revenues Net of Interest Expense
$27,819
$24,523
13%
Securitization Adjustments:
Discount revenue, net card fees and other
NA
331
Interest income
NA
3,097
Securitization income, net
NA
(400)
Interest expense
NA
(244)
Managed Total Revenues Net of Interest
Expense
$27,819
$27,307
2%

6
Annex 2
*FX adjusted information assumes a constant exchange rate between the periods being compared for purposes of currency translation into U.S. dollars. (e.g., assumes foreign exchange
rate used
for Q4'10 applies to Q4'09; rate used for Q3’10 applies to Q3’09, etc.)
Billed Business Metrics - Reported & FX Adjusted*
% increase/(decrease) vs. prior year:
Q1'08
Q2'08
Q3'08
Q4'08
Q1'09
Q2'09
Q3'09
Q4'09
Q1'10
Q2'10
Q3'10
Q4'10
Worldwide
Reported
14%
12%
8%
(10%)
(16%)
(16%)
(11%)
8%
16%
16%
14%
15%
FX Adjusted
11%
10%
7%
(5%)
(12%)
(13%)
(9%)
4%
12%
15%
14%
14%
International Business Operations
Reported
27%
26%
17%
(12%)
(19%)
(19%)
(9%)
21%
27%
19%
17%
16%
FX Adjusted
15%
16%
14%
3%
(3%)
(7%)
(3%)
7%
14%
16%
16%
15%

7
Annex 3
Cardmember Lending
($ in billions, except percentages)
Q1'07
Q2'07
Q3'07
Q4'07
Q1'08
Q2'08
Q3'08
Q4'08
Q1'09
Q2'09
Q3'09
Q4'09
Total Loans
Worldwide Cardmember Lending
Reported (GAAP)
$42.2
$48.2
$50.4
$54.4
$49.4
$49.6
$45.7
$42.2
$36.7
$32.5
$31.5
$32.8
Managed
$63.1
$68.5
$71.9
$77.1
$75.1
$76.5
$75.5
$72.0
$65.0
$62.9
$60.7
$61.8
Net Write-off Rate
Worldwide
Reported (GAAP)
7.4%
Managed
7.3%
USCS
Reported (GAAP)
4.5%
5.8%
6.1%
7.0%
8.5%
10.3%
9.8%
8.0%
Managed
4.3%
5.3%
5.9%
6.7%
8.5%
10.0%
8.9%
7.5%
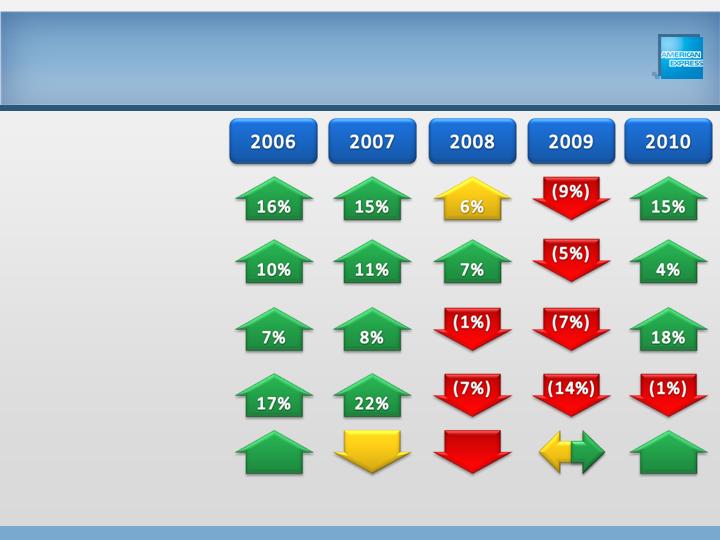
2006
2007
2008
2009
2010
Total Loans Year Over Year
Reported (GAAP)
Managed
$43.3
$63.5
$54.4
$77.1
$42.4
$72.0
$32.8
$61.8
$60.9
$60.9
Growth Rate vs. Prior Year
Reported (GAAP)
Managed
31%
17%
26%
22%
(22%)
(7%)
(22%)
(14%)
86%
(1%)

Annex 4 (A)
($ in millions, except percentages)
(A) Beginning in the first quarter of 2010, the Company changed the manner in which it allocates related interest expense and capital to its reportable operating segments to more accurately reflect
the funding and capital characteristics of the Company's segments. The change to interest allocation impacted the segment’s net interest yield on cardmember loans. Accordingly, the net interest
yields for periods prior to the first quarter
of 2010 have been revised for this change. (B) For periods ended on or prior to December 31, 2009, the Company's cardmember loans and related debt
performance information on a GAAP basis was referred to as the “owned” basis presentation. The information
presented on a GAAP basis for such periods includes only non-securitized cardmember
loans that were included in the Company’s balance sheet. Effective January 1, 2010, the Company’s securitized portfolio of cardmember loans and related debt is
also consolidated on its balance
sheet upon the adoption of the new GAAP. Accordingly, beginning January 1, 2010, the GAAP basis presentation includes both securitized and non-securitized cardmember loans. Refer to page 19
of the earnings financial
tables for a discussion of GAAP basis information. (C) Represents net interest income allocated to the Company's cardmember loans portfolio on a GAAP or managed basis,
as applicable, in each case excluding the impact of card fees on loans and
balance transfer fees attributable to the Company's cardmember loans. (D) Represents average cardmember loans on a
GAAP or managed basis, as applicable, in each case excluding the impact of deferred card fees, net of deferred direct acquisition costs of
cardmember loans. (E) This calculation includes elements
of total interest income and total interest expense that are not attributable to the cardmember loan portfolio, and thus is not representative of net interest yield on cardmember loans.
The calculation
includes interest income and interest expense attributable to investment securities and other interest-bearing deposits as well as to cardmember loans,and interest expense attributable to other
activities, including cardmember receivables.
(F) Net interest yield on cardmember loans is a non-GAAP financial measure that represents the net spread earned on cardmember loans. Net interest
yield on cardmember loans is computed by dividing adjusted net interest income by adjusted average
loans, computed on an annualized basis. The calculation of net interest yield on cardmember
loans includes interest that is deemed uncollectible. For all presentations of net interest yield on cardmember loans, reserves and net write-offs related
to uncollectible interest are recorded through
provisions for losses - cardmember loans; therefore, such reserves and net write-offs are not included in the net interest yield calculation. (G) For periods ended on or prior to December 31, 2009,
information presented is based on the Company’s historical non-GAAP, or “managed” basis presentation. Unlike the GAAP basis presentation, the information presented on a managed basis in such
periods includes both the securitized and non-securitized
cardmember loans. The adoption of new GAAP on January 1, 2010 resulted in accounting for both the Company's securitized and non-
securitized cardmember loans in the consolidated financial statements. As a result, the Company's 2010 GAAP presentations and
managed basis presentations prior to 2010 are generally
comparable. Refer to page 19 in the earnings financial tables for a discussion of managed basis information.(H) For periods ended on or prior to December 31, 2009, the information presented
includes
the adjustments to the GAAP "owned" basis presentation for such periods attributable to securitization activity for interest income and interest expense to arrive at the non-GAAP "managed"
basis information, which adjustments are set forth under the U.S.
Card Services managed basis presentation on page 22 of the earnings financial tables.
8
12/31/08
3/31/09
6/30/09
9/30/09
12/31/09
3/31/10
6/30/10
9/30/10
12/31/10
USCS - Calculation based on 2010 and 2009 GAAP information (B):
Net interest income
$669
$766
$612
$649
$621
$1,221
$1,111
$1,124
$1,122
Average loans (billions)
$33.2
$30.2
$26.5
$23.4
$22.7
$50.5
$49.1
$49.1
$49.8
Adjusted net interest income (C)
$725
$775
$581
$558
$537
$1,246
$1,145
$1,150
$1,143
Adjusted average loans (billions) (D)
$33.3
$30.3
$26.6
$23.5
$22.8
$50.5
$49.2
$49.2
$49.8
Net interest income divided by average loans (E)
8.0%
10.3%
9.3%
11.0%
10.9%
9.8%
9.1%
9.1%
8.9%
Net interest yield on cardmember loans (F)
8.7%
10.4%
8.8%
9.4%
9.4%
10.0%
9.3%
9.3%
9.1%
USCS - Calculation based on 2010 and 2009 managed information (G):
Net interest income (H)
$1,341
$1,569
$1,335
$1,305
$1,292
$1,221
$1,111
$1,124
$1,122
Average loans (billions)
$63.0
$59.1
$55.1
$52.9
$51.8
$50.5
$49.1
$49.1
$49.8
Adjusted net interest income (C)
$1,418
$1,592
$1,343
$1,315
$1,308
$1,246
$1,145
$1,150
$1,143
Adjusted average loans (billions) (D)
$63.1
$59.2
$55.2
$53.0
$51.9
$50.5
$49.2
$49.2
$49.8
Net interest yield on cardmember loans (F)
8.9%
10.9%
9.7%
9.8%
10.0%
10.0%
9.3%
9.3%
9.1%
Quarters Ended

Annex 5
Note: The Company is presenting information on an IBO basis because management believes it presents a useful perspective on the performance of the Company’s
international businesses.
*Unallocated Corporate & Other Segment represents Corporate & Other Segment results which are not directly allocable to specific geographic regions. Examples include
costs
related to the negative spread earned on excess liquidity and executive office operations. **International represents the sum of the Europe, Middle East and Africa
(EMEA) region, the Japan, Asia/Pacific and Australia (JAPA) region and the Latin America,
Caribbean and Canada (LACC) region to be set forth in the geographic
operations footnote to the Company’s 2010 consolidated financial statements. ***Due to system limitations related to geographic reporting prior to 2008, the Company is
unable
to identify the specific nature of the reconciling items related to amounts previously reported in the Company’s financial statements and the IBO basis presentation.
****FX adjusted information assumes the average exchange rate in 2010 applies to all
prior periods for purposes of currency translation into U.S. dollars.
$ in millions; % increase/(decrease)
2006
2007
2008
2009
2010
GAAP Consolidated Pretax Income
$5,152
$5,694
$3,581
$2,841
$5,964
Pretax Income from continuing ops - United States
$4,312
$4,984
$3,322
$3,131
$6,112
Pretax Income from continuing ops - Unallocated Corp & Other Segment*
NA
NA
($527)
($1,162)
($1,527)
Pretax Income from continuing ops - International**
$840
$710
$786
$872
$1,379
Reconciliation to International Business Operations (IBO) Basis Presentation
Pretax Income from continuing ops - International**
$840
$710
$786
$872
$1,379
Reconciling Items***
($89)
($3)
-
-
-
Pretax Income from continuing ops - IBO Basis
$751
$707
$786
$872
$1,379
FX Adjustment****
$67
$16
($70)
$24
NA
Pretax Income from continuing ops - IBO Basis FX Adjusted
$818
$723
$716
$896
$1,379
PTI Growth IBO Basis FX Adj.
(12%)
(1%)
25%
54%
PTI Growth IBO Basis
(6%)
11%
11%
58%
PTI Growth International
(15%)
11%
11%
58%
PTI Growth Consolidated
11%
(37%)
(21%)
110%
PTI CAGR 2006 to 2010 IBO Basis FX Adj.
14%
PTI CAGR 2006 to 2010 IBO Basis
16%
PTI CAGR 2006 to 2010 International
13%
PTI CAGR 2006 to 2010 Consolidated
4%
9

Annex 6
10
*FX adjusted information assumes the average exchange rate in 2010 applies to all prior periods for purposes of currency translation into U.S. dollars.
Billed Business Metrics - Reported & FX Adjusted*
$ in billions, % increase/(decrease) vs. prior year:
2006
2007
2008
2009
2010
International Business Operations
Reported
154.7
$
188.0
$
212.2
$
196.1
$
234.0
$
FX Adjusted
163.3
$
185.6
$
205.8
$
202.7
$
234.0
$
Reported
22%
13%
(8%)
19%
FX Adjusted
14%
11%
(2%)
15%
CAGR 2006-2010 - Reported
11%
CAGR 2006-2010 - FX Adjusted
9%
"Growth Markets"
Reported
30.3
$
30.5
$
39.2
$
FX Adjusted
28.7
$
32.8
$
39.2
$
CAGR 2008-2010 - Reported
14%
CAGR 2008-2010 - FX Adjusted
17%

Annex 7
Note: The Company is presenting information on an IBO basis because management believes it presents a useful perspective on the performance of the Company’s
international businesses.
*Unallocated Corporate & Other Segment represents Corporate & Other Segment results which are not directly allocable to specific geographic regions. Examples include
costs
related to the negative spread earned on excess liquidity and executive office operations. **International represents the sum of the Europe, Middle East and Africa
(EMEA) region, the Japan, Asia/Pacific and Australia (JAPA) region and the Latin America,
Caribbean and Canada (LACC) region to be set forth in the geographic
operations footnote to the Company’s 2010 consolidated financial statements. ***FX adjusted information assumes the average exchange rate in 2010 applies to all prior
periods
for purposes of currency translation into U.S. dollars.
$ in millions; % increase/(decrease)
Revenues net of Interest Expense
2008
2009
2010
GAAP Consolidated Revenues net of Interest Expense
$28,365
$24,523
$27,819
Revenues net of Interest Expense - United States
$19,792
$17,489
$20,246
Revenues net of Interest Expense - Unallocated Corp & Other Segment*
($45)
($861)
($874)
Revenues net of Interest Expense - International**
$8,618
$7,895
$8,447
Reconciliation to International Business Operations (IBO) Basis Presentation
Revenues net of Interest Expense - International**
$8,618
$7,895
$8,447
Reconciling Items
-
-
-
Revenues net of Interest Expense - IBO Basis
$8,618
$7,895
$8,447
FX Adjustment***
($321)
$272
NA
Revenues net of Interest Expense - IBO Basis FX Adjusted
$8,297
$8,167
$8,448
Revenue net of Interest Growth - IBO Basis FX Adj.
(2%)
3%
Revenue net of Interest Growth - IBO Basis
(8%)
7%
Revenue net of Interest Growth - International
(8%)
7%
Revenue net of Interest Growth - Consolidated
(14%)
13%
11

Annex 8
Note: The Company is presenting information on an IBO basis because management believes it presents a useful perspective on the performance of the Company’s
international businesses.
*Unallocated Corporate & Other Segment represents Corporate & Other Segment results which are not directly allocable to specific geographic regions. Examples include
costs
related to the negative spread earned on excess liquidity and executive office operations. **International represents the sum of the Europe, Middle East and Africa
(EMEA) region, the Japan, Asia/Pacific and Australia (JAPA) region and the Latin America,
Caribbean and Canada (LACC) region to be set forth in the geographic
operations footnote to the Company’s 2010 consolidated financial statements. ***FX adjusted information assumes the average exchange rate in 2010 applies to all prior
periods
for purposes of currency translation into U.S. dollars.
$ in millions; % increase/(decrease)
2008
2009
2010
GAAP Consolidated Operating Expenses
$11,625
$9,902
$11,004
Operating Expenses - United States
$6,266
$5,468
$5,860
Operating Expenses - Unallocated Corp & Other Segment*
$482
$301
$653
Operating Expenses - International**
$4,877
$4,132
$4,491
Reconciliation to International Business Operations (IBO) Basis Presentation
Operating Expenses - International**
$4,877
$4,132
$4,491
Reconciling Items
-
-
-
Operating Expenses - IBO Basis
$4,877
$4,132
$4,491
FX Adjustment***
$191
($85)
NA
Operating Expenses - IBO Basis FX Adjusted
$4,687
$4,218
$4,491
Operating Expenses Growth - IBO Basis FX Adj.
(10%)
6%
Operating Expenses Growth - IBO Basis
(15%)
9%
Operating Expenses Growth - International
(15%)
9%
Operating Expenses Growth - Consolidated
(15%)
11%
Operating Expenses (Salaries & Benefits, Professional Services, Occupancy & Equipment, Communications &
Other, Net)
12

Annex 9
13
International Card Services Loans, FX Adjusted*
($ in billions, except percentages)
2008
2009
2010
Total Loans
Reported
$9.5
$9.2
$9.3
FX Adjusted
$10.7
$9.6
$9.3
Growth Rates vs. Prior Year
Reported
(3%)
1%
FX Adjusted
(10%)
(3%)
*FX adjusted information assumes the average exchange rate in 2010 applies to all prior periods for purposes of currency translation into U.S. dollars.

Annex 10
Note: The Company is presenting information on an IBO basis because management believes it presents a useful perspective on the performance of the Company’s
international businesses.
*Unallocated Corporate & Other Segment represents Corporate & Other Segment results which are not directly allocable to specific geographic regions. Examples include
costs
related to the negative spread earned on excess liquidity and executive office operations. **International represents the sum of the Europe, Middle East and Africa
(EMEA) region, the Japan, Asia/Pacific and Australia (JAPA) region and the Latin America,
Caribbean and Canada (LACC) region to be set forth in the geographic
operations footnote to the Company’s 2010 consolidated financial statements. ***FX adjusted information assumes the average exchange rate in 2010 applies to all prior
periods
for purposes of currency translation into U.S. dollars.
$ in millions; % increase/(decrease)
2008
2010
2008
2010
2008
2010
2008
2010
2008
2010
2008
2010
2008
2010
Pretax Income
$3,581
$5,964
$3,322
$6,112
($527)
($1,527)
$786
$1,379
$373
$572
$122
$304
$291
$503
Reconciling Items
-
-
-
-
-
-
-
-
Pretax Income - IBO Basis
$786
$1,379
$373
$572
$122
$304
$291
$503
FX Adjustment***
($70)
NA
($46)
NA
$1
NA
($25)
NA
Pretax Income - IBO Basis FX Adjusted
$716
$1,379
$327
$572
$123
$304
$266
$503
Pretax Income 2008 to 2010 CAGR - IBO Basis FX Adj
39%
32%
57%
37%
Pretax Income 2008 to 2010 CAGR - IBO Basis
32%
24%
58%
31%
Pretax Income 2008 to 2010 CAGR - Consolidated
29%
Provision for Loss by Region
2010
2010
2010
2010
2010
2010
2010
Provision for Losses
$2,207
$1,740
-
$468
$134
$148
$186
Reconciling Items
-
-
-
-
Provisions for Losses - IBO Basis
$464
$132
$147
$186
Europe, Middle East &
Africa
Japan, Asia/Pacific,
Australia
Latin America, Caribbean
& Canada
International**
GAAP Consolidated
United States
Unallocated Corporate
Segment*
GAAP Consolidated
United States
Unallocated Corporate
Segment*
International**
Latin America, Caribbean
& Canada
Japan, Asia/Pacific,
Australia
Europe, Middle East &
Africa
14

15
Supplemental Annex
Average Fee Per Card on Consolidated Basis – GAAP & Adjusted *
2010
Average Fee Per Card (GAAP)
$38
Average Fee Per Card (Adjusted)
$41
* Average fee per card is computed from proprietary card activities only. Average fee per card is computed based on net card
fees, including the amortization of deferred direct
acquisition costs, plus card fees included in interest and fees on loans (including related amortization of deferred direct acquisition costs), divided by average worldwide
proprietary cards-in-force.
The card fees related to cardmember loans included in interest and fees on loans were $220 million for the year ended December 31, 2010 on a
consolidated basis. The adjusted average fee per card is computed in the same manner, but excludes amortization
of deferred direct acquisition costs (a portion of which is
charge card related and included in net card fees and a portion of which is lending related and included in interest and fees on loans). The amount of amortization excluded was
$207 million
for the year ended December 31, 2010 on a consolidated basis. The Company presents adjusted average fee per card because management believes that this
metric presents a useful indicator of card fee pricing across a range of its proprietary card
products.

American Express Company
Financial Community
Meeting
Presentation of Kenneth Chenault
Chairman and Chief Executive Officer
February 9, 2011

Success in 2010
Investing in Transformation
AXP: The International Story
Q & A
17
Agenda
Historical Financial
Performance
*Net income, including results from discontinued operations, was $3.7B for 2006, down 1% vs. the prior year, $4.0B for 2007, up 8%; $2.7B for 2008, down 33%; $2.1B for 2009,
down 21%, and $4.1
for 2010, up 90%. **Attributable to common shareholders. Excludes preferred share dividends and earnings allocated to participating share awards.
Diluted EPS on a net income basis was $2.99 in 2006, $3.34 in 2007,
$2.32 in 2008, $1.54 in 2009 and $3.35 for 2010. †See Annex 1 for a reconciliation to GAAP basis.
Total Revenues Net of Interest
Expense
Income from Continuing
Operations*
Growth vs. Prior Year
Growth vs. Prior Year
($ in billions)
Return on Average Common
Equity
3%
$28.4
(30%)
$2.9
22%
11%
$27.6
14%
$4.1
11%
$24.8
18%
$3.6
35%
37%
Diluted EPS from Continuing
Ops**
18
Growth vs. Prior Year (Managed)
†
(14%)
$24.5
(26%)
$2.1
14%
13%
$27.8
90%
$4.1
27%
2%
$2.47
$3.44
$2.93
$1.54
$3.35
Historical Metric Trends
Mgd. Cardmember
Loans***
Credit Performance
Avg. Basic
Cardmember
Spending**
Total Cards In
Force
*Card billed business includes activities (including cash advances) related to proprietary cards, cards issued under network partnership agreements, and certain insurance fees
charged on proprietary
cards. **Computed from proprietary card activities only. ***Managed basis includes non-securitized and securitized
loans. On a GAAP basis, loan growth
increased/(decreased) by 31% in 2006, 26% in 2007, (22%) in 2008, (22%) in 2009 and 86% for 2010. See Annex 3 for reported basis.
Billed Business*
%
increase/(decrease
) vs. prior year:
19
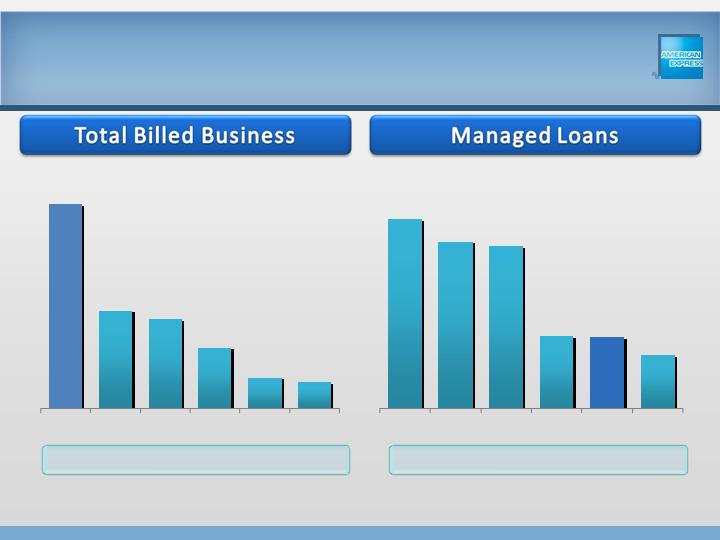
$161
$141
$138
$61
$61
$45
Citi*
BofA***
JPM**
Cap One
AXP
Discover
$342
$313
$213
$107
$93
$713
AXP
Citi*
JPM**
BofA***
Cap One
Discover
Full Year 2010 Relative
Performance
Growth
vs. PY
15%
(5%)
6%
3%
5%
6%
*Includes Citi-Branded Cards and Citi Holdings Retail Partners North America Cards. **Includes the impact of the Washington Mutual
acquisition. Reported billings shown
above reflects sales volume, which excludes balance transfers. ***Credit Card, includes US consumer and foreign credit card. †Global Card. ††Fiscal year ends November 30.
Billed business is credit card sales volume; disclosed total credit card volume was $99B for full year 2010 ended 11/30/10 and increased 3%. ‡On a GAAP basis, loans
increased 86%, which reflects the consolidation of off-balance sheet assets. See
Annex 3 for reported basis.
Growth
vs. PY
(10%)
(12%)
(16%)
(10%)
(1%)
(5%)
($ in billions)
($ in billions)
‡
†
††
†
††
20
Mgd.
21
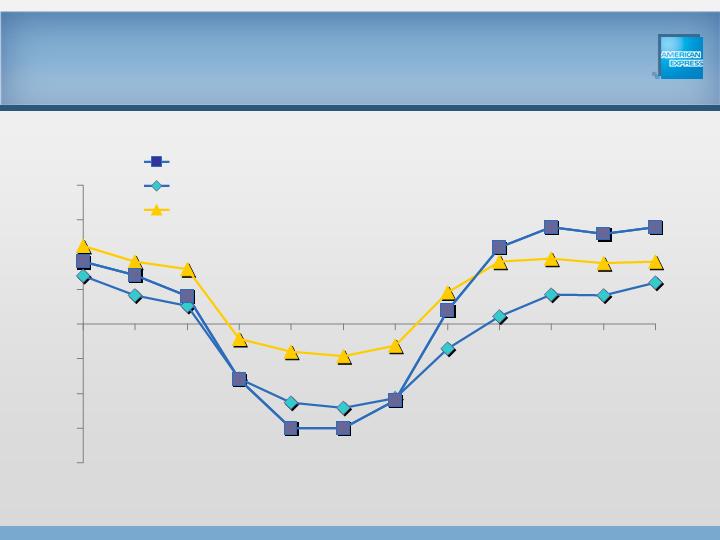
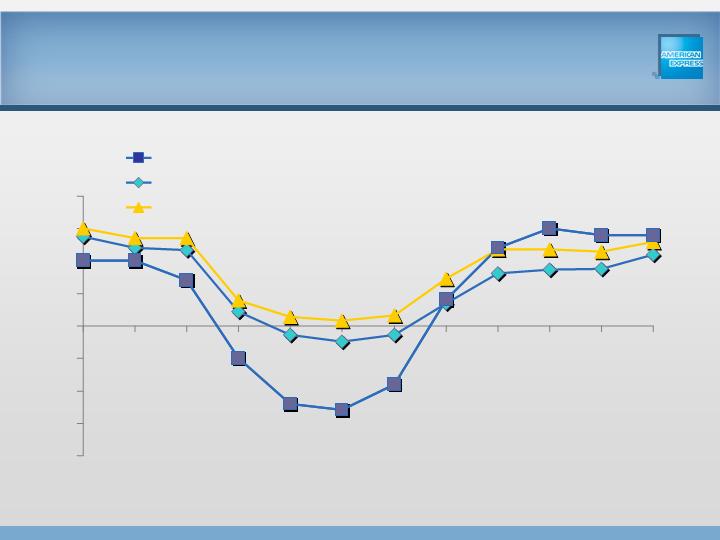
% increase/(decrease) vs. prior year:
Billings Growth – U.S.
*AXP includes credit and charge, excludes debit & cash. **Includes credit and charge only, but excludes debit and cash. ***Includes credit, charge and debit, but
excludes cash.
(20%)
(15%)
(10%)
(5%)
0%
5%
10%
15%
20%
Q1'08
Q3'08
Q1'09
Q3'09
Q1'10
Q3'10
AXP*
MasterCard/Visa - Credit & Charge Volume**
MasterCard/Visa - Total Payment Volume***
Q4’10
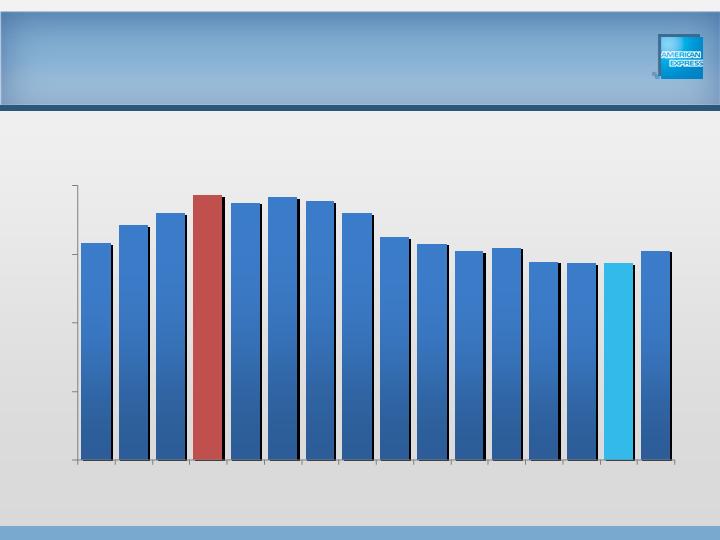
19.9%
20.6%
19.9%
19.5%
20.4%
21.2%
22.2%
23.0%
23.7%
24.0%
23.8%
25%+ (Est.)
1999
2000
2001
2002
2003
2004
2005
2006
2007
2008
2009
2010**
General Purpose Charge and Credit*
AXP Share of U.S. Purchase
Volume
Source: The Nilson Report. *Excludes cash advances. **Internal estimate of 2010 AXP share of U.S. Purchase Volume based on publicly disclosed AXP
results for 2010 and projections
of Discover, MasterCard and Visa U.S. Purchase Volume provided by a consulting firm.
22
Billings Growth – Global
23
†FX adjusted information assumes
a constant exchange rate between the periods being compared for purposes of currency translation into US dollars. (e.g., assumes foreign
exchange rate used for Q4'10 applies to Q4'09 and rate used for Q3'10 applies to Q3'09, etc.) *AXP includes credit
and charge, excludes debit and cash. See Annex 2 for
reported basis. **Includes credit and charge only, but excludes debit and cash. ***Includes credit, charge and debit, but excludes cash.
(20%)
(15%)
(10%)
(5%)
0%
5%
10%
15%
20%
Q1 '08
Q3'08
Q1'09
Q3'09
Q1'10
Q3'10
AXP*
MasterCard/Visa - Credit & Charge Volume**
MasterCard/Visa - Total Payment Volume***
FX adjusted† % increase/(decrease) vs. prior year:
Q4’10
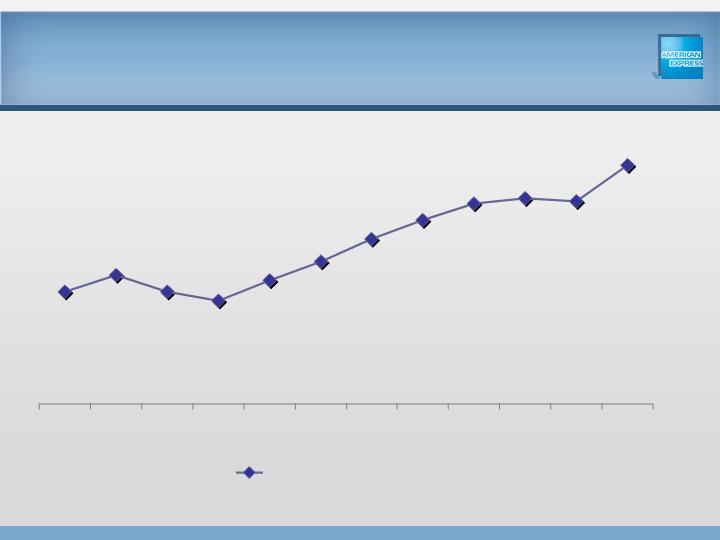
77.078
57.2
$0
$20
$40
$60
$80
Q1'07
Q3'07
Q1'08
Q3'08
Q1'09
Q3'09
Q1'10
Q3'10
AXP Worldwide Managed Loans
See Annex 3 for loans on a GAAP basis for periods prior to 2010.
($ in billions)
24
Q4’10
February
implementation
of the CARD Act
Increased
Cost of Funds
due to spike in
October 1M
LIBOR rate
Repriced additional
segments of US
lending portfolio
Loss of revenue due
to August CARD Act
implementation
Impact of
Collections
Strategy
Lower revolve
rate
Improved Cost of
Funds due to
LIBOR reversion
Re-priced 55% of
US Lending
Portfolio
First full quarter
impact of Feb.
CARD Act
implementation
Cardmember
behavior
8.9%
10.9%
9.7%
9.8%
10.0%
10.0%
9.3%
9.3%
9.1%
Q4 '08
Q1 '09
Q2 '09
Q3 '09
Q4 '09
Q1'10
Q2'10
Q3'10
Q4'10
USCS Net Interest Yield
Managed Cardmember Loans
See Annex 4 for reconciliation of net interest income divided by average loans, a GAAP measure, and net interest yield, a non-GAAP measure.
25
*See Annex 3 for GAAP basis for Q4’09. **Fiscal year ends November 30. US Card. *** Includes the impact of the Washington Mutual acquisition. †Global
Card.
††Credit Card, includes US consumer and foreign credit card. ‡Citi-Branded Cards.
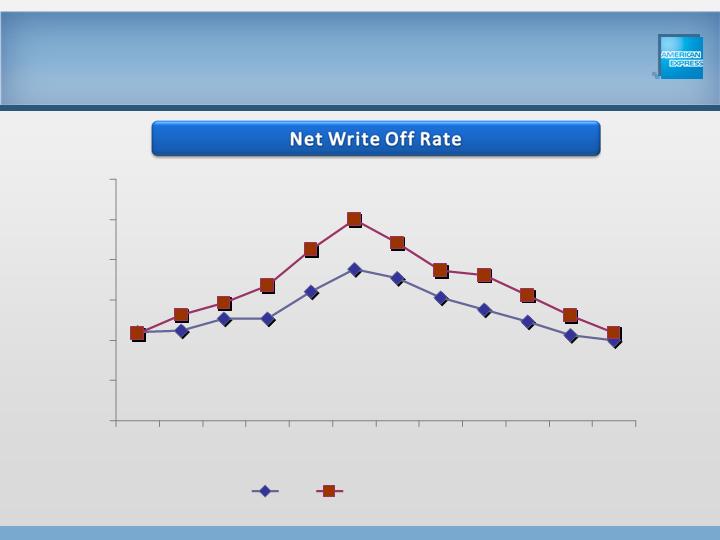
AXP Lending Managed Net Write-off
Rates versus Competitors
26
11.8%
10.3%
10.0%
7.3%
8.8%
9.3%
9.6%
11.9%
9.3%
9.0%
12.2%
4.3%
7.0%
7.9%
7.2%
8.2%
7.8%
AXP
Discover
JPMorgan
Cap One
Bank of
America
Citi
Q4'0
9
Q4'1
0
††
†
***
**
*
‡

Success in 2010
Investing in Transformation
AXP: The International Story
Q & A
27
Agenda

28
2010 Investment Priorities
Focus on premium customers
Charge Card
Co-Brands
Drive network growth
Coverage / brand awareness
GNS partner volume
Alternative payments
Drive new revenues
by leveraging
our unique business model
29
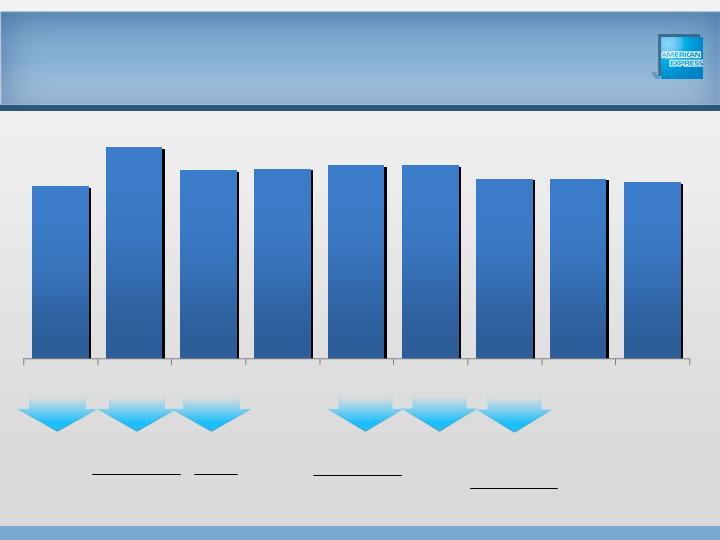
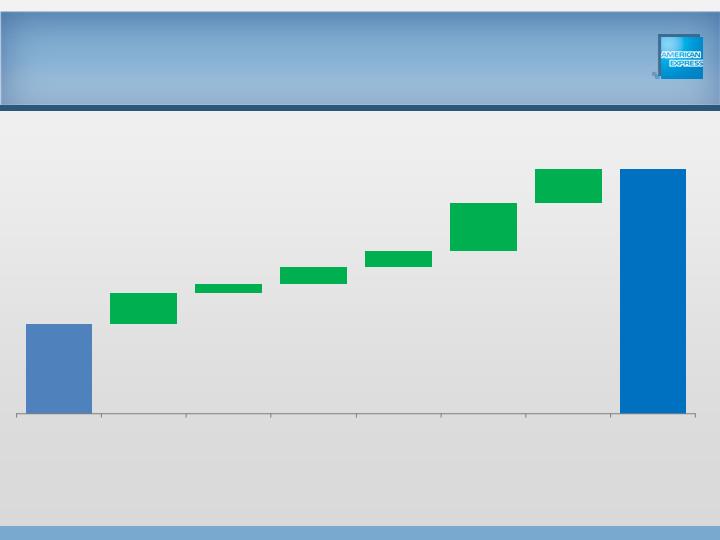
Total Expenses: A Year of
Investment
16.4
19.6
0.6
0.2
0.4
0.3
1.0
0.7
2009 Total
Expenses
Charge &
Premium
Lending*
Merchant
& GNS**
Fee Based
Revenue/Alt
Payments†
Brand
Investment
Cardmember
Rewards
Other††
2010 Total
Expenses
$ in billions; change in 2010 total expenses vs.
2009:
*Includes expenses related to acquisition, loyalty and cardmember sales force. **Includes sales force, marketing & promotion costs and other operating costs related to GNS.
†Includes operating costs of LoyaltyEdge, Business Insights and Serve Enterprise (formerly Revolution
Money), as well as variable technology investments. † †Consists of other
expenses
not directly related to these defined investment categories.
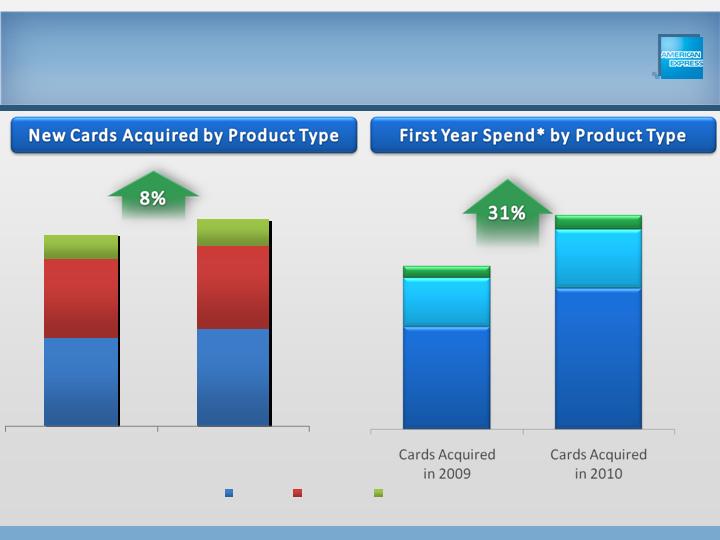
Global Proprietary
New Cards and First Year Spend
Acquired
*First Year Spend reflects the first 12 months of spending for a new card acquired. For future periods, internal estimates have
been used, i.e. new cards acquired in June’10
include 6 months of actual spend and 6 months of internally forecasted spend.
2009
2010
Charge
Co-Brand
Prop Lending
15%
4%
11%
YOY Growth
23%
20%
38%
YOY Growth
30
31
FY'2009
FY'2010
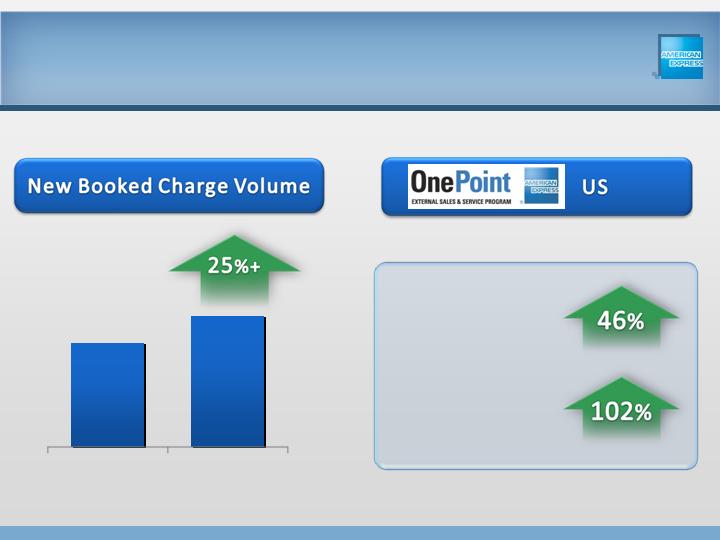
Global Coverage Expansion
Expanding Acceptance and Growing Spend
December ‘10 YTD vs. December ‘09
YTD
New Signings
New Booked
Charge
Volume
Global:
$0
$10
$20
$30
$40
$50
$60
$70
$80
$90
$100
1999
2000
2001
2002
2003
2004
2005
2006
2007
2008
2009
2010
Global Network Services
Billed Business
CAGR 1999-2010:
32
($ in
billions)

33
2010 Investment Priorities
Focus on premium customers
Charge Card
Co-Brands
Drive network growth
Coverage / brand awareness
GNS partner volume
Alternative payments
Drive new revenues
by leveraging
our unique business model
Fee Based Revenue
34
Registered Card

35
Strategic Acquisitions*
*The Loyalty Partner acquisition is expected to close in the first quarter of 2011, subject to regulatory approval.
36
2010 Investment Priorities
Focus on premium customers
Charge Card
Co-Brands
Drive network growth
Coverage / brand awareness
GNS partner volume
Alternative payments
Drive new revenues
by leveraging
our unique business model


Growth Drivers
38
Drive greater value to merchant base
Expand customer segment penetration
Accelerate International growth across
businesses
Achieve significant progress within Enterprise
Growth
Increase share of online spend
and enhance
digital experience
For the Moderate to Long-term:
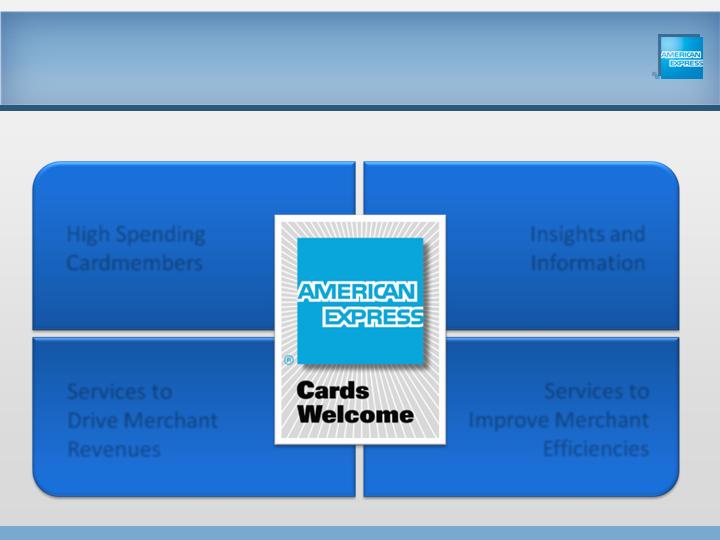
Insights and
Information
Services to
Improve Merchant
Efficiencies
High Spending
Cardmembers
Services to
Drive Merchant
Revenues
Drive Greater Merchant Value
39
Sources of Value

Penetrate New Customer Segments
40
Minorities
Under 35
Women
Prospect Segments
Cardmember
Base
Accelerate International Growth
New Payment Options
Diversity
Multiple Models
Global Player
41
Enterprise Growth Business Units
42
Online and Mobile
Emerging Payments and
New Ventures
Global Payment Options
Fee Based Services

Growth Drivers
43
Drive greater value to Merchant base
Expand customer segment penetration
Accelerate International growth across
businesses
Achieve significant progress within Enterprise
Growth
Increase share of online spend
and enhance
digital experience
For the Moderate to Long-term:
2009
2010
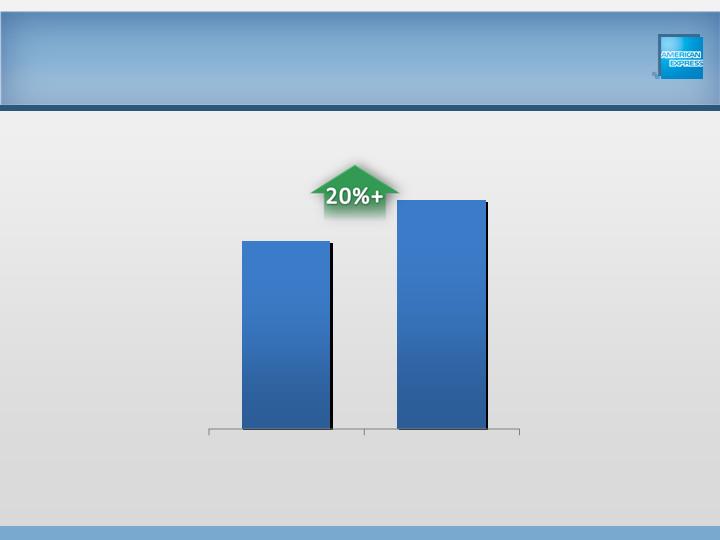
44
AXP Online Spend* – Global
$100B
+
*Primarily includes spending at pure online merchants and spending through known online channels for
merchants with both online and offline presence. Also
includes an estimate of online spend for merchants in industries where external and internal benchmarks around online spend are available.
Estimated
Spending:
Nov-Dec 2009
Nov-Dec 2010
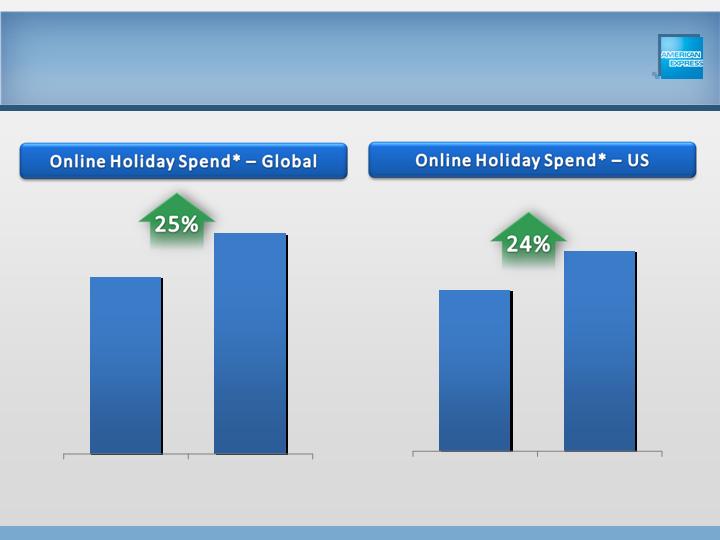
45
AXP Online Holiday Spend*
Nov-Dec 2009
Nov-Dec 2010
Estimated
Spending:
*Primarily includes spending at pure online merchants and spending through known online channels for
merchants with both online and offline presence. Also
includes an estimate of online spend for merchants in industries where external and internal benchmarks around online spend are available.

2009
2010
46
AXP Online Spend* – Global
$100B
+
Estimated
Spending:
*Primarily includes spending at pure online merchants and spending through known online channels for
merchants with both online and offline presence. Also
includes an estimate of online spend for merchants in industries where external and internal benchmarks around online spend are available.
47
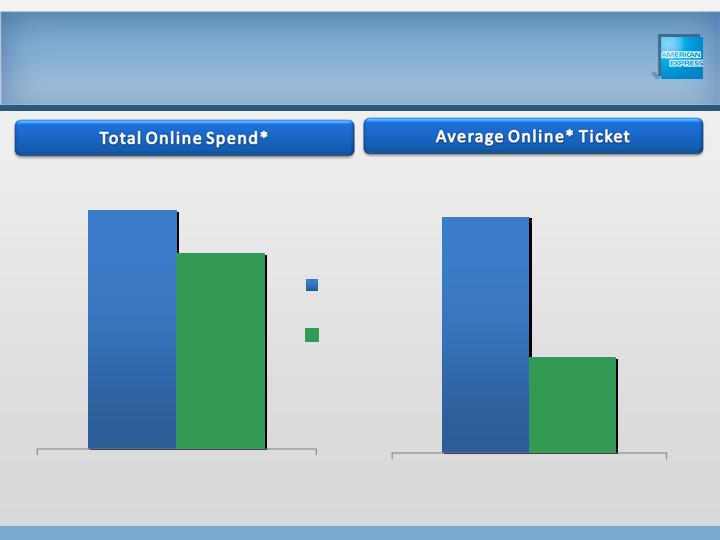
AXP vs. PayPal – Global
$100B+
$92B
2010
AXP
PayPal*
*
$156
$63
2010
*Primarily includes spending at pure online merchants and spending through known online channels for merchants with both online and offline presence. Also
includes an estimate of online spend
for merchants in industries where external and internal benchmarks around online spend are available. **Source: company
reports.
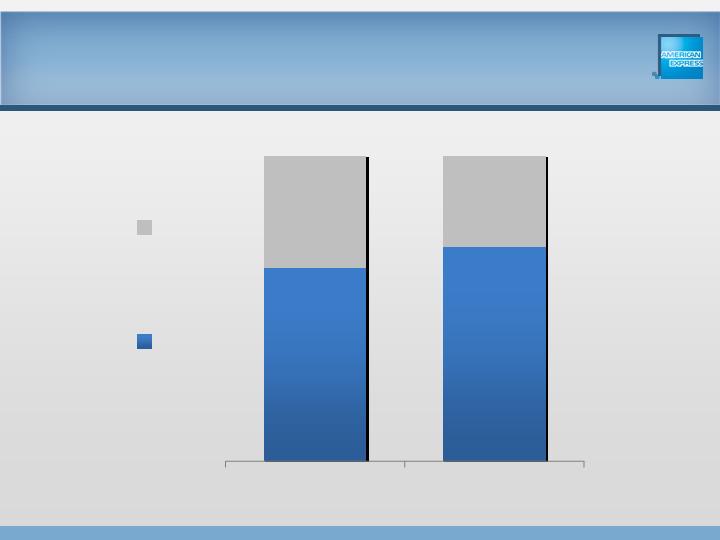
63%
70%
2009
2010
Offline
Online
48
Membership Rewards –
U.S. Online Point Redemptions

49
Membership Rewards:
A Virtual Currency
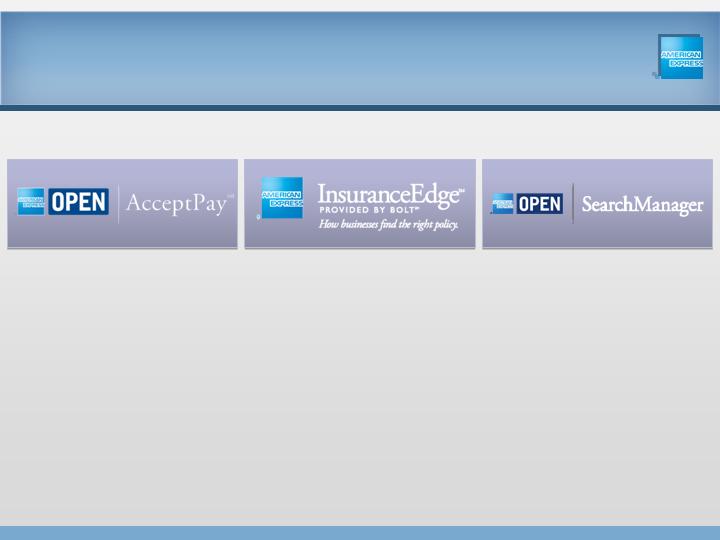
Small Business Solutions
50
Launched 2009
All-in-one online
invoicing and
payment
acceptance
solution
Launched 2010
Online tool to
compare and
purchase
commercial
insurance more
effectively
Launched 2010
Online solution to
manage search
engine marketing
OPEN Business Apps:
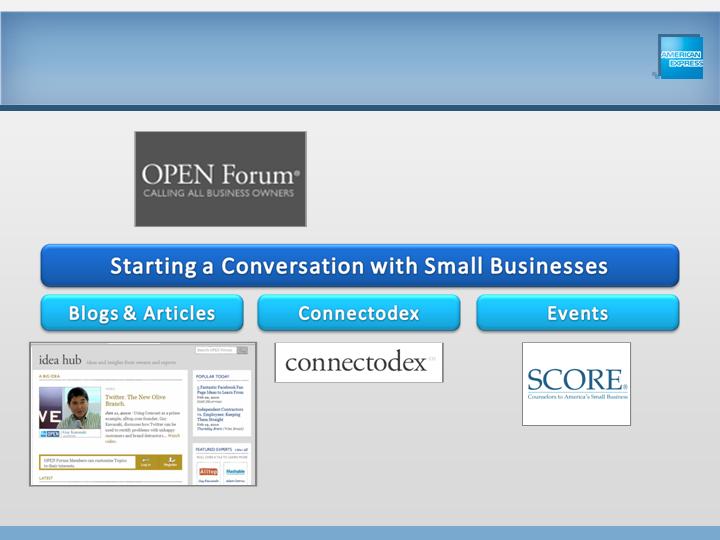
Small Business – OPEN Forum
51
SCORE Speed
Coaching
August 10, Orange County,
CA
Connecting
Cardmembers to
share insights and
build relationships
A community designed to help
small businesses grow
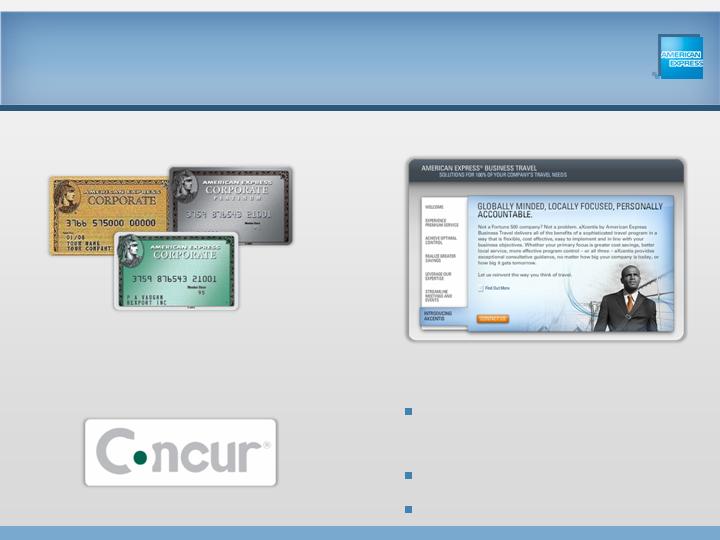
Corporations – Product
Evolution
52
B2B Payment
Solutions
Corporate Card
Programs
Global Business Travel
Corporate Purchasing
Card
Buyer Initiated Payments
vPayment
Integrated Online
Expense Management

Growth Drivers
53
Drive greater value to Merchant base
Expand customer segment penetration
Accelerate International growth across
businesses
Achieve significant progress within Enterprise
Growth
Increase share of online spend
and enhance
digital experience
For the Moderate to Long-term:
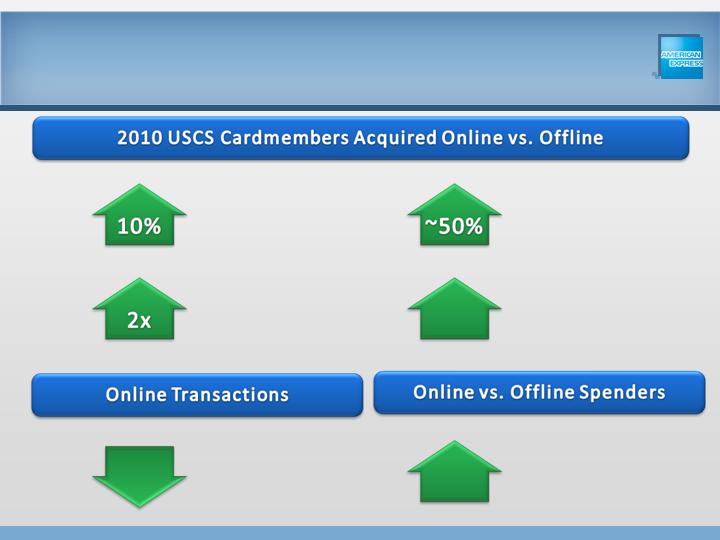
Profile: U.S. Online
Cardmembers
54
Household
Income
Under 35
Higher
Average
Spend
Online
Spending
Lower Credit
Losses
Enrollment in
Online
Servicing

Growth Drivers
55
Drive greater value to Merchant base
Expand customer segment penetration
Accelerate International growth across
businesses
Achieve significant progress within Enterprise
Growth
Increase share of online spend
and enhance
digital experience
For the Moderate to Long-term:


Success in 2010
Investing in Transformation
AXP: The International Story
Q & A
57
Agenda

American Express
Company
Financial Community
Meeting
Presentation of Doug Buckminster
President, International Consumer Card and Small
Business Services
February 9, 2011

Large and diverse footprint
Differentiated assets and capabilities
Flexibility to meet market conditions
Delivering strong growth
Accelerate momentum with growth
opportunities
Commitment to win a larger share of
International for AXP
59
AXP: The International Story

AXP Footprint in International
Performance in International
Growth Going Forward
60
Agenda
61
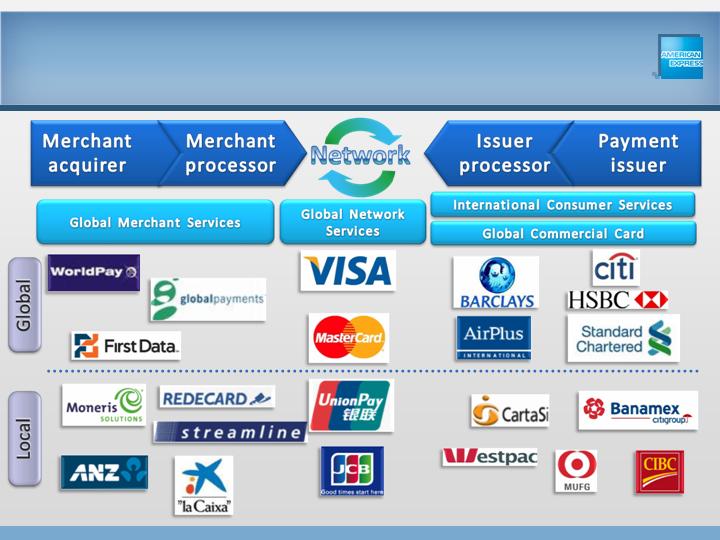
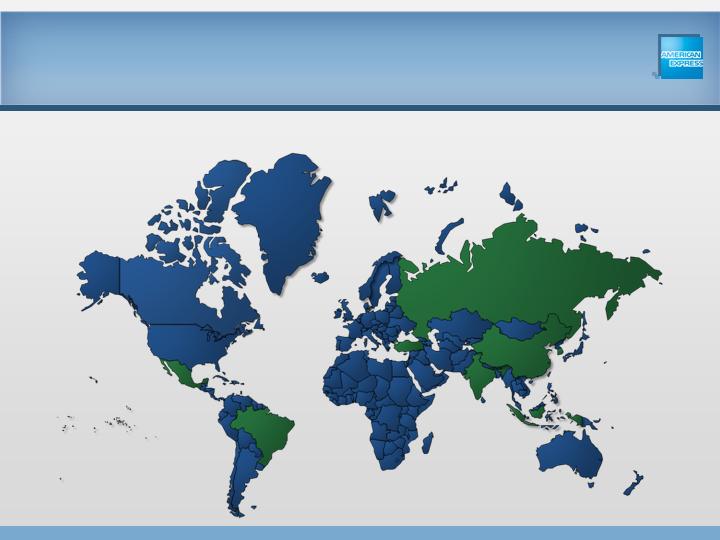
AXP International
Across the Payments Landscape
Note: The trademarks, logos and service marks used on this slide and throughout this presentation are the property of their respective owners.
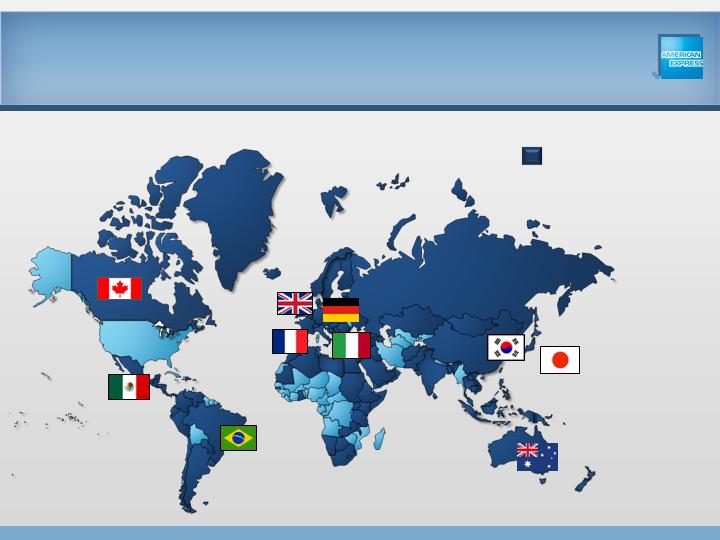
AXP Top Ten Markets by Billings, 2010
Global Presence: Over 130
Markets
62
AXP International
Markets
$0.0
$0.5
$1.0
$1.5
2006
2007
2008
2009
2010
International Business Operations*
Business Growth
$0
$50
$100
$150
$200
$250
2006
2007
2008
2009
2010
63
$ in billions, FX
Adjusted**:
CAGR 2006-2010:
CAGR 2006-2010:
Growth
vs. PY
(12%
)
(1%
)
25
%
54%
Growth
vs. PY
14%
11%
(2%
)
15
%
*International Business Operations (IBO) includes the ICS segment and the international portions of the GNMS and GCS segments. See Annex 5 for a
reconciliation to the geographic operations
footnote to be set forth in the Company’s 2010 consolidated financial statements. **FX adjusted information assumes
the average exchange rate in 2010 applies to all prior periods for purposes of currency translation into U.S. dollars. See Annex
6 for billed business reported
basis.
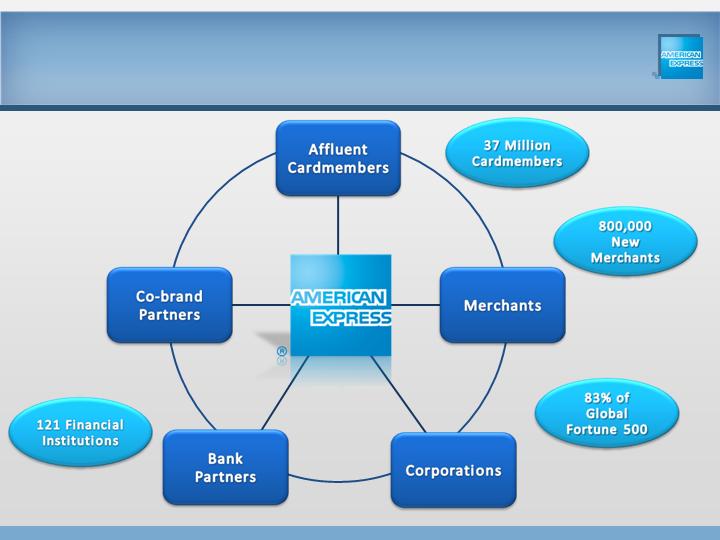
64
Strong Network of
Relationships
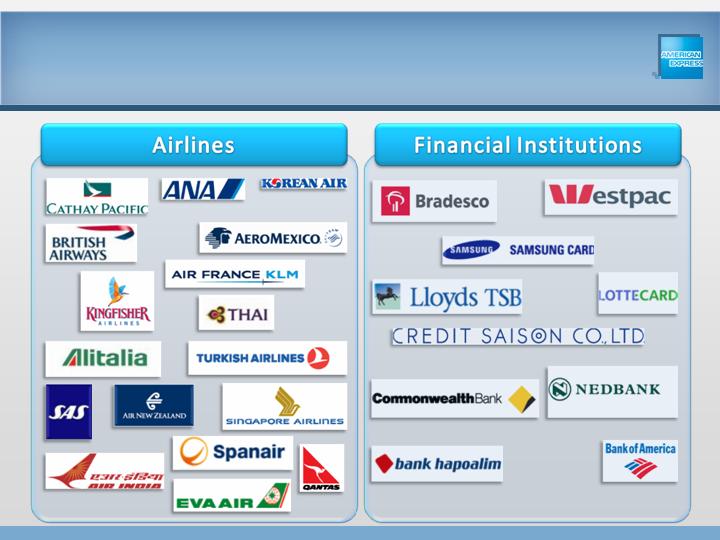
65
Partnership Excellence
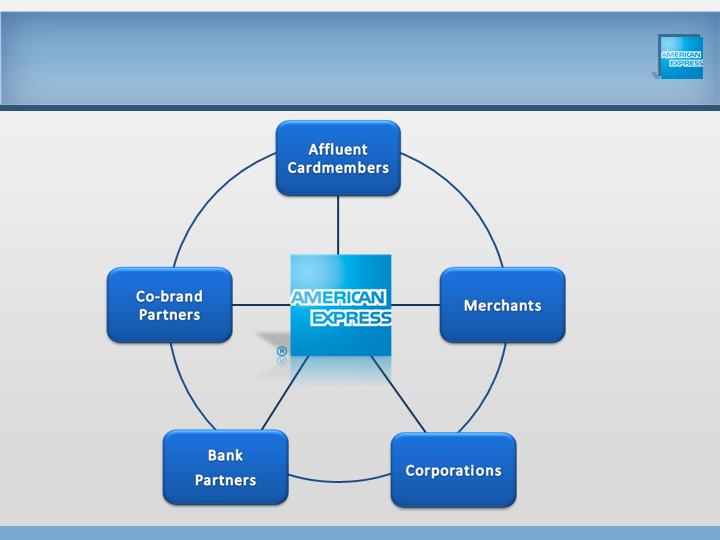
66
Strong Network of
Relationships

Brand
Loyalty
Marketing
Marketing
Analytics
Co-branding
67
Unique Capabilities and Assets
Relationship
Management
Customer
Service
Partnership
Management
Risk
Management
New Product
Development
Global
Platforms

AXP Footprint in International
Performance in International
Growth Going Forward
68
Agenda
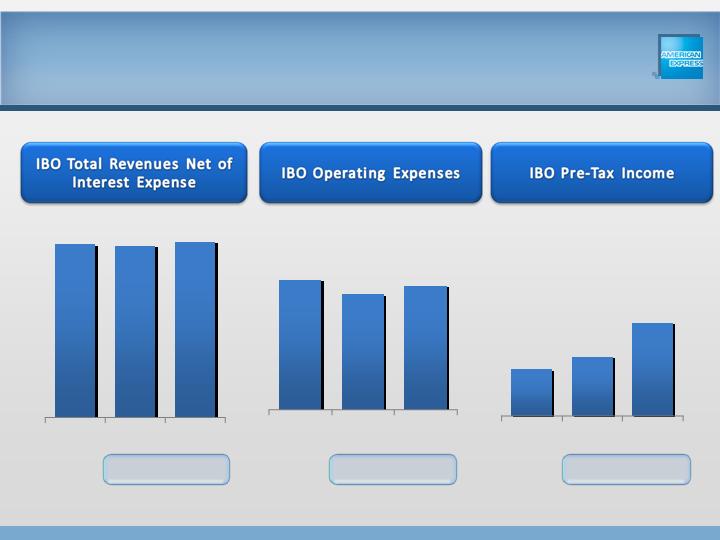
International Business Operations*
Financial
Performance
69
*International Business Operations (IBO) includes the ICS segment and the international portions of the GNMS and GCS segments. See Annex 5, 7 and 8 for a reconciliation to
the geographic operations
footnote to be set forth in the Company’s 2010 consolidated financial statements. **FX adjusted information assumes the average exchange rate in
2010 applies to all prior
periods for purposes of currency translation into U.S. dollars.
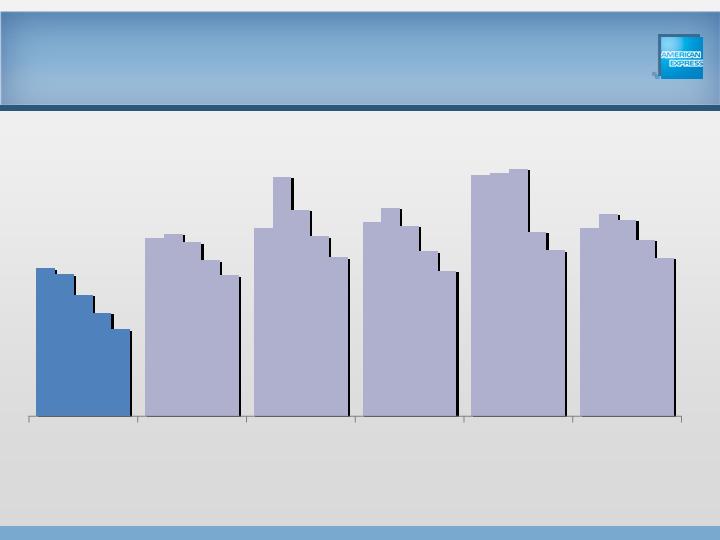
$4.7
$4.2
$4.5
2008
2009
2010
69
$0.7
$0.9
$
1.4
2008
2009
2010
$8.3
$8.2
$8.4
2008
2009
2010
($ in billions, FX
Adj.**)
(2%
)
3%
Growth
vs. PY
(10%
)
6%
25%
54
%
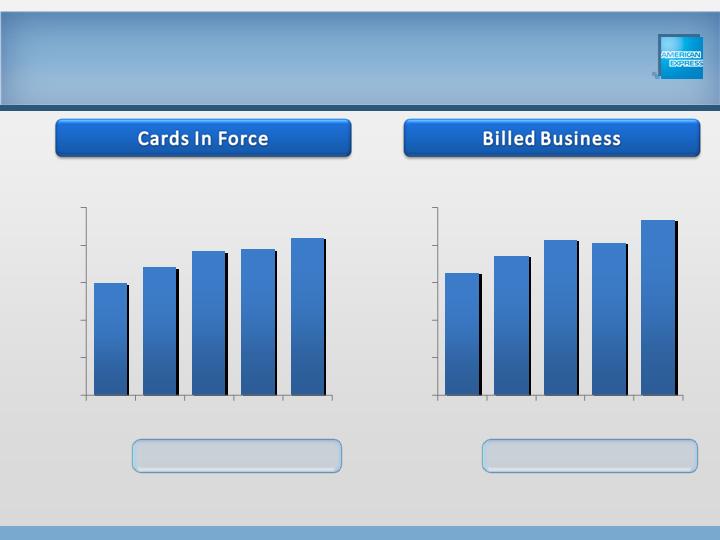
International Business Operations*
Cards in Force and Billed Business
$0
$50
$100
$150
$200
$250
2006
2007
2008
2009
2010
70
$ in billions, FX Adj.**
Growth
vs. PY
14%
11%
(2%)
15%
0
10
20
30
40
50
2006
2007
2008
2009
2010
Growth
vs. PY
14%
13%
2%
8%
millions
*International Business Operations (IBO) includes the ICS segment and the international portions of the GNMS and GCS segments. **
FX adjusted information
assumes the average exchange rate in 2010 applies to all prior periods for purposes of currency translation
into U.S. dollars. See Annex 6 for billed business
reported basis.
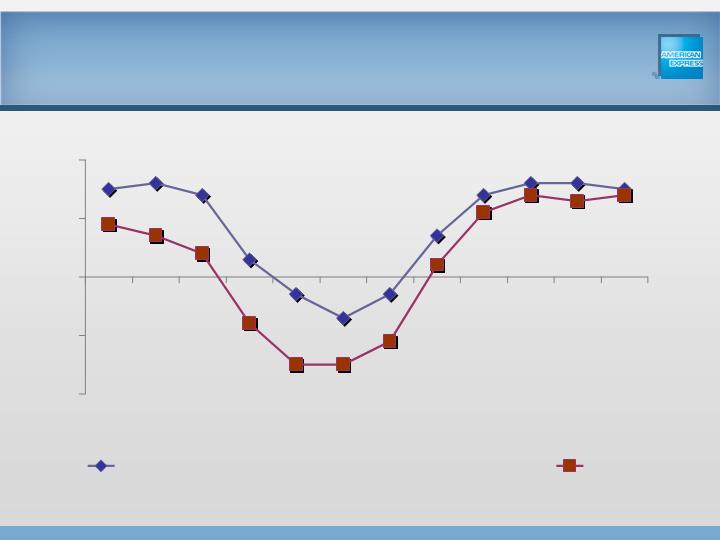
(20%)
(10%)
0%
10%
20%
Q1'08
Q3'08
Q1'09
Q3'09
Q1'10
Q3'10
International Business Operations (FX Adj.**)
U.S.
71
International Business Operations*
Billings Growth vs. U.S.
% increase/decrease vs. prior year:
Q4’10
*International Business Operations (IBO) includes the ICS segment and the international portions of the GNMS and GCS segments. **FX adjusted information
assumes a constant exchange rate between the periods being compared for purposes of currency translation into U.S. dollars. (e.g., assumes foreign exchange
rate used
for Q4’10 applies to Q4’09; the rate used for Q3’10 applies to Q3’09, etc.). See Annex 2
for reported basis.
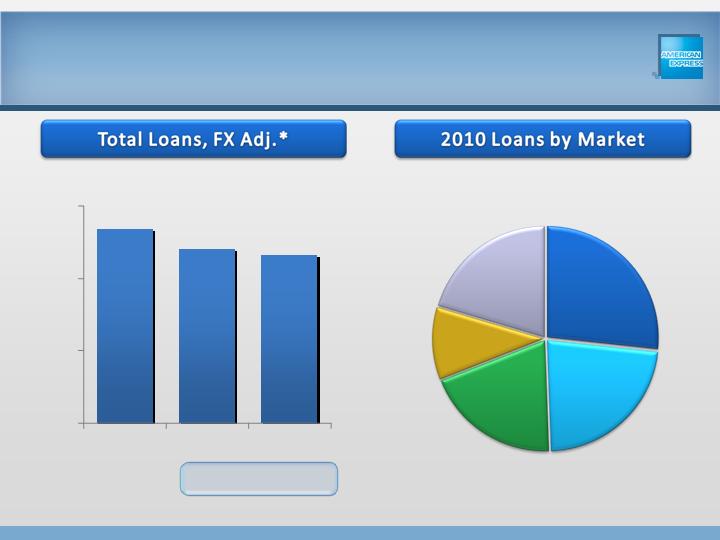
$10.7
$9.6
$9.3
$0.0
$4.0
$8.0
$12.0
2008
2009
2010
International Card Services
Segment
72
$ in billions
Growth
vs. PY
(10%
)
(3%)
Canada
$2.5B
Australi
a
$2.1B
UK
$1.8B
Other
$1.9B
Mexico
$1.0B
*FX adjusted information assumes the average exchange rate in 2010 applies to all prior periods for purposes of currency
translation into U.S. dollars. See
Annex 9 for reported basis.
73
International Card Services
Segment
0%
2%
4%
6%
8%
10%
12%
Q1 '08
Q3'08
Q1 '09
Q3'09
Q1 '10
Q3'10
ICS
USCS Managed*
*See Annex 3 for a reconciliation to GAAP basis for periods prior to 2010.
Q4’10
International and US:
Similarities
High Spending Customer base
Strong Credit Quality
Strong Co-Brand Practice
75
Strong Digital Engagement
International and US: Differences
76
Spend Velocity
Outbound Spend
Average Fee
Per Card
(Adj.)*
7x
5x
19%
2%
$68
$36
*Average fee per card is computed from proprietary card activities only. Average fee per card is computed based on net card fees, including the amortization of deferred direct
acquisition
costs, plus card fees included in interest and fees on loans (including related amortization of deferred direct acquisition costs), divided by average worldwide
proprietary cards-in-force. On a consolidated basis, the average fee per card and average fee
per card (adjusted) for 2010 was $38 and $41, respectively. The card fees related
to cardmember loans included in interest and fees on loans were $220 million for the year ended December 31, 2010 on a consolidated basis. The adjusted average
fee per
card is computed in the same manner, but excludes amortization of deferred direct acquisition costs (a portion of which is charge card related and included in net card fees and a
portion of which is lending related and included in interest and
fees on loans). The amount of amortization excluded was $207 million for the years ended December 31, 2010 on
a consolidated basis. The Company presents adjusted average fee per card because management believes that this metric presents
a useful indicator of card fee pricing across
a range of its proprietary card products. See the Supplemental Annex for GAAP basis.
FY’ 2010

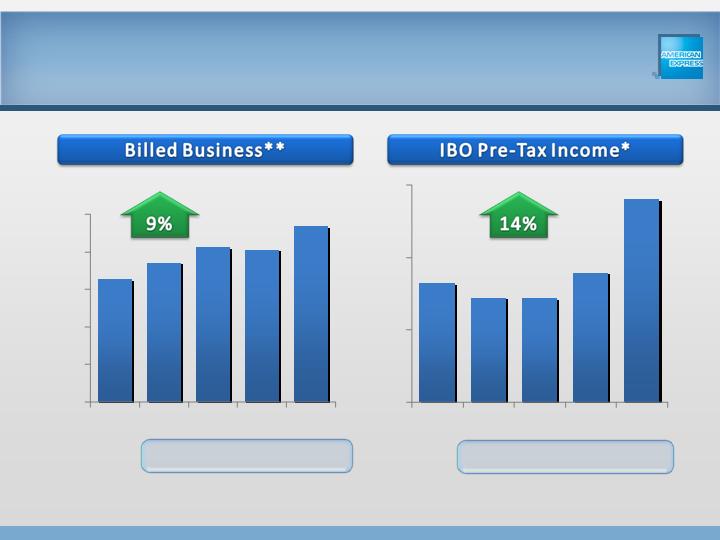
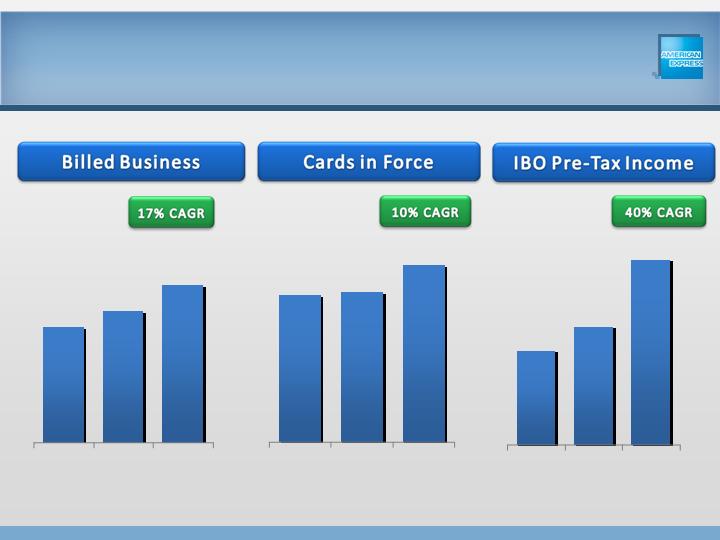
International Business Operations*
Regional Overview
Billed Business ($ in B)
Card in Force (in MM)
CAGR 2008-2010
CAGR 2008-2010
1%
$87.7
2%
14.2
77
12%
$85.5
13%
14.1
7%
$60.5
1%
13.8
IBO Pre-Tax Income ($ in MM)
CAGR 2008-2010
32%
$572
57%
$304
37%
$503
IBO Pre-Tax Income/Billed
Business
65bps
36bps
83bps
IBO Provision as % of Billed Business
15bps
17bps
31bps
*International Business Operations (IBO) includes the ICS segment and the international portions of the GNMS and GCS segments. See Annex 10 for a
reconciliation to the geographic operations
footnote to be set forth in the Company’s 2010 consolidated financial statements. **FX adjusted information
assumes the average exchange rate in 2010 applies to all prior periods for purposes of currency translation into U.S. dollars. On a reported
basis, the billed
business CAGR for 2008-2010 was (4%) for EMEA, 16% for JAPA and 6% for LACC.
FY’2010, FX
Adjusted**
78
Growth Markets
“Growth Markets“ include BRIC plus Turkey, Mexico, Indonesia and South
Korea
8.4
8.6
10.2
2008
2009
2010
International Business Operations*
Growth Market Performance
79
“Growth Markets“ include BRIC plus Turkey, Mexico, Indonesia and South
Korea
$203
$162
$318
2008
2009
2010
$28.7
$32.8
$39.2
2008
2009
2010
$ in
billions,
FX Adj.**
In millions
$ in
millions,
FX Adj.**
*International Business Operations (IBO) includes the ICS segment and the international portions of the GNMS and GCS segments. See Annex 5 for information relating to the
geographic footnote
to be set forth in the Company’s 2010 consolidated financial statements. **FX adjusted information assumes the average exchange rate in 2010 applies to
all prior periods
for purposes of currency translation into U.S. dollars. See Annex 6 for billed business on a reported basis.
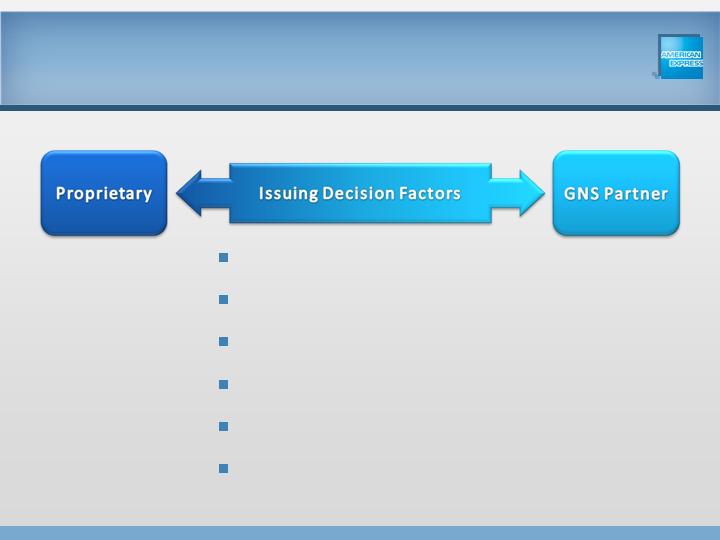
Flexible, Multi-Model Approach
80
Attractive Stable Margins
Large Affluent Segment
Strong Credit Bureau
Financial Institution Loyalty
Co-Brand Availability
Merchant Value
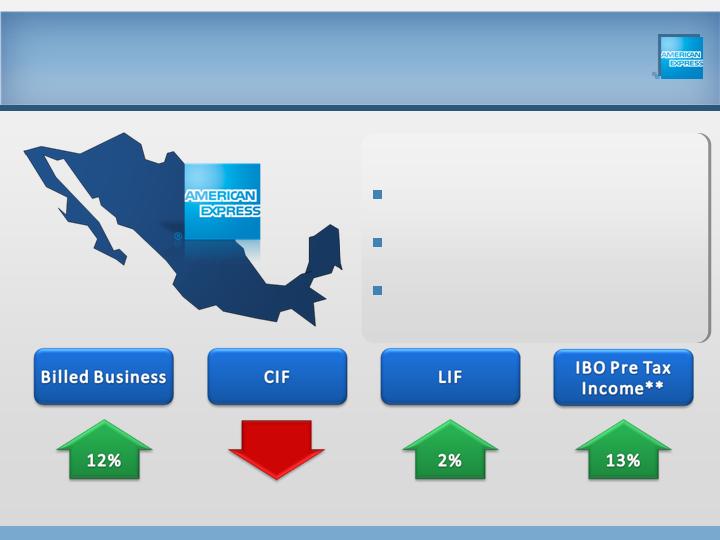
Mexico: High Growth
Proprietary Market
81
Highly Profitable
High Share of Spend
Strong Brand, Relevance
2006-10
CAGR,
FX Adj*:
(1%)
*FX adjusted information assumes the average exchange rate in 2010 applies to all prior periods for purposes of currency
translation into U.S. dollars. The CAGR for 2006 – 2010 for billed business
for Mexico was 8% on a reported basis. **International Business Operations (IBO) includes the ICS
segment and the international portions of the GNMS and GCS segments. Due to system
limitations related to geographic reporting prior to 2008, the Company is unable to identify the specific nature of the reconciling items relating to amounts previously reported
in the Company’s
financial statements and the IBO basis presentation. See Annex 5 and 10 for information relating to the geographic footnote to be set forth in the Company’s 2010 consolidated financial statements.
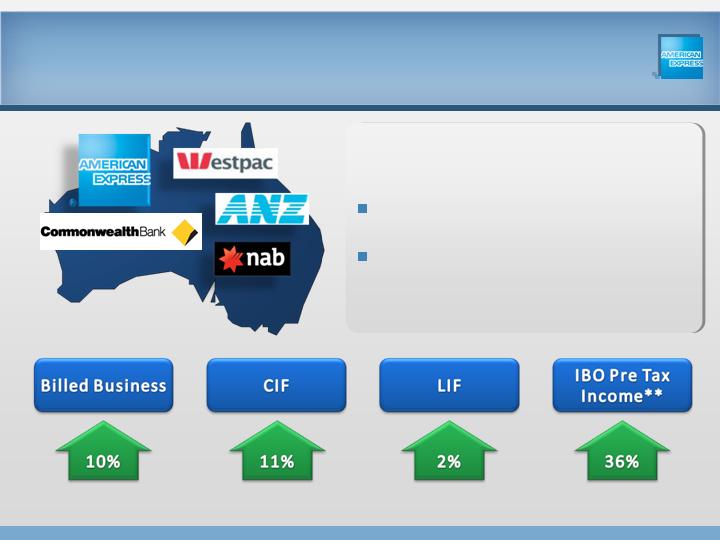
Australia: GNS and Proprietary
82
Large Affluent Segment
Strong Bank Concentration
2006-10
CAGR,
FX Adj*:
*FX adjusted information assumes the average exchange rate in 2010 applies to all prior periods for purposes of currency
translation into U.S. dollars. The CAGR for 2006 – 2010 for billed business for Australia was 16% on a
reported basis. **International Business Operations (IBO) includes the
ICS segment and the international portions of the GNMS and GCS segments. Due to system limitations related to geographic reporting prior to 2008, the
Company is unable to identify the specific nature of the reconciling items relating to amounts previously
reported in the Company’s financial statements and the IBO basis presentation. See Annex 5 and 10 for information relating
to the geographic footnote to be set forth in the Company’s 2010 consolidated financial statements.
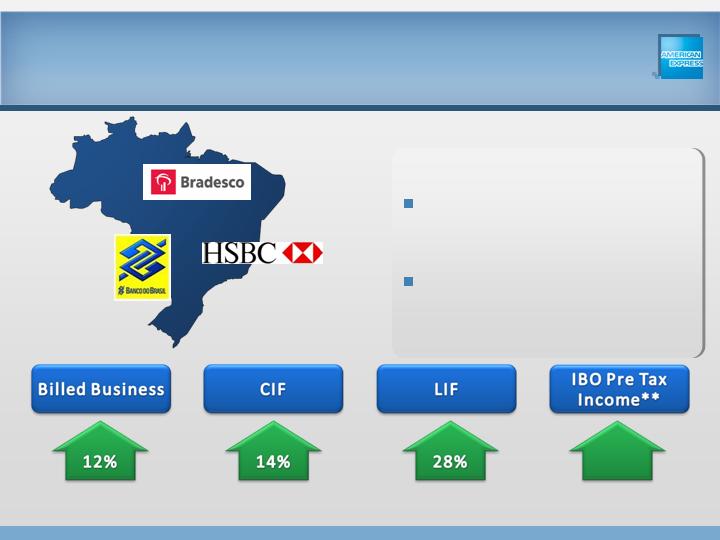
Brazil: Partnering for Growth
83
Strong bank distribution
– card & merchant
Relatively volatile
market
10%
Jul ‘05-Jun ’10*
CAGR,
FX Adj*:
*FX adjusted information assumes the average exchange rate in 2010 applies to all prior periods for purposes of currency
translation into U.S. dollars. The CAGR for Jul’05-Jun’10 for billed business for Brazil was 18% on a
reported basis. **International Business Operations (IBO) includes
the ICS segment and the international portions of the GNMS and GCS segments. Due to system limitations related to geographic reporting prior to 2008, the
Company is unable to identify the specific nature of the reconciling items relating to amounts previously
reported in the Company’s financial statements and the IBO basis presentation. See Annex 5 and 10 for information relating
to the geographic footnote to be set forth in the Company’s 2010 consolidated financial statements.

AXP Footprint in International
Performance in International
Growth Going Forward
84
Agenda
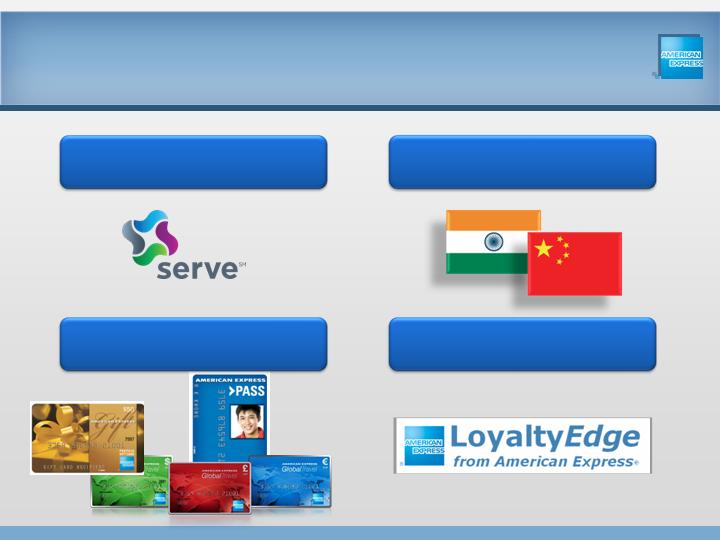
85
Growing International
Partnerships
85
Loyalty
New Segments
Alternative Payments
86
Growing International
Coverage & Utilization
Loyalty
Alternative Payments
Digital
Partnerships
86
New Segments
Fee Based Offerings
&
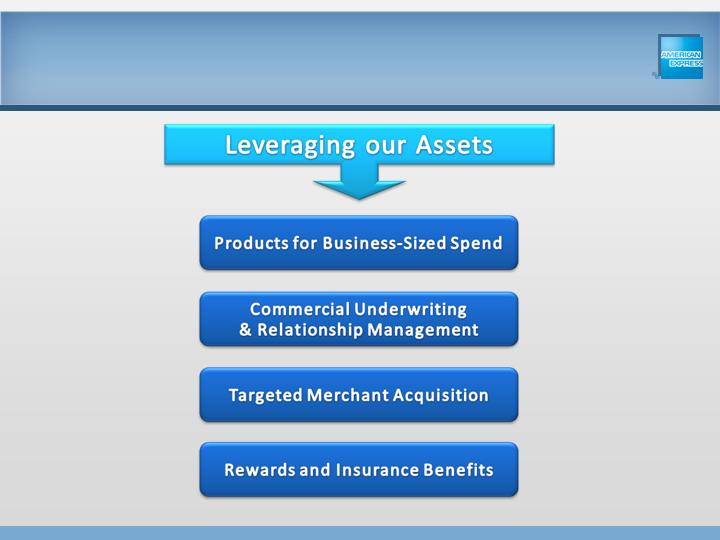
Small Business Services
87
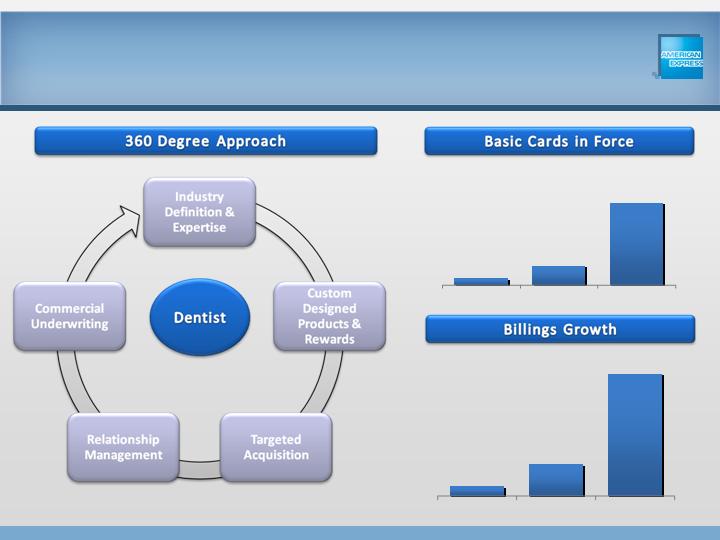
88
Dental Industry – Japan
2008
2009
2010
X
3X
12X
2008
2009
2010
4.2K
0.3K
89
Growth Through Partners
Help partners address high-end
segment through our unique expertise.
Increase size of business through
existing Bank and co-brand partners.
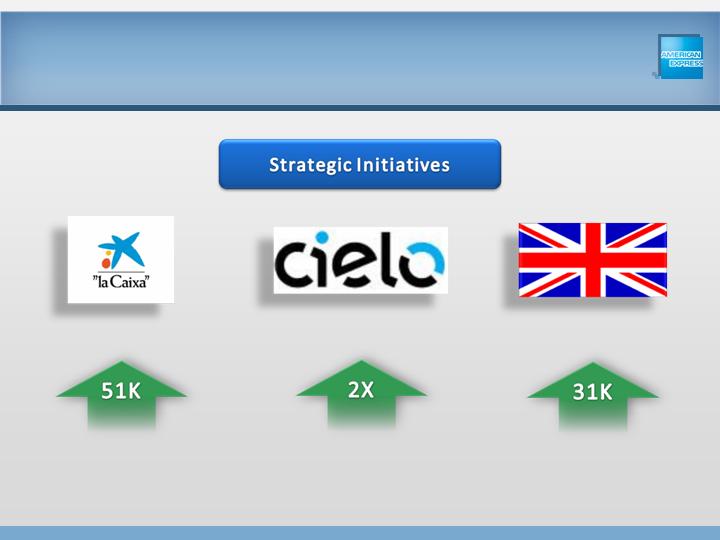
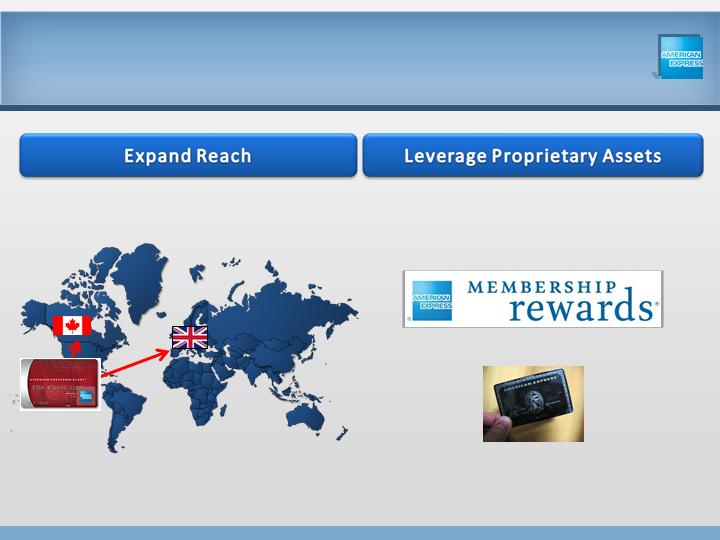
90
Expanding Merchant Coverage
Launched Sept 2010
Launched June 2010
Launched Nov 2010
91
Digitize the Business
In addition to meeting evolving customer needs, our
advancements in digital engagement create cost and
revenue opportunity.
Online Card Acquisition
Mobile Card Apps and
electronic wallet
Online Spend
Paperless statements
Online Servicing
Online Remittances
Deliver quality
service online
Provide channel of
choice for
Customers
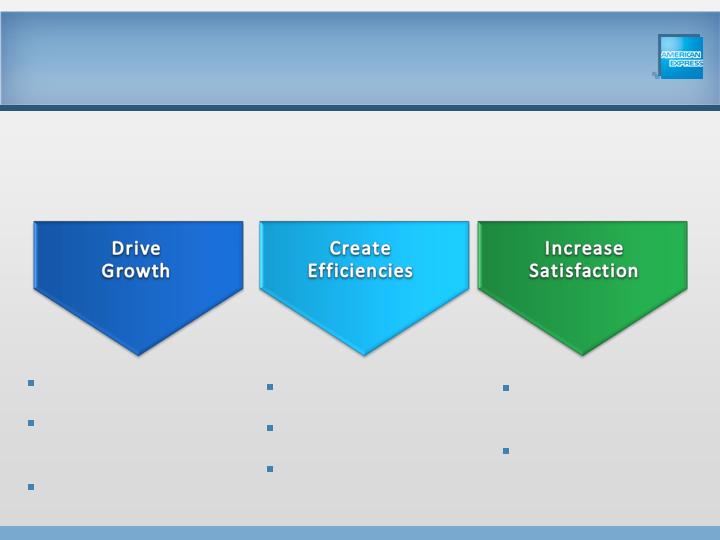
1.
Strengthen value and price for
value
2.
Innovative products for current
base
3.
Add new sources of revenue
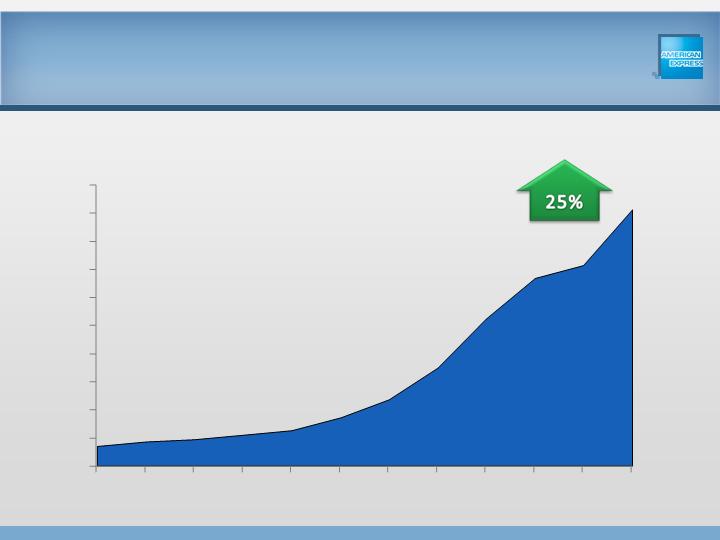
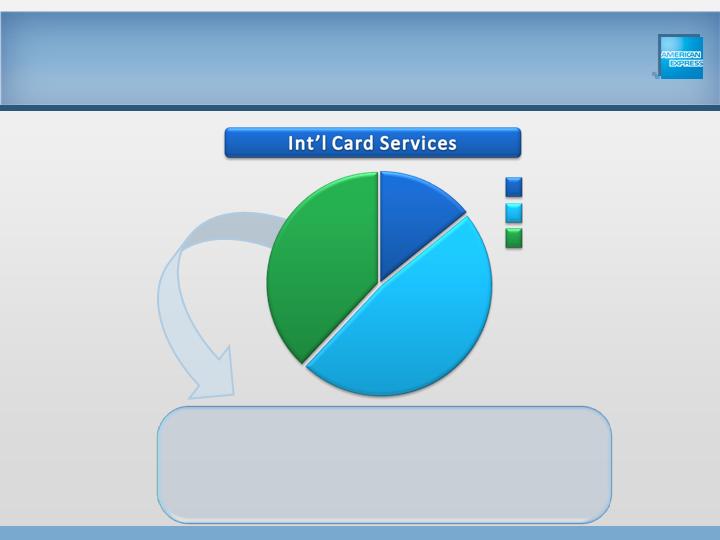
Fee Revenue Mix
92
21%
35%
44%
Net Card Fees & Other Revenue
Discount Revenue
Net Interest
Income
Why Loyalty Services?
93
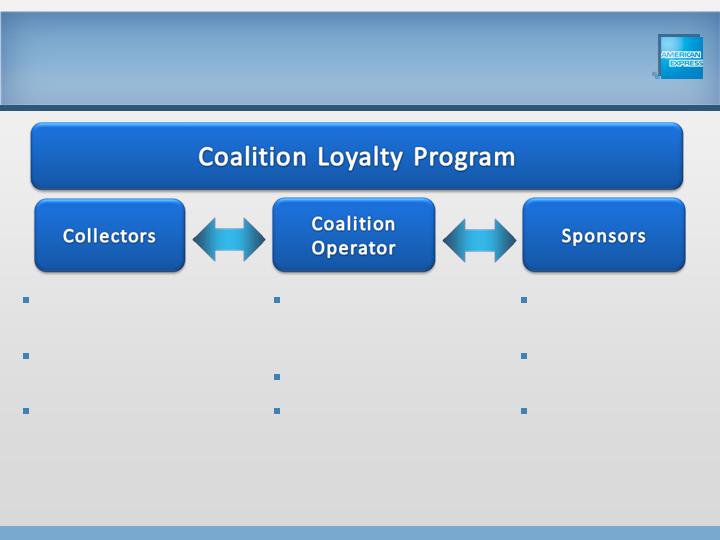
94
Coalition Loyalty Structure
Consolidate loyalty
programs
More earn
opportunities
Access to valuable
discounts and
offers
Gain new
customers
Higher consumer
spend
Increased loyalty /
reduced churn
Build relationships
with large
customer pool
Access to rich data
Facilitate
commerce across
coalition
Loyalty Partner Synergies
Creating value through:
Card Distribution
New Card Products
Membership Rewards
Online and digital
channels
Location-based offers
New Markets
Add 100M
Consumers
95

Large and diverse footprint
Differentiated assets and capabilities
Flexibility to meet market conditions
Delivering strong growth
Accelerate momentum with growth
opportunities
Commitment to win a larger share of
International for AXP
96
AXP: The International Story
