Attached files
| file | filename |
|---|---|
| EX-31.2 - Xinde Technology Co | v211150_ex31-2.htm |
| EX-31.1 - Xinde Technology Co | v211150_ex31-1.htm |
| EX-32.2 - Xinde Technology Co | v211150_ex32-2.htm |
| EX-32.1 - Xinde Technology Co | v211150_ex32-1.htm |
UNITED
STATES
SECURITIES
AND EXCHANGE COMMISSION
Washington,
D.C. 20549
FORM
10-Q
x QUARTERLY REPORT UNDER SECTION 13 OR
15(d) OF THE SECURITIES EXCHANGE ACT OF 1934
For
the quarterly period ended December 31, 2010
OR
o TRANSITION REPORT UNDER SECTION 13 OR
15(d) OF THE EXCHANGE ACT
For
the transition period from ______ to __________
COMMISSION
FILE NUMBER: 000-53672
XINDE TECHNOLOGY
COMPANY
(Exact
name of registrant as specified in its charter)
|
Nevada
|
20-812712
|
|
|
(State
or other jurisdiction of
incorporation
or organization)
|
(IRS
Employer
Identification
No.)
|
Number
363, Sheng Li West Street, Weifang, Shandong Province,
The
People’s Republic of China
(Address
of principal executive offices)
(011)
86-536-8322068
(Registrant’s
Telephone Number, Including Area Code)
Check
whether the issuer (1) has filed all reports required to be filed by Section 13
or 15(d) of the Exchange Act during the preceding 12 months (or for such shorter
period that the issuer was required to file such reports), and (2) has been
subject to such filing requirements for the past 90 days. Yes x No o
Indicate
by check mark whether the registrant has submitted electronically and posted on
its corporate Web site, if any, every Interactive Data File required to be
submitted and posted pursuant to Rule 405 of Regulation S-T (§232.405 of this
chapter) during the preceding 12 months (or for such shorter period that the
registrant was required to submit and post such
files). Yes o No
o
Indicate
by check mark whether the registrant is a large accelerated filer, an
accelerated filer, a non-accelerated filer or a smaller reporting company filer.
See definition of “accelerated filer” and “large accelerated filer” in
Rule 12b-2 of the Exchange Act (Check one):
|
Large
Accelerated Filer o
|
Accelerated
Filer o
|
Non-Accelerated
Filer o
|
Smaller
Reporting Company x
|
Indicate
by check mark whether the registrant is a shell company as defined in Rule 12b-2
of the Exchange Act. Yes o No x
State the
number of shares outstanding of each of the issuer’s classes of common equity,
as of the latest practicable date: As of February 11, 2011, the registrant
had 60,000,000 shares of common stock, par value $0.001 per share, issued and
outstanding.
TABLE
OF CONTENTS
|
PAGE
|
|
|
PART
I FINANCIAL INFORMATION
|
F-1
|
|
ITEM
1. FINANCIAL STATEMENTS
|
F-1
|
|
ITEM
2. MANAGEMENT’S DISCUSSION AND ANALYSIS OR PLAN OF
OPERATION
|
3
|
|
ITEM
3. QUANTITATIVE AND QUALITATIVE DISCLOSURES ABOUT MARKET
RISK
|
18
|
|
ITEM
4. CONTROLS AND PROCEDURES
|
18
|
|
PART
II OTHER INFORMATION
|
18
|
|
ITEM
1. LEGAL PROCEEDINGS
|
18
|
|
ITEM
1A. RISK FACTORS
|
19
|
|
ITEM
2. UNREGISTERED SALES OF EQUITY SECURITIES AND USE OF
PROCEEDS
|
19
|
|
ITEM
3. DEFAULTS UPON SENIOR SECURITIES
|
19
|
|
ITEM
4. (REMOVED AND RESERVED)
|
19
|
|
ITEM
5. OTHER INFORMATION
|
19
|
|
ITEM
6. EXHIBITS
|
19
|
|
SIGNATURES
|
21
|
|
EXHIBIT
31.1
|
|
|
EXHIBIT
31.2
|
|
|
EXHIBIT
32.1
|
|
|
EXHIBIT
32.2
|
- 1 -
XINDE
TECHNOLOGY COMPANY
AND
SUBSIDIARIES
CONTENTS
|
PAGES
|
F-1-F-2
|
CONDENSED
CONSOLIDATED BALANCE SHEETS AS OF DECEMBER 31, 2010 (UNAUDITED) AND JUNE
30, 2010
|
|
PAGES
|
F-3
|
CONDENSED
CONSOLIDATED STATEMENTS OF INCOME AND COMPREHENSIVE INCOME FOR
THE THREE AND SIX MONTHS ENDED DECEMBER 31, 2010 AND 2009
(UNAUDITED)
|
|
PAGES
|
F-4-F-5
|
CONDENSED
CONSOLIDATED STATEMENTS OF CASH FLOWS FOR THE SIX MONTHS ENDED DECEMBER
31, 2010 AND 2009 (UNAUDITED)
|
|
PAGES
|
F-6-F-24
|
NOTES
TO CONDENSED CONSOLIDATED FINANCIAL STATEMENTS FOR THE THREE AND SIX
MONTHS ENDED DECEMBER 31, 2010 AND 2009
(UNAUDITED)
|
- 2 -
PART
I FINANCIAL INFORMATION
ITEM
1. FINANCIAL STATEMENTS
XINDE
TECHNOLOGY COMPANY
AND
SUBSIDIARIES
CONDENSED
CONSOLIDATED BALANCE SHEETS
|
ASSETS
|
||||||||
|
December
31,
|
June
30,
|
|||||||
|
2010
|
2010
|
|||||||
|
(Unaudited)
|
||||||||
|
CURRENT
ASSETS
|
||||||||
|
Cash
and cash equivalents
|
$ | 2,911,401 | $ | 3,399,360 | ||||
|
Accounts
receivable, net of allowance for doubtful accounts of $335,060 and
$793,630
as of December 31, 2010 and June 30, 2010, respectively |
68,920,330 | 60,473,007 | ||||||
|
Inventories
|
14,450,349 | 5,584,317 | ||||||
|
Notes
receivable, including bank acceptance notes
|
4,026,283 | 628,133 | ||||||
|
Prepayments
for goods
|
5,170,271 | 3,822,120 | ||||||
|
Prepaid
expenses and other receivables
|
32,803 | 26,404 | ||||||
|
Due
from employees
|
36,756 | 131,400 | ||||||
|
Deferred
taxes
|
— | 47,448 | ||||||
|
Total
Current Assets
|
95,548,193 | 74,112,189 | ||||||
|
LONG-TERM
ASSETS
|
||||||||
|
Plant
and equipment, net
|
3,105,704 | 3,043,955 | ||||||
|
Land
use rights, net
|
937,038 | 948,504 | ||||||
|
Construction
in progress
|
728,925 | 685,222 | ||||||
|
Deposit
for land use right
|
384,948 | 373,821 | ||||||
|
Deferred
taxes
|
142,575 | 129,049 | ||||||
|
Total
Long-Term Assets
|
5,299,190 | 5,180,551 | ||||||
|
TOTAL
ASSETS
|
$ | 100,847,383 | $ | 79,292,740 | ||||
See
accompanying notes to condensed consolidated financial statements
F-1
XINDE
TECHNOLOGY COMPANY
AND
SUBSIDIARIES
CONDENSED
CONSOLIDATED BALANCE SHEETS
|
LIABILITIES AND
SHAREHOLDERS’ EQUITY
|
||||||||
|
December
31,
|
June
30,
|
|||||||
|
2010
|
2010
|
|||||||
|
(Unaudited)
|
||||||||
|
CURRENT
LIABILITIES
|
||||||||
|
Accounts
payable
|
$ | 5,121,746 | $ | 4,850,579 | ||||
|
Short-term
bank loans
|
1,966,182 | 2,878,712 | ||||||
|
Customer
deposits
|
779,976 | 497,206 | ||||||
|
Notes
payable, including related parties
|
1,632,031 | 1,014,987 | ||||||
|
Income
tax payable
|
6,449,705 | 4,990,163 | ||||||
|
Other
payables
|
1,063,228 | 1,041,766 | ||||||
|
Value
added tax payable
|
13,726,279 | 6,931,841 | ||||||
|
Due
to employees
|
60,415 | 98,550 | ||||||
|
Due
to related parties
|
302,446 | 413,136 | ||||||
|
Accrued
expenses
|
916,940 | 659,569 | ||||||
|
Deferred
taxes
|
309,820 | — | ||||||
|
Total
Current Liabilities
|
32,328,768 | 23,376,509 | ||||||
|
LONG—TERM
LIABILITIES
|
||||||||
|
Notes
payable to related parties
|
275,332 | 326,298 | ||||||
|
Total
Long-Term Liabilities
|
275,332 | 326,298 | ||||||
|
TOTAL
LIABILITIES
|
32,604,100 | 23,702,807 | ||||||
|
COMMITMENT
AND CONTINGENCIES
|
||||||||
|
SHAREHOLDERS’
EQUITY
|
||||||||
|
Common
stock, $0.001 par value; 160,000,000 shares authorized; 60,000,000
shares
issued and outstanding at December 31, 2010 and June 30, 2010, respectively |
60,000 | 60,000 | ||||||
|
Additional
paid-in capital
|
1,072,334 | 1,072,334 | ||||||
|
Retained
earnings (the restricted portion is $204,069 at December 31, 2010 and June
30, 2010)
|
60,964,536 | 50,131,203 | ||||||
|
Accumulated
other comprehensive income
|
6,146,413 | 4,326,396 | ||||||
|
TOTAL
SHAREHOLDERS’ EQUITY
|
68,243,283 | 55,589,933 | ||||||
|
TOTAL
LIABILITIES AND SHAREHOLDERS’ EQUITY
|
$ | 100,847,383 | $ | 79,292,740 | ||||
See
accompanying notes to condensed consolidated financial statements
F-2
XINDE
TECHNOLOGY COMPANY
AND
SUBSIDIARIES
CONDENSED CONSOLIDATED
STATEMENTS OF INCOME AND
COMPREHENSIVE
INCOME
(UNAUDITED)
|
Three
Months Ended
|
Six
Months Ended
|
|||||||||||||||
|
December
31, 2010
|
December
31, 2009
|
December
31, 2010
|
December
31, 2009
|
|||||||||||||
|
REVENUES,
NET
|
$ | 32,387,892 | $ | 35,750,798 | $ | 62,686,928 | $ | 73,367,699 | ||||||||
|
COST
OF GOODS SOLD
|
(25,710,389 | ) | (28,962,481 | ) | (51,367,591 | ) | (60,590,584 | ) | ||||||||
|
GROSS
PROFIT
|
6,677,503 | 6,788,317 | 11,319,337 | 12,777,115 | ||||||||||||
|
Selling
and marketing
|
(807,979 | ) | (849,851 | ) | (2,025,097 | ) | (1,282,423 | ) | ||||||||
|
General
and administrative
|
(260,016 | ) | (269,378 | ) | (773,331 | ) | (562,438 | ) | ||||||||
|
Bad
debt recoveries
|
480,454 | 74,968 | 662,974 | 74,909 | ||||||||||||
|
INCOME
FROM OPERATIONS
|
6,089,962 | 5,744,056 | 9,183,883 | 11,007,163 | ||||||||||||
|
Interest
expense, net
|
(62,140 | ) | (70,647 | ) | (203,895 | ) | (176,936 | ) | ||||||||
|
Other
income (expense), net
|
122,565 | 4,482 | 238,102 | (784 | ) | |||||||||||
|
Refunded
value added tax
|
— | — | 3,258,380 | — | ||||||||||||
|
INCOME
BEFORE INCOME TAXES
|
6,150,387 | 5,677,891 | 12,476,470 | 10,829,443 | ||||||||||||
|
INCOME
TAXES
|
(773,934 | ) | (961,736 | ) | (1,643,137 | ) | (1,688,892 | ) | ||||||||
|
NET
INCOME
|
5,376,453 | 4,716,155 | 10,833,333 | 9,140,551 | ||||||||||||
|
OTHER
COMPREHENSIVE INCOME (LOSS)
|
||||||||||||||||
|
Foreign
currency translation gain (loss)
|
846,213 | (837 | ) | 1,820,017 | 28,049 | |||||||||||
|
OTHER
COMPREHENSIVE INCOME (LOSS)
|
846,213 | (837 | ) | 1,820,017 | 28,049 | |||||||||||
|
COMPREHENSIVE
INCOME
|
$ | 6,222,666 | $ | 4,715,318 | $ | 12,653,350 | $ | 9,168,600 | ||||||||
|
WEIGHTED
AVERAGE SHARES OUTSTANDING BASIC AND DILUTED
|
60,000,000 | 42,782,609 | 60,000,000 | 42,391,304 | ||||||||||||
|
NET
INCOME PER COMMON SHARE, BASIC AND DILUTED
|
$ | 0.09 | $ | 0.11 | $ | 0.18 | $ | 0.22 | ||||||||
See
accompanying notes to the condensed consolidated financial
statements
F-3
XINDE
TECHNOLOGY COMPANY
AND
SUBSIDIARIES
CONDENSED CONSOLIDATED
STATEMENTS OF CASH FLOWS
(UNAUDITED)
|
Six
Months Ended
|
||||||||
|
December
31, 2010
|
December
31, 2009
|
|||||||
|
CASH
FLOWS FROM OPERATING ACTIVITIES:
|
||||||||
|
Net
income
|
$ | 10,833,333 | $ | 9,140,551 | ||||
|
Adjustments
to reconcile net income to net cash provided by operating
activities:
|
||||||||
|
Depreciation
and amortization
|
141,449 | 124,616 | ||||||
|
Provision
for doubtful accounts
|
188,804 | 121,955 | ||||||
|
Refunded
value added tax
|
(3,258,380 | ) | — | |||||
|
Deferred
taxes
|
343,742 | (8,314 | ) | |||||
|
Net
(gain) loss on settlement of accounts receivable and accounts payable for
fixed assets
|
(7,590 | ) | 61,633 | |||||
|
Changes
in operating assets and liabilities, net of effects of
acquisition:
|
||||||||
|
(Increase)
Decrease In:
|
||||||||
|
Accounts
receivable
|
(8,636,128 | ) | (809,078 | ) | ||||
|
Inventories
|
(8,866,033 | ) | (8,353,060 | ) | ||||
|
Prepayments
for goods
|
(1,348,151 | ) | 30,197 | |||||
|
Prepaid
expenses and other receivables
|
(6,398 | ) | (2,862 | ) | ||||
|
Due
from employees
|
94,643 | (214,668 | ) | |||||
|
Due
from related parties
|
— | (183,762 | ) | |||||
|
Increase
(Decrease) In:
|
||||||||
|
Accounts
payable
|
286,040 | 636,349 | ||||||
|
Value
added tax payable
|
10,052,818 | 12,188,453 | ||||||
|
Other
payables
|
21,462 | (680,197 | ) | |||||
|
Taxes
payable
|
1,459,542 | 1,693,117 | ||||||
|
Customer
deposits
|
282,770 | (88,477 | ) | |||||
|
Due
to employees
|
(38,135 | ) | (482,459 | ) | ||||
|
Due
to related parties
|
(110,689 | ) | (338,316 | ) | ||||
|
Accrued
expenses
|
257,372 | 289,574 | ||||||
|
Net
cash provided by operating activities
|
1,690,471 | 13,125,252 | ||||||
|
CASH
FLOWS FROM INVESTING ACTIVITIES:
|
||||||||
|
Purchases
of plant and equipment
|
(108,891 | ) | (96,197 | ) | ||||
|
Purchases
of construction in progress
|
(22,920 | ) | (682,561 | ) | ||||
|
Reverse
merger, net of cash acquired
|
— | 1,109 | ||||||
|
Repayment
of notes receivable
|
44,414,853 | 51,499,380 | ||||||
|
Issuance
of notes receivable
|
(47,738,078 | ) | (64,904,916 | ) | ||||
|
Net
cash used in investing activities
|
(3,455,036 | ) | (14,183,185 | ) | ||||
|
CASH
FLOWS FROM FINANCING ACTIVITIES:
|
||||||||
|
Proceeds
from short-term loans
|
743,641 | 2,923,558 | ||||||
|
Repayments
of short-term loans
|
(1,725,248 | ) | (2,335,923 | ) | ||||
|
Proceeds
from notes payable
|
654,601 | 1,527,559 | ||||||
|
Repayments
of notes payable
|
(137,201 | ) | (1,018,846 | ) | ||||
|
Repayments
of long-term debt
|
— | (101,597 | ) | |||||
|
Net
cash (used in) provided by financing activities
|
$ | (464,207 | ) | $ | 994,751 | |||
See
accompanying notes to condensed consolidated financial statements
F-4
XINDE
TECHNOLOGY COMPANY
AND
SUBSIDIARIES
CONDENSED CONSOLIDATED
STATEMENTS OF CASH FLOWS
(UNAUDITED)
|
Six
Months Ended
|
||||||||
|
December
31, 2010
|
December
31, 2009
|
|||||||
|
NET
DECREASE IN CASH AND CASH EQUIVALENTS
|
$ | (2,228,772 | ) | $ | (63,182 | ) | ||
|
Effect
of exchange rate changes on cash
|
1,740,813 | 55,205 | ||||||
|
Cash
and cash equivalents at beginning of period
|
3,399,360 | 127,576 | ||||||
|
CASH AND CASH EQUIVALENTS AT END OF
PERIOD
|
$ | 2,911,401 | 119,599 | |||||
|
SUPPLEMENTARY
CASH FLOW INFORMATION
|
||||||||
|
December
31, 2010
|
December
31, 2009
|
|||||||
|
Income
taxes paid
|
$ | 10,752 | $ | 9,712 | ||||
|
Interest
paid
|
$ | 155,489 | $ | 194,876 | ||||
SUPPLEMENTAL
NON-CASH DISCLOSURES:
|
1.
|
During
the six months ended December 31, 2010, accounts payable with an aggregate
carrying amount of $14,873 was settled by two fixed assets with a fair
value of $7,283, resulting in a gain of
$7,590.
|
|
2.
|
During
the six months ended December 31, 2009, accounts receivable with a
carrying amount of $523,317 was settled by a fixed asset with a fair value
of $95,016 and inventories with a fair value of $359,822, resulting in a
loss of $68,479.
|
|
3.
|
During
the six months ended December 31, 2009, accounts payable with a carrying
amount of $36,544 was settled by a fixed asset with a fair value of
$29,698, resulting in a gain of
$6,846.
|
|
4.
|
During
the six months ended December 31, 2009, $297,775 was transferred from
construction in progress to plant and
equipment.
|
See
accompanying notes to condensed consolidated financial statements
F-5
XINDE
TECHNOLOGY COMPANY
AND
SUBSIDIARIES
NOTES
TO CONDENSED CONSOLIDATED FINANCIAL STATEMENTS
FOR THE THREE AND SIX MONTHS
ENDED DECEMBER 31, 2010 AND 2009
(UNAUDITED)
NOTE 1 –
ORGANIZATION AND PRINCIPAL ACTIVITIES
Wasatch
Food Services, Inc., (“Wasatch”) was incorporated under the laws of the State of
Nevada on December 20, 2006 to engage as a franchisee of certain restaurants in
the State of Idaho through its wholly owned subsidiary, Wasatch Food Services of
Idaho, Inc. ("Bajio"). On April 22, 2010, Wasatch Food Services, Inc. changed
its name to Xinde Technology Company (“Xinde”). The
principal activities of the Company and its subsidiaries are the design,
development, manufacture, and commercialization of fuel injection pumps,
injectors, multi-cylinder diesel engines and small generator units for the
People’s Republic of China (the “PRC”) and overseas markets.
Details
of Xinde and its subsidiaries (the “Company”) as of December 31, 2010 are as
follows:
|
Name
|
Place
and Date of
Establishment/
Incorporation
|
Relationships
|
Principal
Activities
|
|||
|
Jolly
Promise Ltd. (“JPL”)
|
British
Virgin Island
July
2, 2008
|
Wholly-owned
subsidiary of Xinde
|
Investment
holding company
|
|||
|
H.K.
Sindhi Fuel Injection Co., Ltd (“HKSIND”)
|
Hong
Kong, PRC,
June
7, 2004
|
Wholly-owned
subsidiary of JPL
|
Investment
holding company
|
|||
|
Weifang
Huajie Fuel Injection Co., Ltd.
(“Huajie”)
|
Shandong,
PRC
October.
24 2009
|
Wholly-owned
subsidiary of HKSIND
|
Investment
holding company
|
|
Weifang
Xinde Fuel Injection System Co., Ltd.
(“Weifang
Xinde”)
|
Shandong,
PRC
October
29, 2007
|
Wholly-owned
subsidiary of Huajie
|
Investment
holding company
|
|||
|
Weifang
Hengyuan Oil Pump & Oil Fitting Co., Ltd.
("Hengyuan")
|
Shandong,
PRC,
December
21, 2001
|
Wholly-owned
subsidiary of Weifang Xinde
|
Design,
development, manufacture, and commercializing of fuel injection pump,
diesel fuel injection systems and injectors
|
|||
|
Weifang
Jinma Diesel Engine Co., Ltd. (“Jinma”)
|
Shandong,
PRC
December
19, 2003
|
Wholly-owned
subsidiary of Weifang Xinde
|
Manufacture
and sale of multi-cylinder diesel engine and small generating
units
|
|||
|
Weifang
Huaxin Diesel Engine Co., Ltd. (“Huaxin”)
|
Shandong,
PRC
October
20, 2003
|
Wholly-owned
subsidiary of Weifang Xinde
|
Manufacture
and sale of multi-cylinder diesel engine and small generating
units
|
|||
Inter-company
accounts and transactions have been eliminated in consolidation.
NOTE 2 – BASIS OF
PRESENTATION
The
Company’s unaudited condensed consolidated financial statements as of December
31, 2010 and for the three and six months ended December 31, 2010 and 2009 have
been prepared in accordance with generally accepted accounting principles for
interim financial information and pursuant to the requirements for reporting on
Rule 8-03 of Regulation S-X. Accordingly, they do not include all the
information and footnotes required by accounting principles generally accepted
in the United States of America for complete financial statements.
However,
such information reflects all adjustments (consisting solely of normal recurring
adjustments), which are, in the opinion of management, necessary for the fair
presentation of the condensed consolidated financial position and the condensed
consolidated results of operations. Results shown for interim periods are not
necessarily indicative of the results to be obtained for a full year. The
condensed consolidated balance sheet information as of June 30, 2010 was derived
from the audited consolidated financial statements included in the Form 10-K.
These interim condensed consolidated financial statements should be read in
conjunction with that report.
F-6
XINDE
TECHNOLOGY COMPANY
AND
SUBSIDIARIES
NOTES
TO CONDENSED CONSOLIDATED FINANCIAL STATEMENTS
FOR THE THREE AND SIX MONTHS
ENDED DECEMBER 31, 2010 AND 2009
(UNAUDITED)
NOTE 3 – USE OF
ESTIMATES
The
preparation of financial statements in conformity with generally accepted
accounting principles in the United States requires management to make estimates
and assumptions that affect the reported amounts of assets and liabilities and
disclosure of contingent assets and liabilities at the date of the condensed
consolidated financial statements, and the reported amounts of revenue and
expenses during the reporting period. Management makes these estimates using the
best information available at the time the estimates are made; however actual
results when ultimately realized could differ from those estimates.
NOTE 4 – SUMMARY OF
SIGNIFICANT ACCOUNTING POLICIES
|
(a)
|
Economic
and Political Risks
|
The
Company’s operations are conducted in the PRC. Accordingly, the Company’s
business, financial condition and results of operations may be influenced by the
political, economic and legal environment in the PRC, and by the general state
of the PRC economy.
The
Company’s operations in the PRC are subject to special considerations and
significant risks not typically associated with companies in North America and
Western Europe. These include risks associated with, among others, the
political, economic and legal environment and foreign currency exchange. The
Company’s results may be adversely affected by changes in the political and
social conditions in the PRC, and by changes in governmental policies with
respect to laws and regulations, anti-inflationary measures, currency
conversion, remittances abroad, and rates and methods of taxation, among other
things.
F-7
XINDE
TECHNOLOGY COMPANY
AND
SUBSIDIARIES
NOTES
TO CONDENSED CONSOLIDATED FINANCIAL STATEMENTS
FOR THE THREE AND SIX MONTHS
ENDED DECEMBER 31, 2010 AND 2009
(UNAUDITED)
NOTE
4 – SUMMARY OF SIGNIFICANT ACCOUNTING POLICIES (CONTINUED)
|
(b)
|
Fair
Value of Financial Instruments
|
ASC
820-10, Fair Value Measurements, establishes a three-tier fair value
hierarchy, which prioritizes the inputs used in measuring fair value. The
hierarchy prioritizes the inputs into three levels based on the extent to which
inputs used in measuring fair value are observable in the market.
These
tiers include:
•
Level 1—defined as observable inputs such as quoted prices in active
markets;
•
Level 2—defined as inputs other than quoted prices in active markets that
are either directly or indirectly observable; and
•
Level 3—defined as unobservable inputs in which little or no market data
exists, therefore requiring an entity to develop its own
assumptions.
The
assets measured at fair value on a recurring basis subject to the disclosure
requirements of ASC 820-10 as of December 31, 2010 are as follows:
|
Fair Value Measurements at Reporting Date
Using
|
||||||||||||||||
|
Carrying
Value as of
December
31, 2010
|
Quoted
Prices in
Active
Markets
for
Identical
Assets
(Level
1)
|
Significant
Other
Observable
Inputs
(Level
2)
|
Significant
Unobservable
Inputs
(Level
3)
|
|||||||||||||
|
Bank
acceptance notes
|
$ | 3,875,855 | $ | 3,875,855 | $ | — | $ | — | ||||||||
|
Long-term
notes payable
|
$ | 275,332 | — | $ | 275,332 | $ | — | |||||||||
The
carrying amounts of financial assets and liabilities, such as cash and cash
equivalents, accounts receivable, notes receivable, prepayments for goods,
short-term bank loans, accounts payable, customer deposits, short-term notes
payable, due to employee, due to related parties and other payables, approximate
their fair values because of the short maturity of these instruments. The fair
value of the Company’s long-term notes payable is estimated based on the current
rates offered to the Company for debt of similar terms and maturities. Under
this method, the Company’s fair value of long-term notes payable was not
significantly different from the carrying value at December 31,
2010.
|
(c)
|
Cash
and Cash Equivalents
|
For
financial reporting purposes, the Company considers highly liquid investments
purchased with original maturity of three months or less to be cash
equivalents.
F-8
XINDE
TECHNOLOGY COMPANY
AND
SUBSIDIARIES
NOTES
TO CONDENSED CONSOLIDATED FINANCIAL STATEMENTS
FOR THE THREE AND SIX MONTHS
ENDED DECEMBER 31, 2010 AND 2009
(UNAUDITED)
NOTE
4 – SUMMARY OF SIGNIFICANT ACCOUNTING POLICIES (CONTINUED)
|
(d)
|
Inventories
|
Inventories
are stated at the lower of cost or net realizable value. The cost of raw
materials is determined on the basis of weighted average. The cost of finished
goods is determined on the weighted average basis and comprises direct
materials, direct labor and an appropriate proportion of overhead.
Net
realizable value is based on estimated selling prices less any further costs
expected to be incurred for completion and disposal.
|
(e)
|
Prepayments
|
Prepayments
represent cash paid in advance to suppliers for purchases of raw
materials.
|
(f)
|
Plant
and Equipment
|
Plant and
equipment are carried at cost less accumulated depreciation and amortization.
Depreciation is provided over their estimated useful lives, using the
straight-line method. Leasehold improvements are amortized over the life of the
asset or the term of the lease, whichever is shorter. Estimated
useful lives are as follows:
|
Buildings
|
30
years
|
|
Machinery
|
10
years
|
|
Motor
vehicles
|
5
years
|
|
Office
equipment
|
5
years
|
The cost
and related accumulated depreciation of assets sold or otherwise retired are
eliminated from the accounts and any gain or loss is included in the statement
of income. The cost of maintenance and repairs is charged to expense as
incurred, whereas significant renewals and betterments are
capitalized.
|
(g)
|
Construction
in Progress
|
Construction
in progress represents direct costs of construction or the acquisition cost of
buildings or machinery and design fees. Capitalization of these costs ceases and
the construction in progress is transferred to plant and equipment when
substantially all the activities necessary to prepare the assets for their
intended use are completed. No depreciation is provided until the assets are
completed and ready for their intended use.
|
(h)
|
Land
Use Rights
|
According
to the laws of China, land in the PRC is owned by the government and cannot be
sold to an individual or company. However, the government grants the user
a “land use right” to use the land. The land use right granted to the
Company is being amortized using the straight-line method over the lease term of
fifty years.
F-9
XINDE
TECHNOLOGY COMPANY
AND
SUBSIDIARIES
NOTES
TO CONDENSED CONSOLIDATED FINANCIAL STATEMENTS
FOR THE THREE AND SIX MONTHS
ENDED DECEMBER 31, 2010 AND 2009
(UNAUDITED)
NOTE
4 – SUMMARY OF SIGNIFICANT ACCOUNTING POLICIES (CONTINUED)
|
(i)
|
Impairment
of Long-Term Assets
|
Long-term
assets of the Company are reviewed annually as to whether their carrying value
has become impaired, pursuant to the guidelines established in ASC
360-10. The Company considers assets to be impaired if the carrying value
exceeds the future projected cash flows from the related operations. The
Company also re-evaluates the periods of amortization to determine whether
subsequent events and circumstances warrant revised estimates of useful lives.
There was no impairment for the six months ended December 31, 2010 and
2009.
|
(j)
|
Revenue
Recognition
|
Revenue
represents the invoiced value of goods sold, recognized upon the shipment of
goods to customers. Revenue is recognized when all of the following criteria are
met:
-
Persuasive evidence of an arrangement exists,
-
Delivery has occurred or services have been rendered,
- The
seller's price to the buyer is fixed or determinable, and
-
Collectability is reasonably assured.
The
majority of the Company’s revenue results from sales contracts with distributors
and revenue are recorded upon the shipment of goods. Management conducts credit
background checks for new customers as a means to reduce the subjectivity of
collectability.
The
Company offers warranties on its products for periods between six and twelve
months after the sale. The Company estimates the warranty reserves based on
historical records and identical or similar types on the market. Warranty
expenses related to product sales are charged to the condensed consolidated
statements of income and comprehensive income in the period in which sales is
recognized. During the six months ended December 31, 2010 and 2009,
warranty expense was $281,144 and $77,765, respectively, and is included in
selling and marketing expenses in the accompanying condensed consolidated
statements of income and comprehensive income.
|
(k)
|
Retirement
Benefits
|
Retirement
benefits in the form of contributions under defined contribution retirement
plans to the relevant authorities are charged to expense as incurred. The
retirement benefits expense for the six months ended December 31, 2010 and
2009 are $15,105 and $11,070, respectively. All the retirement benefits expenses
are included in general and administrative expenses.
F-10
XINDE
TECHNOLOGY COMPANY
AND
SUBSIDIARIES
NOTES
TO CONDENSED CONSOLIDATED FINANCIAL STATEMENTS
FOR THE THREE AND SIX MONTHS
ENDED DECEMBER 31, 2010 AND 2009
(UNAUDITED)
NOTE
4 – SUMMARY OF SIGNIFICANT ACCOUNTING POLICIES (CONTINUED)
|
(l)
|
Foreign
Currency Translation
|
The
accompanying condensed consolidated financial statements are presented in United
States dollars. The functional currency of the Company is the Renminbi (RMB).
Capital accounts of the condensed consolidated financial statements are
translated into United States dollars from RMB at their historical exchange
rates when the capital transactions occurred. Assets and liabilities are
translated at the exchange rates as of balance sheet date. Income and
expenditures are translated at the average exchange rate of the
quarter.
|
December
31,
2010
|
June
30,
2010
|
December
31,
2009
|
||||||||||
|
Period
ended RMB: US$ exchange rate
|
6.6118 | 6.8086 | — | |||||||||
|
Average
RMB: US$ exchange rate for three months ended
|
6.6670 | — | 6.8360 | |||||||||
|
Average
RMB: US$ exchange rate for six months ended
|
6.7237 | — | 6.8386 | |||||||||
The RMB
is not freely convertible into foreign currency and all foreign exchange
transactions must take place through authorized institutions. No representation
is made that the RMB amounts could have been, or could be, converted into US$ at
the rates used in translation.
|
(m)
|
Comprehensive
Income
|
Comprehensive
income is defined to include all changes in equity except those resulting from
investments by owners and distributions to owners. Among other disclosures, all
items that are required to be recognized under current accounting standards as
components of comprehensive income are required to be reported in a financial
statement that is presented with the same prominence as other financial
statements. Comprehensive income includes net income and the foreign currency
translation gain.
|
(n)
|
Earnings
Per Share
|
Basic
earnings per share are computed by dividing income available to common
shareholders by the weighted-average number of common shares outstanding during
the period. Diluted earnings per share is computed similar to basic earnings per
share except that the denominator is increased to include the number of
additional common shares that would have been outstanding if the potential
common shares had been issued and if the additional common shares were dilutive.
There were no potentially dilutive securities for the six months ended December
31, 2010 and 2009.
|
(o)
|
Segment
and Geographic Reporting
|
The
Company operates in one business segment, the design, development, manufacture,
and commercialization of fuel injection pumps, injectors, multi-cylinder diesel
engines and small generator units mainly in the PRC. The sales of the Company
outside of the PRC were insignificant for the six months ended December 31, 2010
and 2009.
F-11
XINDE
TECHNOLOGY COMPANY
AND
SUBSIDIARIES
NOTES
TO CONDENSED CONSOLIDATED FINANCIAL STATEMENTS
FOR THE THREE AND SIX MONTHS
ENDED DECEMBER 31, 2010 AND 2009
(UNAUDITED)
NOTE
4 – SUMMARY OF SIGNIFICANT ACCOUNTING POLICIES (CONTINUED)
|
(p)
|
Recent
Accounting Pronouncements
|
There are
no new accounting pronouncements that have not been adopted by the Company that
would have a material effect on the condensed consolidated financial
statements.
NOTE 5 –
CONCENTRATIONS
|
(a)
|
Customers
|
No
customer accounted for more than 5% of total sales or accounts receivable as of
December 31, 2010 and June 30, 2010 and for the three and six months ended
December 31, 2010 and 2009.
|
(b)
|
Suppliers
|
The
Company’s major suppliers accounted for the following percentages of total
purchases and accounts payable as follows:
|
Purchases
Six
Months Ended
December
31,
|
Accounts
Payable
|
|||||||||||
|
Major
Suppliers
|
2010
|
2009
|
December
31, 2010
|
June
30, 2010
|
||||||||
|
Company
A
|
10.1%
|
0.9%
|
7%
|
1.7%
|
||||||||
|
Company
B
|
5.4%
|
1.1%
|
4.3%
|
1.4%
|
||||||||
NOTE 6 –
INVENTORIES
Inventories
are summarized as follows:
|
December
31,
2010
|
June
30,
2010
|
|||||||
|
(Unaudited)
|
||||||||
|
Raw
materials
|
$ | 8,602,093 | $ | 2,798,967 | ||||
|
Work-in-progress
|
889,710 | 889,937 | ||||||
|
Finished
goods
|
4,958,546 | 1,895,413 | ||||||
|
Total
inventories
|
$ | 14,450,349 | $ | 5,584,317 | ||||
F-12
XINDE
TECHNOLOGY COMPANY
AND
SUBSIDIARIES
NOTES
TO CONDENSED CONSOLIDATED FINANCIAL STATEMENTS
FOR THE THREE AND SIX MONTHS
ENDED DECEMBER 31, 2010 AND 2009
(UNAUDITED)
NOTE 7 – NOTES
RECEIVABLE
Notes
receivable from unrelated and related individuals consist of the
following:
|
December
31,
2010
|
June
30,
2010
|
|||||||
|
(Unaudited)
|
||||||||
|
Notes
receivable from unrelated individuals:
|
||||||||
|
Due
December 24, 2010, interest at 10% per annum
|
$ | — | $ | 2,857 | ||||
|
Due
December 24, 2010, interest at 10% per annum
|
— | 22,031 | ||||||
|
Due
May 16, 2011, interest at 6% per annum
|
117,971 | 114,560 | ||||||
|
Due
June 30, 2011, interest at 6% per annum
|
6,828 | — | ||||||
|
Due
December 24, 2011, interest at 10% per annum
|
2,942 | — | ||||||
|
Due
December 24, 2011, interest at 10% per annum
|
22,687 | — | ||||||
|
Subtotal
|
$ | 150,428 | $ | 139,448 | ||||
|
Bank
acceptance notes (aggregated by month of maturity):
|
||||||||
|
Due
December, 2010 (Settled on its due date)
|
— | 29,375 | ||||||
|
Due
October, 2010 (Settled on its due date)
|
— | 29,375 | ||||||
|
Due
November, 2010 (Settled on its due date)
|
— | 205,220 | ||||||
|
Due
December, 2010 (Settled on its due date)
|
— | 224,715 | ||||||
|
Due
February, 2011 (Settled on its due date)
|
151,245 | — | ||||||
|
Due
March, 2011
|
315,554 | — | ||||||
|
Due
April, 2011
|
642,790 | — | ||||||
|
Due
May, 2011
|
945,280 | — | ||||||
|
Due
June, 2011
|
1,820,986 | — | ||||||
|
Subtotal
|
3,875,855 | 488,685 | ||||||
|
Total
|
$ | 4,026,283 | $ | 628,133 | ||||
Notes
receivable from unrelated individuals are unsecured.
NOTE 8 – DUE
FROM/TO RELATED PARTIES
|
(I)
|
Due
To Related Parties
|
|
December
31,
2010
|
June
30,
2010
|
|||||||||
|
(Unaudited)
|
||||||||||
|
Jin
Xin
|
(a)
|
$ | 1,452 | $ | — | |||||
|
Liu
Dianjun
|
(b)
|
269,401 | 342,994 | |||||||
|
Li
Zengshan
|
(c)
|
31,593 | 23,612 | |||||||
|
Zhang
Qixiu
|
(d)
|
— | 32,312 | |||||||
|
Jin
Wei
|
(e)
|
— | 14,218 | |||||||
|
Total
due to related parties
|
$ | 302,446 | $ | 413,136 | ||||||
F-13
XINDE
TECHNOLOGY COMPANY
AND
SUBSIDIARIES
NOTES
TO CONDENSED CONSOLIDATED FINANCIAL STATEMENTS
FOR THE THREE AND SIX MONTHS
ENDED DECEMBER 31, 2010 AND 2009
(UNAUDITED)
NOTE
8 - DUE FROM/TO RELATED PARTIES (CONTINUED)
|
(II)
|
Due
From Employees
|
|
December
31,
2010
|
June
30,
2010
|
|||||||||
|
(Unaudited)
|
||||||||||
|
Current
|
$ | 36,756 | $ | 131,400 | ||||||
|
Total
due from employees
|
(f)
|
$ | 36,756 | $ | 131,400 | |||||
|
(III)
|
Due
To Employees
|
|
December
31,
2010
|
June
30,
2010
|
|||||||||
|
(Unaudited)
|
||||||||||
|
Current
|
$ | 60,415 | $ | 98,550 | ||||||
|
Total
due to employees
|
(g)
|
$ | 60,415 | $ | 98,550 | |||||
|
(a)
|
Jin
Xin is a shareholder of the Company and the chairman of Jinma, a
subsidiary of the Company. The payable balance represents business related
expenses paid by Jinxin on behalf of the Company, which is unsecured,
interest-free and has no fixed repayment
term.
|
|
(b)
|
Liu
Dianjun is a shareholder of the Company and the chairman of Hengyuan, a
subsidiary of the Company. The balances represent money advanced from Liu
Dianjun, which are interest-free, unsecured and have no fixed repayment
terms.
|
|
(c)
|
Li
Zengshan is a shareholder of the Company and the chairman of Huaxin, a
subsidiary of the Company. The balances represent business related
expenses paid by Li Zengshan on behalf of the Company. The balances are
interest-free, unsecured and have no fixed repayment
term.
|
|
(d)
|
Zhang
Qixiu is the mother of Jin Xin, also see (a). The balance represented
business related expenses paid by Zhang Qixiu on behalf of the Company,
which was interest-free, unsecured and had no fixed repayment
term.
|
|
(e)
|
Jin
Wei is the brother of Jin Xin, also see (a). The balance represented money
advanced from Jin Wei, which was interest-free, unsecured and had no fixed
repayment term.
|
|
(f)
|
Due
from employees are interest-free, unsecured and have no fixed repayment
terms. The Company provides these advances for business-related purposes
only, including for the purchases of raw materials and business-related
travel in the ordinary course of
business.
|
|
(g)
|
Due
to employees are interest-free, unsecured and have no fixed repayment
terms. The amounts primarily represent business and traveling related
expenses paid by sales personnel on behalf of the
Company.
|
F-14
XINDE
TECHNOLOGY COMPANY
AND
SUBSIDIARIES
NOTES
TO CONDENSED CONSOLIDATED FINANCIAL STATEMENTS
FOR THE THREE AND SIX MONTHS
ENDED DECEMBER 31, 2010 AND 2009
(UNAUDITED)
NOTE 8 – LAND USE
RIGHTS, NET
Land use
rights consist of the following:
|
December
31,
2010
|
June
30,
2010
|
|||||||
|
(Unaudited)
|
||||||||
|
Cost
of land use rights
|
$ | 1,087,939 | $ | 1,087,939 | ||||
|
Less:
Accumulated amortization
|
(150,901 | ) | (139,435 | ) | ||||
|
Land
use rights, net
|
$ | 937,038 | $ | 948,504 | ||||
Amortization
expense for the six months ended December 31, 2010 and 2009 was $11,466 and
$11,270, respectively.
Amortization
expense for the next five years and thereafter is as follows:
|
2011
(six months)
|
$ | 11,466 | ||
|
2012
|
22,933 | |||
|
2013
|
22,933 | |||
|
2014
|
22,933 | |||
|
2015
|
22,933 | |||
|
Thereafter
|
833,840 | |||
|
Total
|
$ | 937,038 |
Two land
use rights with an aggregate net book value of $52,615 and $51,880 at December
31, 2010 and June.30, 2010, respectively, were registered in the names of two
management members of the Company. The Company’s legal counsel has confirmed the
ownership of these two land use rights by the Company. The Company estimates
that the application for the transfer of the certificates of these two land use
rights will be completed by the end of March 2011. These two land use rights
were pledged as collateral for bank loans borrowed by Li Zengshan and Liu
Dianjun (both are shareholders of the Company) in the amounts of $347,589 and
$47,614. Also see Note 14.
At
December 31, 2010 and June 30, 2010, the net book value of land use rights
pledged as collateral for bank loans was $302,489 and $514,662, respectively.
Also see Note 10.
F-15
XINDE
TECHNOLOGY COMPANY
AND
SUBSIDIARIES
NOTES
TO CONDENSED CONSOLIDATED FINANCIAL STATEMENTS
FOR THE THREE AND SIX MONTHS
ENDED DECEMBER 31, 2010 AND 2009
(UNAUDITED)
NOTE 9 – PLANT
AND EQUIPMENT, NET
Plant and
equipment consist
of the following:
|
December
31, 2010
|
June
30,
2010
|
|||||||
|
(Unaudited)
|
||||||||
|
At
cost:
|
||||||||
|
Buildings
|
$ | 2,902,259 | $ | 2,818,371 | ||||
|
Machinery
and equipment
|
1,127,553 | 1,082,065 | ||||||
|
Office
equipment
|
54,894 | 50,299 | ||||||
|
Motor
vehicles
|
525,126 | 430,981 | ||||||
| 4,609,832 | 4,381,716 | |||||||
|
Less
: Accumulated depreciation
|
||||||||
|
Buildings
|
(490,273 | ) | (429,115 | ) | ||||
|
Machinery
and equipment
|
(685,934 | ) | (611,728 | ) | ||||
|
Office
equipment
|
(39,676 | ) | (35,789 | ) | ||||
|
Motor
vehicles
|
(288,245 | ) | (261,129 | ) | ||||
| (1,504,128 | ) | (1,337,761 | ) | |||||
|
Plant
and equipment, net
|
$ | 3,105,704 | $ | 3,043,955 | ||||
Depreciation
expense for the six months ended December 31, 2010 and 2009 was $129,983 and
$113,346 respectively.
At
December 31, 2010, the legal title to five motor vehicles and two office
buildings with a total net book value of $64,966 and $642,021 were registered in
the names of management members of the Company. The Company’s legal counsel has
confirmed the ownership of the motor vehicles and office buildings by the
Company. The Company estimates the transfer of the legal titles of the five
motor vehicles and two office buildings will be completed by the end of March
2011.
Two
office buildings were pledged as collateral for bank loans borrowed by Li
Zengshan and Liu Dianjun (both are shareholders of the Company) in the amounts
of $347,589 and $47,614, respectively. Also see Note 14.
Application
for ownership certificates of eleven buildings with an aggregate net book value
of $1,075,279 is in progress. The Company’s legal counsel has confirmed the
ownership of the eleven buildings by the Company. The application for the
certificates of the buildings is expected to be completed by the end of March
2011.
F-16
XINDE
TECHNOLOGY COMPANY
AND
SUBSIDIARIES
NOTES
TO CONDENSED CONSOLIDATED FINANCIAL STATEMENTS
FOR THE THREE AND SIX MONTHS
ENDED DECEMBER 31, 2010 AND 2009
(UNAUDITED)
NOTE 10 –
SHORT-TERM BANK LOANS
Short-term
bank loans consist
of the following:
|
December
31,
2010
|
June
30,
2010
|
|||||||
|
(Unaudited)
|
||||||||
|
Rural
Credit Cooperative:
|
||||||||
|
Monthly
interest only payments at 6.89% per annum, due December 1, 2010,
guaranteed by Weifang Tongxin Precision Rubber Products Co., Ltd. and
Weifang Dachang Energy-Saving Equipment Co., Ltd. (Repaid on its due
date)
|
$ | — | $ | 88,124 | ||||
|
Monthly
interest only payments at 7.52% per annum, due January 15, 2011,
guaranteed by Weifang Jinma Diesel Engine Co., Ltd. and Weifang Dachang
Energy-Saving Equipment Co., Ltd. (Subsequently settled on its due
date)
|
453,735 | 440,619 | ||||||
|
Bank
of Communications
|
||||||||
|
Monthly
interest only payments at 5.84% per annum, due July 23, 2010, secured by a
land use right owned by the Company and guaranteed by a shareholder, Liu
Dianjun.
Also
see Note 8. (Repaid on its due date)
|
— | 146,873 | ||||||
F-17
XINDE
TECHNOLOGY COMPANY
AND
SUBSIDIARIES
NOTES
TO CONDENSED CONSOLIDATED FINANCIAL STATEMENTS
FOR THE THREE AND SIX MONTHS
ENDED DECEMBER 31, 2010 AND 2009
(UNAUDITED)
NOTE 10 –
SHORT-TERM BANK LOANS (CONTINUED)
|
December
31, 2010
|
June
30,
2010
|
|||||||
|
(Unaudited)
|
||||||||
|
Weifang
Bank
|
||||||||
|
Monthly
interest only payments at 7.43% per annum, due October 27, 2010,
guaranteed by Weifang Hengyuan Oil Pump & Oil Fitting Co., Ltd.
(Repaid on its due date)
|
$ | — | $ | 587,492 | ||||
|
Monthly
interest only payments at 7.97% per annum, due October 19, 2010,
guaranteed by Weifang Hengyuan Oil Pump & Oil Fitting Co., Ltd.
(Repaid on its due date)
|
— | 293,746 | ||||||
|
Monthly
interest only payments at 7.43% per annum, due April 10, 2011, guaranteed
by Weifang Hengyuan Oil Pump & Oil Fitting Co., Ltd.
|
302,489 | 293,746 | ||||||
|
Monthly
interest only payments at 7.43% per annum, due July 27, 2011, guaranteed
by Weifang Hengyuan Oil Pump & Oil Fitting Co., Ltd.
|
604,980 | — | ||||||
|
China
Construction Bank:
|
||||||||
|
Monthly
interest only payments at 5.84% per annum, due December 2, 2010, borrowed
by Hengyuan, guaranteed by a shareholder, Liu Dianjun and Weifang Xinde
Fuel Injection System Co., Ltd. (Repaid on its due date)
|
— | 734,365 | ||||||
|
Monthly
interest only payments at 5.84% per annum, due July 29, 2011, borrowed by
Hengyuan, secured by a land use right owned by the Company. Also see Note
8.
|
302,489 | — | ||||||
|
Bank
of China:
|
||||||||
|
Monthly
interest only payments at 5.84% per annum, due February 10, 2011,
guaranteed by Weifang Hengyuan Oil Pump & Oil fitting Co., Ltd. and by
a shareholder, Li Zengshan, and his wife, Li Guimei
|
302,489 | 293,747 | ||||||
|
Total
|
$ | 1,966,182 | $ | 2,878,712 | ||||
Interest
expense for short-term bank loans for the six months ended December 31, 2010 and
2009 was $191,911 and $199,059, respectively.
F-18
XINDE
TECHNOLOGY COMPANY
AND
SUBSIDIARIES
NOTES
TO CONDENSED CONSOLIDATED FINANCIAL STATEMENTS
FOR THE THREE AND SIX MONTHS
ENDED DECEMBER 31, 2010 AND 2009
(UNAUDITED)
NOTE 11 – NOTES
PAYABLE, INCLUDING RELATED PARTIES
Notes
payable consist of the following:
|
December
31,
2010
|
June
30,
2010
|
|||||||||
|
(Unaudited)
|
||||||||||
|
Notes
payable to an unrelated individual:
|
||||||||||
|
Due
December 26, 2010, monthly interest payment at 6% per annum with the
principal payable at the due date
|
$ | — | $ | 84,505 | ||||||
|
Due
December 24, 2010, monthly interest payment at 10% per annum with the
principal payable at the due date
|
— | 98,308 | ||||||||
|
Due
May 4, 2011, monthly interest payment at 14.36% per annum with the
principal payable at the due date
|
384,162 | 373,058 | ||||||||
|
Due
May 4, 2011, monthly interest payment at 12% per annum with the principal
payable at the due date
|
145,195 | 140,998 | ||||||||
|
Due
August 4, 2011, monthly interest payment at 14.40% per annum with the
principal payable at the due date
|
378,112 | — | ||||||||
|
Due
June 30, 2011, monthly interest payment at 10.00% per annum with the
principal payable at the due date
|
32,003 | — | ||||||||
|
Due
October 1, 2011, interest free
|
86,210 | — | ||||||||
|
Due
November 1, 2011, monthly interest payment at 10% per annum with the
principal payable at the due date
|
23,866 | — | ||||||||
|
Due
December 25, 2011, monthly interest payment at 10.00% per annum with the
principal payable at the due date
|
97,704 | — | ||||||||
|
Subtotal
|
1,147,252 | 696,869 | ||||||||
|
Notes
payable to related individuals:
|
||||||||||
|
Due
July 1, 2010, monthly interest payment at 7.28% per annum
(Settled
on its due date)
|
(b)
|
— | 77,843 | |||||||
|
Due
December 24, 2010, monthly interest payment at 10% per annum (Settled in
advance)
|
(b)
|
— | 95,467 | |||||||
|
Due
May 2, 2011, monthly interest payment at 6% per annum with the principal
payable at the due date
|
(b)
|
32,170 | 31,240 | |||||||
|
Due
June 30, 2011, monthly interest payment at 10% per annum with the
principal payable at the due date
|
(b)
|
83,185 | 80,930 | |||||||
|
Due
June 30, 2011, monthly interest payment at 5.76% per annum (Settled in
advance)
|
(a)
|
— | 32,638 | |||||||
|
Due
June 30, 2011, monthly interest payment at 6.91% per annum. Principal is
repaid every month in 12 equal installments from December 4,
2010.
|
(b)
|
86,261 | — | |||||||
|
Due
December 24, 2010, monthly interest payment at 10% per annum with the
principal payable at the due date
|
(b)
|
98,309 | — | |||||||
|
Due
June 30, 2011, monthly interest payment at 5.84% per annum. Principal is
repaid every month in 12 equal installments from December 15,
2010.
|
(a)
|
33,610 | — | |||||||
|
Due
November 27, 2011, monthly interest payment at 10% per
annum
|
(c)
|
151,244 | — | |||||||
|
Subtotal
|
484,779 | 318,118 | ||||||||
|
Total
|
$ | 1,632,031 | $ | 1,014,987 | ||||||
|
(a)
|
The
notes are or were due to Mr. Liu Dianjun, a shareholder and officer of the
Company. The current balance represents a loan to the Company which is
unsecured.
|
|
(b)
|
The
notes are or were due to Mr. Li Zengshan, a shareholder and officer of the
Company. The current balances represent loans to the Company which are
unsecured.
|
|
(c)
|
This
note is due to Ms. Zhang Qixiu, the mother of Mr. Jinxin (also see Note
8(I)), a shareholder and officer of the Company. The current balance
represents a loan to the Company which is
unsecured.
|
Notes
payable to an unrelated individual are unsecured.
F-19
XINDE
TECHNOLOGY COMPANY
AND
SUBSIDIARIES
NOTES
TO CONDENSED CONSOLIDATED FINANCIAL STATEMENTS
FOR THE THREE AND SIX MONTHS
ENDED DECEMBER 31, 2010 AND 2009
(UNAUDITED)
NOTE 12 – LONG
-TERM NOTES PAYABLE TO RELATED PARTIES
Long-term
notes payable to related parties consist of the following:
|
December
31,
2010
|
June
30,
2010
|
|||||||||
|
(Unaudited)
|
||||||||||
|
Notes
payable to related individuals:
|
||||||||||
|
Due
May 12, 2012, monthly interest payment is 5.76% per annum. Principal is
repaid every month in 108 equal installments from May 15,
2003.
|
(a)
|
— | 29,918 | |||||||
|
Due
August 4, 2014, monthly interest payment is 6.91% per annum. Principal is
repaid every month in 60 equal installments from August 4,
2009.
|
(b)
|
261,328 | 296,380 | |||||||
|
Due
May 12, 2012, monthly interest payment is 5.84% per annum. Principal is
repaid every month in 108 equal installments from May 15,
2003.
|
(a)
|
$ | 14,004 | $ | — | |||||
|
Total
|
$ | 275,332 | $ | 326,298 | ||||||
|
(a)
|
The
current note is due to Mr. Liu Dianjun, a shareholder and officer of the
Company. The notes represent loans to the Company to support business
operations.
|
|
(b)
|
This
note is due to Mr. Li Zengshan, a shareholder and officer of the Company.
The balance represents a loan to the Company to support business
operations.
|
Notes
payable to related individuals are unsecured.
NOTE
13 – TAXES
|
(a)
|
Corporation
Income Tax (“CIT”)
|
On March
16, 2007, the National People’s Congress of China approved the Corporate Income
Tax Law of the People’s Republic of China (the “new CIT law”), which went into
effective on January 1, 2008. In accordance with the relevant tax laws and
regulations of PRC, the applicable corporate income tax rate for Hengyuan is
25%. In 2010 and 2009, Jinma and Huaxin were defined by the local tax
bureau as tax payers subject to the “Verification Collection” method, according
to which the amount of income taxes paid is determined by the local tax bureau
based on certain criteria instead of applying the CIT rate of 25%. Therefore,
the amount of income tax assessed for Jinma and Huaxin under this Verification
Collection method differed from the normal computation by applying the CIT rate
of 25%.
Effective
January 1, 2007, the Company adopted ASC 740-10, Accounting for Uncertainty in
Income Taxes. The interpretation addresses the determination of whether tax
benefits claimed or expected to be claimed on a tax return should be recorded in
the financial statements.
F-20
XINDE
TECHNOLOGY COMPANY
AND
SUBSIDIARIES
NOTES
TO CONDENSED CONSOLIDATED FINANCIAL STATEMENTS
FOR THE THREE AND SIX MONTHS
ENDED DECEMBER 31, 2010 AND 2009
(UNAUDITED)
NOTE 13 – TAXES
(CONTINUED)
Under ASC
740-10, the Company may recognize the tax benefit from an uncertain tax position
only if it is more likely than not that the tax position will be sustained on
examination by the taxing authorities, based on the technical merits of the
position. The tax benefits recognized in the financial statements from such a
position should be measured based on the largest benefit that has a greater than
fifty percent likelihood of being realized upon ultimate settlement. ASC 740-10
also provides guidance on de-recognition, classification, interest and penalties
on income taxes, accounting in interim periods and requires increased
disclosures. As of December 31, 2010, the Company does not have a liability for
unrecognized tax benefits.
The
Company’s income tax expense for the six months ended December 31, 2010 and 2009
are summarized as follows:
|
December
31, 2010
|
December
31,
2009
|
|||||||
|
(Unaudited)
|
(Unaudited)
|
|||||||
|
Current:
|
||||||||
|
Provision
for CIT
|
$ | 1,299,396 | $ | 1,697,205 | ||||
|
Deferred:
|
||||||||
|
Provision
for CIT
|
343,742 | (8,313 | ) | |||||
|
Income
tax expense
|
$ | 1,643,138 | $ | 1,688,892 | ||||
The
Company’s income tax expense differs from the “expected” tax expense for the six
months ended December 31, 2010 and 2009 (computed by applying the CIT rate of
25% percent to income before income taxes) as follows:
|
December
31,
2010
|
December
31,
2009
|
|||||||
|
(Unaudited)
|
(Unaudited)
|
|||||||
|
Computed
“expected” expense
|
$ | 3,119,118 | $ | 2,707,361 | ||||
|
Permanent
differences
|
(832,142 | ) | (149,700 | ) | ||||
|
Favourable
tax rates
|
(643,838 | ) | (868,769 | ) | ||||
|
Income
tax expense
|
$ | 1,643,138 | $ | 1,688,892 | ||||
F-21
XINDE
TECHNOLOGY COMPANY
AND
SUBSIDIARIES
NOTES
TO CONDENSED CONSOLIDATED FINANCIAL STATEMENTS
FOR THE THREE AND SIX MONTHS
ENDED DECEMBER 31, 2010 AND 2009
(UNAUDITED)
NOTE 13 – TAXES
(CONTINUED)
The tax
effects of temporary differences that give rise to the Company’s net deferred
tax assets and liabilities as of December 31, 2010 and June 30, 2010 are as
follows:
|
December
31,
2010
|
June
30,
2010
|
|||||||
|
(Unaudited)
|
||||||||
|
Deferred
tax assets:
|
||||||||
|
Current
portion:
|
||||||||
|
Bad
debt provision
|
$ | 24,894 | $ | 24,174 | ||||
|
Expenses
|
55,446 | 76,720 | ||||||
|
Subtotal
|
$ | 80,340 | $ | 100,894 | ||||
|
Deferred
tax liabilities:
|
||||||||
|
Current
portion:
|
||||||||
|
Sales
cut-off
|
$ | (364,746 | ) | $ | (31,596 | ) | ||
|
Others
|
(25,414 | ) | (21,850 | ) | ||||
|
Subtotal
|
(390,160 | ) | (53,446 | ) | ||||
|
Net
deferred tax (liabilities) assets - current portion
|
$ | (309,820 | ) | $ | 47,448 | |||
|
Deferred
tax assets:
|
||||||||
|
Non-current
portion:
|
||||||||
|
Depreciation
|
$ | 131,036 | $ | 118,448 | ||||
|
Amortization
|
11,539 | 10,601 | ||||||
|
Subtotal
|
142,575 | 129,049 | ||||||
|
Net
deferred tax assets - non-current portion
|
142,575 | 129,049 | ||||||
|
Total
net deferred tax (liabilities) assets
|
$ | (167,245 | ) | $ | 176,497 | |||
F-22
XINDE
TECHNOLOGY COMPANY
AND
SUBSIDIARIES
NOTES
TO CONDENSED CONSOLIDATED FINANCIAL STATEMENTS
FOR THE THREE AND SIX MONTHS
ENDED DECEMBER 31, 2010 AND 2009
(UNAUDITED)
NOTE 13 – TAXES
(CONTINUED)
|
(b)
|
Tax
Holiday Effect
|
For the
six months ended December 31, 2010 and 2009 the PRC corporate income tax rate
was 25%. Certain subsidiaries of the Company are entitled to favorable tax rates
for the periods ended December 31, 2010 and 2009.
The pro
forma combined effects of the favorable tax rates available to the Company for
the six months ended December 31, 2010 and 2009 are as follows:
|
For
the Six Months Ended
December 31,
|
||||||||
|
2010
|
2009
|
|||||||
|
Tax
holiday effect
|
$ | 643,838 | $ | 868,769 | ||||
|
Basic
net income per share effect
|
$ | 0.01 | $ | 0.02 | ||||
|
(c)
|
Value
Added Tax (“VAT”)
|
Enterprises
or individuals, who sell commodities, engage in repair and maintenance or import
or export goods in the PRC are subject to a value added tax in accordance with
Chinese Laws. The value added tax standard rate is 17% of the gross sale price
and the Company records its revenue net of VAT. A credit is available whereby
VAT paid on the purchases of semi-finished products or raw materials used in the
production of the Company’s finished products can be used to offset the VAT due
on the sales of the finished products.
In the
six months ended December 31, 2010, output VAT payable of $3,258,380 was
exempted by the local tax bureau to honor the Company’s continuous contribution
to the local economy and its achievement of becoming a United States public
reporting company, resulting in income of $3,258,380 which was reflected in the
accompanying condensed consolidated statements of income and comprehensive
income for the six months ended December 31, 2010.
The VAT
payable was $13,726,279 and $6,931,841 at December 31, 2010 and June 30, 2010,
respectively.
F-23
XINDE
TECHNOLOGY COMPANY
AND
SUBSIDIARIES
NOTES
TO CONDENSED CONSOLIDATED FINANCIAL STATEMENTS
FOR THE THREE AND SIX MONTHS
ENDED DECEMBER 31, 2010 AND 2009
(UNAUDITED)
NOTE 14 –
CONTINGENCIES
On May
15, 2003, Hengyuan entered into a guarantee contract to serve as guarantor for
the bank loans borrowed by Mr. Liu Dianjun, a shareholder and officer of the
Company, from Industrial and Commercial Bank of China with a guarantee amount of
$47,614. Under this guarantee contract, a land use right and an office
building of Hengyuan were pledged for the bank loans. (Also see Notes 8 and
9)
On August
4, 2009, Hengyuan entered into a guarantee contract to serve as guarantor for
bank loans borrowed by Mr. Li Zengshan, a shareholder and officer of the
Company, from the Industrial and Commercial Bank of China with a guarantee
amount of $347,589. Under this guarantee contract, a land use right and an
office building of Hengyuan were pledged for the bank loans. (Also see
Notes 8 and 9)
NOTE 15 –
COMMITMENT
The
Company has a capital commitment of approximately $571,781 for the construction
of a new plant for Huaxin, a subsidiary of the Company, for production of diesel
engines. The related construction is in progress and the accumulated cost
incurred was recorded as construction in progress in the accompanying balance
sheet as of December 31, 2010.
F-24
ITEM
2. MANAGEMENT’S DISCUSSION AND ANALYSIS OR PLAN OF OPERATION
Forward
Looking Statements
The
following discussion of the financial condition and results of operations of
Xinde Technology Company, a Nevada corporation and its subsidiaries (f/k/a
Wasatch Food Services, Inc., the “Company” or “Xinde”) is based upon and should
be read in conjunction with our unaudited condensed consolidated financial
statements and their related notes included in this report. This report contains
forward-looking statements. Generally, the words “believes”, “anticipates”,
“may”, “will”, “should”, “expect”, “intend”, “estimate”, “continue” and similar
expressions or the negative thereof or comparable terminology are intended to
identify forward-looking statements. Such statements are subject to certain
risks and uncertainties, including the matters set forth in this report or other
reports or documents we file with the SEC from time to time, which could cause
actual results or outcomes to differ materially from those projected. Undue
reliance should not be placed on these forward-looking statements which speak
only as of the date hereof. We undertake no obligation to update these
forward-looking statements.
Prior
Operations of the Company
Xinde was
incorporated as “Wasatch Food Services, Inc.” in Nevada in December 2006 to
engage as a franchisee of BAJIO® Mexican
Grill restaurants in the State of Idaho. In January 2007, the Company was
assigned certain rights under an area development agreement with Bajio, LLC (the
franchisor) that granted the Company the right to develop four BAJIO®
restaurant locations in Southern Idaho through December 31, 2009. In
October 2007, the Company entered into its first franchise agreement in
Boise, Idaho and thereafter entered into a lease, furnished and equipped the
space and opened for business in November 2007. The Company failed to open
any additional BAJIO®
restaurants within the time periods set forth in the area development agreement
and lost its right to develop such additional restaurants. During this time and
up to December 28, 2009, the Company conducted its operations solely through its
wholly-owned subsidiary, Bajio.
The
Company executed a purchase agreement to sell Bajio following the consummation
of the share exchange transaction described in the section below. The
Company has never initiated any bankruptcy, receivership or similar
proceedings.
The
December 2009 Share Exchange Transaction
On
December 28, 2009, the Company entered into a share exchange agreement (the
“Exchange”) with Jolly Promise Limited, an investment holding company organized
under the laws of the British Virgin Islands (“Jolly”) and the stockholder of
Jolly, Welldone Pacific Limited, a limited company organized under the laws of
the British Virgin Islands (“Welldone”). As a result of the share exchange, or
the Exchange, the Company acquired all of the issued and outstanding securities
of Jolly from Welldone in exchange for 42,000,000 newly-issued shares of the
Company’s common stock, par value $0.001 per share (“Common Stock”). Immediately
following the Exchange, the Stockholder owned 70% of the 60,000,000 issued and
outstanding shares of voting capital stock of the Company. As a result of the
Exchange, Jolly became a wholly-owned subsidiary of the Company.
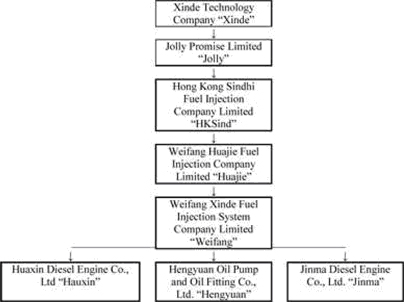
Following
the Exchange, the corporate structure of the Company consisted of Jolly, a
wholly-owned subsidiary of the Company, Jolly’s wholly-owned subsidiary, Hong
Kong Sindhi Fuel Injection Company Limited, a Hong Kong company (“HKSind”),
HKSind’s wholly-owned subsidiary, Weifang Huajie Fuel Injection Company Limited
(“Huajie”), a company organized under the laws of The People’s Republic of China
(“PRC”), Huajie’s wholly-owned subsidiary, Weifang Xinde Fuel Injection System
Company Limited, a PRC company (“Weifang”) and Weifang’s wholly-owned
subsidiaries, Huaxin Diesel Engine Co., Ltd., a PRC company (“Huaxin”), Hengyuan
Oil Pump and Oil Fitting Co., Ltd., a PRC company (“Hengyuan”) and Jinma Diesel
Engine Co., Ltd., a PRC company (“Jinma” and together with Jolly, HKSind,
Huajie, Weifang, Huaxin and Hengyuan, the “Subsidiaries”).
On April
22, 2010, the Company held a special meeting of its stockholders. At the special
meeting, the Company’s stockholders approved, by the requisite number of votes,
to change the Company’s name from “Wasatch Food Services, Inc.” to “Xinde
Technology Company”.
- 3
-
The
principal business activities of Xinde and its Subsidiaries consist of the
production and marketing of fuel injection systems, non-vehicle diesel engines,
and diesel generator technology. The above described corporate structure is
illustrated below:
The
Common Stock is currently quoted on the OTCQB under the symbol
“WTFS”.
Current
Operations of the Company
The
Company operates in one business segment, the design, development, manufacture,
and commercialization of fuel injection pumps, injectors, multi-cylinder diesel
engines and small generator units primarily in the PRC. However, our products
compete in the following three primary product segments: (1) fuel injection
system products, (2) diesel engine products and (3) generator
products. We believe our broad range of products (including non-vehicle diesel
engines, diesel generators, injection pumps, injectors and three-coupling
components, and agricultural machinery and construction machinery) increases our
competitiveness.
The
Company is based in China’s Shandong Province in the city of Weifang where many
large and medium-sized diesel engine enterprises and related products and
components manufacturers are located. Weifang is also an important traffic
center on the east coast in northern China. We believe our location makes the
purchase of raw materials and sales of our products very convenient and reduces
the costs associated with sales while reducing freight costs. No
single supplier accounted for more than 10% of the Company’s purchases and
accounts payable for the years ended June 30, 2010 and 2009, or for the six
months ended December 31, 2010, and no single customer accounted for more than
10% of the Company’s total revenue or accounts receivable for the years ended
June 30, 2010 and 2009, or for the six months ended December 31,
2010.
We have
developed fuel injection system products that we believe will meet the Euro III
Emissions Standard, which will become most relevant in light of China’s
initiative to implement the Euro III Emissions Standard in 2010. Furthermore, we believe
that we are China’s only company with exclusive intellectual property rights for
fuel injection systems meeting such Euro III Emissions Standard which could lead
to broad market appeal. Due to our strict technical standards and quality
control in production process, our products have become well-known brands in
their markets throughout China. Our Company has always placed quality control
first and we received our ISO9001 certification in 2005.
Our
products feature a cost and price advantage arising from our independently owned
intellectual property. For example, our integrated electromechanical
electronically-controlled high-pressure fuel injection system with common rail
sells for RMB7,000 (US$1,029) per set as compared with products produced by some
of our largest competitors (BOSCH and DENSO) which offer comparable products for
RMB15,000 (US$2,011) per set. As a result, we believe such products will gain
market share and be instrumental in improving our competitive position and brand
influence.
- 4
-
We also
have a long-term relationship with Tianjin University’s Combustion Laboratory of
Combustion Engines, a national key laboratory located in Tianjin, China, which
contributes to our growing expertise and reputation in the field of integrated
electromechanical electronically-controlled high-pressure fuel injection systems
with common rail in China. In addition, we have an experienced team of in-house
technicians which contributes to our product’s technical content and ultimately,
our core competitiveness.
Through
independent development, cooperation and introduction, we have developed a
variety of diesel engine injector assemblies for Sitair, 170, 190 and 105 models
as well as multi-cylinder No. 1, BX, BXD, IIW and DT12/24-10X (electronic
regulator) injection pump assemblies and oil transfer pumps. In addition, we
have fully acquired the production process and technology for EGR (Exhaust Gas
Recirculation) diesel engines and gas power generators that are in growing
demand in the marketplace.
Each of
our Subsidiaries has its own marketing network. The Company’s goal is to utilize
each of such networks to create a countrywide network. The Company has made its
after-sales service a priority, setting up a special after-sales service
management department to provide users with after-sales services.
We have
established nationwide marketing and after-sale service networks in China. We
have established more than 20 branches throughout China, including Fu’an,
Guangzhou, Dongguan, Jiangdu, Chengdu, Chongqing, Kunming, Taiyuan, Shenyang,
Changsha and Urumchi. The Company employs agents throughout China, who receive
commissions on the amount of products that they help the Company to sell.
Agreements with such agents are generally formed during national trade fairs or
other types of trade exhibitions. We pay for transportation expenses and the
products are generally delivered via road vehicles. Mobile
technicians operate our after-sales network. Each is assigned to a different
geographical area.
Our
principal offices are located at Number 363, Sheng Li West Street, Weifang,
Shandong Province, The People’s Republic of China, Telephone:
(86) 536-8322068, Facsimile: (86) 852-28450504. The Company has
also launched a new company website in English at www.chinaxinde.cn.
Critical
Accounting Policies, Estimates and Assumptions
The SEC
defines critical accounting policies as those that are, in management’s view,
most important to the portrayal of our financial condition and results of
operations and those that require significant judgments and
estimates.
The
discussion and analysis of our financial condition and results of operations is
based upon our financial statements which have been prepared in accordance with
accounting principles generally accepted in the United States. The preparation
of these financial statements requires us to make estimates and judgments that
affect the reported amounts of assets and liabilities. On an on-going basis, we
evaluate our estimates including the allowance for doubtful accounts, the
salability and recoverability of inventory, income taxes and contingencies. We
base our estimates on historical experience and on other assumptions that we
believe to be reasonable under the circumstances, the results of which form our
basis for making judgments about the carrying values of assets and liabilities
that are not readily apparent from other sources. Actual results may differ from
these estimates under different assumptions or conditions.
We cannot
predict what future laws and regulations might be passed that could have a
material effect on our results of operations. We assess the impact of
significant changes in laws and regulations on a regular basis and update the
assumptions and estimates used to prepare our financial statements when we deem
it necessary.
- 5
-
Economic
and Political Risks
The
Company’s operations are conducted in the PRC. Accordingly, the Company’s
business, financial condition and results of operations may be influenced by the
political, economic and legal environment in the PRC, and by the general state
of the PRC economy.
The
Company’s operations in the PRC are subject to special considerations and
significant risks not typically associated with companies in North America and
Western Europe. These include risks associated with, among others, the
political, economic and legal environment and foreign currency exchange. The
Company’s results may be adversely affected by changes in the political and
social conditions in the PRC, and by changes in governmental policies with
respect to laws and regulations, anti-inflationary measures, currency
conversion, remittances abroad, and rates and methods of taxation, among other
things.
Fair
Value of Financial Instruments
ASC
820-10, Fair Value Measurements, establishes a three-tier fair value
hierarchy, which prioritizes the inputs used in measuring fair value. The
hierarchy prioritizes the inputs into three levels based on the extent to which
inputs used in measuring fair value are observable in the market.
These
tiers include:
|
|
·
|
Level 1—defined
as observable inputs such as quoted prices in active
markets;
|
|
|
·
|
Level 2—defined
as inputs other than quoted prices in active markets that are either
directly or indirectly observable;
and
|
|
|
·
|
Level 3—defined
as unobservable inputs in which little or no market data exists, therefore
requiring an entity to develop its own
assumptions.
|
The
assets measured at fair value on a recurring basis subject to the disclosure
requirements of ASC 820-10 as of December 31, 2010 are as follows:
|
Fair Value Measurements at Reporting Date
Using
|
||||||||||||||||
|
Carrying
Value as of
December
31, 2010
|
Quoted
Prices in
Active
Markets
for
Identical
Assets
(Level
1)
|
Significant
Other
Observable
Inputs
(Level
2)
|
Significant
Unobservable
Inputs
(Level
3)
|
|||||||||||||
|
Bank
acceptance notes
|
$ | 3,875,855 | $ | 3,875,855 | $ | — | $ | — | ||||||||
|
Long-term
notes payable
|
$ | 275,332 | — | $ | 275,332 | $ | — | |||||||||
The
carrying amounts of financial assets and liabilities, such as cash and cash
equivalents, accounts receivable, notes receivable, prepayments for goods,
short-term bank loans, accounts payable, customer deposits, short-term notes
payable, due to employee, due to related parties and other payables, approximate
their fair values because of the short maturity of these instruments. The fair
value of the Company’s long-term notes payable is estimated based on the current
rates offered to the Company for debt of similar terms and maturities. Under
this method, the Company’s fair value of long-term notes payable was not
significantly different from the carrying value at December 31,
2010.
- 6
-
Revenue
Recognition
Revenue
represents the invoiced value of goods sold, recognized upon the shipment of
goods to customers. Revenue is recognized when all of the following criteria are
met:
|
|
·
|
Persuasive
evidence of an arrangement exists,
|
|
|
·
|
Delivery
has occurred or services have been
rendered,
|
|
|
·
|
The
seller's price to the buyer is fixed or determinable,
and
|
|
|
·
|
Collectability
is reasonably assured.
|
The
majority of the Company’s revenue results from sales contracts with distributors
and revenue are recorded upon the shipment of goods. Management conducts credit
background checks for new customers as a means to reduce the subjectivity of
collectability.
The
Company offers warranties on its products for periods between six and twelve
months after the sale. The Company estimates the warranty reserves based on
historical records and identical or similar types on the market. Warranty
expenses related to product sales are charged to the condensed consolidated
statements of income and comprehensive income in the period in which sales is
recognized. During the six months ended December 31, 2010 and 2009, warranty
expense was $281,144 and $77,765, respectively, and is included in selling and
marketing expenses in the accompanying condensed consolidated statements of
income and comprehensive income.
Foreign
Currency Translation
The
accompanying condensed consolidated financial statements are presented in United
States dollars. The functional currency of the Company is the Renminbi (RMB).
Capital accounts of the condensed consolidated financial statements are
translated into United States dollars from RMB at their historical exchange
rates when the capital transactions occurred. Assets and liabilities are
translated at the exchange rates as of balance sheet date. Income and
expenditures are translated at the average exchange rate of the
quarter.
|
December
31,
2010
|
June
30,
2010
|
December
31,
2009
|
||||||||||
|
Period
ended RMB: US$ exchange rate
|
6.6118 | 6.8086 | — | |||||||||
|
Average
RMB: US$ exchange rate for three months ended
|
6.6670 | — | 6.8360 | |||||||||
|
Average
RMB: US$ exchange rate for six months ended
|
6.7237 | — | 6.8386 | |||||||||
The RMB
is not freely convertible into foreign currency and all foreign exchange
transactions must take place through authorized institutions. No representation
is made that the RMB amounts could have been, or could be, converted into US$ at
the rates used in translation.
Earnings
Per Share
Basic
earnings per share are computed by dividing income available to common
shareholders by the weighted-average number of common shares outstanding during
the period. Diluted earnings per share is computed similar to basic earnings per
share except that the denominator is increased to include the number of
additional common shares that would have been outstanding if the potential
common shares had been issued and if the additional common shares were dilutive.
There were no potentially dilutive securities for the six months ended December
31, 2010 and 2009.
Segment
and Geographic Reporting
The
Company operates in one business segment, the design, development, manufacture,
and commercialization of fuel injection pumps, injectors, multi-cylinder diesel
engines and small generator units mainly in the PRC. The sales of the Company
outside of the PRC were insignificant for the six months ended December 31, 2010
and 2009.
- 7
-
Recent
Accounting Pronouncements
There are
no new accounting pronouncements that have not been adopted by the Company that
would have a material effect on the condensed consolidated financial
statements.
Results
of Operations
Comparison
of Three Months Ended December 31, 2010 and 2009
The
following table sets forth the amounts and the percentage relationship to
revenues of certain items in our consolidated statements of income for the three
months ended December 31, 2010 and 2009:
|
Three
Months Ended
|
||||||||||||||||||||||||
|
December
31, 2010
|
December
31, 201009
|
Comparisons
|
||||||||||||||||||||||
|
Amount
|
%
of Revenues
|
Amount
|
%
of Revenues
|
Change
in Amount
|
Change
in %
|
|||||||||||||||||||
|
$
|
$
|
$
|
||||||||||||||||||||||
|
REVENUES,
NET
|
32,387,892 | 100 | % | 35,750,798 | 100 | % | (3,362,906 | ) | (9 | )% | ||||||||||||||
|
COST
OF GOODS SOLD
|
(25,710,389 | ) | (79 | )% | (28,962,481 | ) | (81 | )% | 3,252,092 | (11 | )% | |||||||||||||
|
GROSS
PROFIT
|
6,677,503 | 21 | % | 6,788,317 | 19 | % | (110,814 | ) | (2 | )% | ||||||||||||||
|
Selling
and marketing
|
(807,979 | ) | (2 | )% | (849,851 | ) | (2 | )% | 41,872 | (5 | )% | |||||||||||||
|
General
and administrative
|
(260,016 | ) | (1 | )% | (269,378 | ) | (1 | )% | 9,362 | (3 | )% | |||||||||||||
|
Bad
debt recoveries
|
480,454 | 1 | % | 74,968 | 0.2 | % | 405,486 | 541 | % | |||||||||||||||
|
INCOME
FROM OPERATIONS
|
6,089,962 | 19 | % | 5,744,056 | 16 | % | 345,906 | 6 | % | |||||||||||||||
|
Interest
expense, net
|
(62,140 | ) | (0.2 | )% | (70,647 | ) | (0.2 | )% | 8,507 | (12 | )% | |||||||||||||
|
Other
income, net
|
122,565 | 0.4 | % | 4,482 | 0.01 | % | 118,083 | 2,635 | % | |||||||||||||||
|
INCOME
BEFORE INCOME TAXES
|
6,150,387 | 19 | % | 5,677,891 | 16 | % | 472,496 | 8 | % | |||||||||||||||
|
INCOME
TAXES
|
(773,934 | ) | (2 | )% | (961,736 | ) | (3 | )% | 187,802 | (20 | )% | |||||||||||||
|
NET
INCOME
|
5,376,453 | 17 | % | 4,716,155 | 13 | % | 660,298 | 14 | % | |||||||||||||||
|
Foreign
currency translation gain (loss)
|
846,213 | 3 | % | (837 | ) | — | 847,050 | (101,201 | )% | |||||||||||||||
|
OTHER
COMPREHENSIVE INCOME (LOSS)
|
846,213 | 3 | % | (837 | ) | — | 847,050 | (101,201 | )% | |||||||||||||||
|
COMPREHENSIVE
INCOME
|
6,222,666 | 19 | % | 4,715,318 | 13 | % | 1,507,348 | 32 | % | |||||||||||||||
- 8
-
Revenues
Our
revenues are derived from the design, development, manufacturing and
commercialization of fuel injection pumps, injectors, multi-cylinder diesel
engines and small generator units in the PRC and, to an insignificant extent,
overseas. The table below sets forth a breakdown of our revenues by product for
the three months indicated:
|
Three
Months Ended December 31,
|
||||||||||||||||||||||||
|
2010
|
2009
|
Comparisons
|
||||||||||||||||||||||
|
Amount
|
%
of Revenues
|
Amount
|
%
of Revenues
|
Change
in Amount
|
Change
in %
|
|||||||||||||||||||
|
$
|
$
|
$
|
||||||||||||||||||||||
|
Revenues:
|
||||||||||||||||||||||||
|
Electricity
pumps
|
2,176,933 | 6 | % | 2,287,466 | 7 | % | (110,533 | ) | (5 | )% | ||||||||||||||
|
Multi-cylinder
pumps
|
7,958,357 | 24 | % | 7,035,818 | 20 | % | 922,539 | 13 | % | |||||||||||||||
|
Single-cylinder
pumps
|
636,195 | 2 | % | 503,532 | 1 | % | 132,663 | 26 | % | |||||||||||||||
|
Fuel
muzzles
|
1,743,203 | 5 | % | 1,563,544 | 4 | % | 179,659 | 11 | % | |||||||||||||||
|
Parts
|
203,467 | 1 | % | 229,938 | 1 | % | (26,471 | ) | (12 | )% | ||||||||||||||
|
Diesel
engines
|
14,097,204 | 44 | % | 14,778,186 | 41 | % | (680,982 | ) | (5 | )% | ||||||||||||||
|
Generator
sets
|
5,389,026 | 17 | % | 9,320,180 | 26 | % | (3,931,154 | ) | (42 | )% | ||||||||||||||
|
Accessories
|
191,947 | 1 | % | 39,429 | — | 152,518 | 387 | % | ||||||||||||||||
|
Less:
sales tax
|
(8,440 | ) | — | (7,295 | ) | — | (1,145 | ) | 16 | % | ||||||||||||||
|
Total
|
32,387,892 | 100 | % | 35,750,798 | 100 | % | (3,362,906 | ) | (9 | )% | ||||||||||||||
Our
revenues decreased by 9% to $32,387,892 for the three months ended December 31,
2010 from $35,750,798 for the three months ended December 31, 2009. This
decrease was primarily attributable to a decrease in the sales of generator
sets, which decreased by 42% and accounted for 17% of our total revenue for the
three months ended December 31, 2010. The main reason for this decline was
attributable to the fact that demand for high-end products with greater power is
growing in the PRC. The Company is also trying to adjust its product mix by
introducing more products with greater engine power to meet this new trend.
Therefore, since July 2010 the Company reduced the production and sales scale
for products of older style diesel engines and generator sets with lower gross
margin as an adjustment to its product structure. Additionally, as a result of
the PRC government’s policy of controlling inflation, development in
infrastructure in the PRC has slowed, which has resulted in less demand in the
market and a decrease in our product sales.
Cost
of Goods Sold
The
principal components of our cost of goods sold are costs of direct materials.
The following table sets forth a breakdown of our cost of goods sold by product
for the three months indicated:
|
Three
Months Ended December 31,
|
||||||||||||||||||||||||
|
2010
|
2009
|
Comparisons
|
||||||||||||||||||||||
|
Amount
|
%
of Cost of Goods Sold
|
Amount
|
%
of Cost of Goods Sold
|
Change
in Amount
|
Change
in %
|
|||||||||||||||||||
|
$
|
$
|
$
|
||||||||||||||||||||||
|
Costs
of Goods Sold:
|
||||||||||||||||||||||||
|
Electricity
pumps
|
1,864,108 | 7 | % | 1,832,605 | 6 | % | 31,503 | 2 | % | |||||||||||||||
|
Multi-cylinder
pumps
|
5,319,050 | 21 | % | 4,194,088 | 14 | % | 1,124,962 | 27 | % | |||||||||||||||
|
Single-cylinder
pumps
|
616,827 | 2 | % | 359,559 | 1 | % | 257,268 | 72 | % | |||||||||||||||
|
Fuel
muzzles
|
1,577,788 | 6 | % | 1,168,993 | 4 | % | 408,795 | 35 | % | |||||||||||||||
|
Parts
|
182,438 | 1 | % | 201,192 | 1 | % | (18,754 | ) | (9 | )% | ||||||||||||||
|
Diesel
engines
|
11,974,795 | 46 | % | 12,963,638 | 45 | % | (988,843 | ) | (8 | )% | ||||||||||||||
|
Generator
sets
|
4,019,254 | 16 | % | 8,215,753 | 29 | % | (4,196,499 | ) | (51 | )% | ||||||||||||||
|
Accessories
|
156,129 | 1 | % | 26,653 | — | 129,476 | 486 | % | ||||||||||||||||
|
Total
|
25,710,389 | 100 | % | 28,962,481 | 100 | % | (3,252,092 | ) | (11 | )% | ||||||||||||||
Our cost
of goods sold decreased by 11%, or $3,252,092, to $25,710,389 for the three
months ended December 31, 2010 from $28,962,481 for the three months ended
December 31, 2009. This decrease was in line with the decrease in product sales
during the same period.
- 9
-
Gross
Profit and Gross Margin
Gross
profit is equal to revenues less cost of goods sold. Gross margin is equal to
gross profit divided by revenues. The table below sets forth a breakdown of our
gross profit and gross margin by revenue source for the years
indicated:
|
Three
Months Ended December 31,
|
||||||||||||||||||||||||
|
2010
|
2009
|
Comparison
|
||||||||||||||||||||||
|
Gross
Profit
|
Gross
Margin
|
Gross
Profit
|
Gross
Margin
|
Change
in Amount
|
Change
in Gross Margin
|
|||||||||||||||||||
|
$
|
$
|
$
|
||||||||||||||||||||||
|
Gross
Profit and Gross Margin:
|
||||||||||||||||||||||||
|
Electricity
pumps
|
312,825 | 14 | % | 454,861 | 20 | % | (142,036 | ) | (6 | )% | ||||||||||||||
|
Multi-cylinder
pumps
|
2,639,307 | 33 | % | 2,841,730 | 40 | % | (202,423 | ) | (7 | )% | ||||||||||||||
|
Single-cylinder
pumps
|
19,368 | 3 | % | 143,973 | 29 | % | (124,605 | ) | (26 | )% | ||||||||||||||
|
Fuel
muzzles
|
165,415 | 9 | % | 394,551 | 25 | % | (229,136 | ) | (16 | )% | ||||||||||||||
|
Parts
|
21,029 | 10 | % | 28,746 | 13 | % | (7,717 | ) | (3 | )% | ||||||||||||||
|
Diesel
engines
|
2,122,409 | 15 | % | 1,814,548 | 12 | % | 307,861 | 3 | % | |||||||||||||||
|
Generator
Sets
|
1,369,772 | 25 | % | 1,104,427 | 12 | % | 265,345 | 13 | % | |||||||||||||||
|
Accessories
|
35,818 | 19 | % | 12,776 | 32 | % | 23,042 | (13 | )% | |||||||||||||||
|
Less:
sales taxes
|
(8,440 | ) | — | (7,295 | ) | — | (1,145 | ) | — | |||||||||||||||
|
Total
|
6,677,503 | 21 | % | 6,788,317 | 19 | % | (110,814 | ) | 2 | % | ||||||||||||||
Although
our gross profit decreased by $110,814 to $6,677,503 for the three months ended
December 31, 2010 as compared to $6,788,317 for the three months ended December
31, 2009, our gross margin for the three months ended December 31, 2010
increased by 2% from the three months ended December 31, 2009. This was mainly
due to the Company’s efforts since July 2010 to adjust its product mix by
introducing more products with higher gross margins and reducing the production
and sales of older style diesel engines and generator sets with lower gross
margins.
Selling
and Marketing Expenses
Our
selling and marketing expenses primarily include sales commissions, after-sales
services fees, payroll, travel costs and freight fees. Our selling and marketing
expenses accounted for 2% of our revenues for the three months ended December
31, 2010. Selling and marketing expenses decreased by 5%, or $41,871, to
$807,979 for the three months ended December 31, 2010 from $849,851 for the
three months ended December 31, 2009. This decrease was primarily due to the
decrease in sales commissions to employees of $254,833.
- 10
-
General
and Administrative Expenses
Our
general and administrative expenses consist primarily of payroll, consulting
fees, property
depreciation, entertainment fees, office general expenses, labor insurance fees,
travel costs, land usage taxes, welfare fees and land use rights
amortization.
Our
general and administrative expenses decreased by 3%, or $9,362, to $260,016 for
the three months ended December 31, 2010 from $269,378 for the three months
ended December 31, 2009. This decrease was primarily due to the decrease in
office expenses and travel costs of $6,784, in the aggregate. Our general and
administrative expenses were approximately 1% of revenues, which has remained
stable from the three months ended December 31, 2009.
Interest
Expense, Net
For the
three months ended December 31, 2010 and 2009, interest expense was $62,140 and
$70,647, or 0.2% and 0.20% of our revenues, respectively. Interest expense
decreased by 12%, or $8,507, to $62,139 for the three months ended December 31,
2010 from $70,647 for the three months ended December 31, 2009. The decrease in
interest expense was primarily attributable to the decrease in bank loans of
$912,530.
Other
Income (Expense), Net
Other
income was $122,565 for the three months ended December 31, 2010 compared to
other income of $4,482 for the three months ended December 31, 2009. This was
primarily due to a gain of $90,276 from waived accounts payable for the three
months ended December 31, 2010.
Income
Taxes
Our
income tax expenses decreased by 20%, or $187,802, to $773,934 for the three
months ended December 31, 2010 from $961,736 for the three months ended December
31, 2009.
In
accordance with the relevant tax laws and regulations of the PRC, the applicable
corporate income tax rate for Hengyuan is 25%. In 2010 and 2009, Jinma and
Huaxin were defined by the local tax bureau as tax payers subject to the
“Verification Collection” method, according to which the amount of income taxes
paid is determined by the local tax bureau based on certain criteria instead of
applying the CIT rate of 25%. Therefore, the amount of income tax assessed for
Jinma and Huaxin under this Verification Collection method differed from the
normal computation by applying the CIT rate of 25%. Our effective tax rate
was 13% and 17% for the three months ended December 31, 2010 and 2009,
respectively.
Net
Income
Primarily
as a result of the foregoing, our net income increased by 14%, or $660,298, to
$5,376,453 for the three months ended December 31, 2010 from $4,716,155 for the
three months ended December 31, 2009
- 11
-
Comparison
of Six Months Ended December 31, 2010 and 2009
The
following table sets forth the amounts and the percentage relationship to
revenues of certain items in our consolidated statements of income for the six
months ended December 31, 2010 and 2009:
|
Six
Months Ended
|
||||||||||||||||||||||||
|
December
31, 2010
|
December
31, 2009
|
Comparisons
|
||||||||||||||||||||||
|
Amount
|
%
of Revenues
|
Amount
|
%
of Revenues
|
Change
in Amount
|
Change
in %
|
|||||||||||||||||||
|
$
|
$
|
$
|
||||||||||||||||||||||
|
REVENUES,
NET
|
62,686,928 | 100 | % | 73,367,699 | 100 | % | (10,680,771 | ) | (15 | )% | ||||||||||||||
|
COST
OF GOODS SOLD
|
(51,367,591 | ) | (82 | )% | (60,590,584 | ) | (83 | )% | 9,222,993 | (15 | )% | |||||||||||||
|
GROSS
PROFIT
|
11,319,337 | 18 | % | 12,777,115 | 17 | % | (1,457,778 | ) | (11 | )% | ||||||||||||||
|
Selling
and marketing
|
(2,025,097 | ) | (3 | )% | (1,282,423 | ) | (2 | )% | (742,674 | ) | 58 | % | ||||||||||||
|
General
and administrative
|
(773,331 | ) | (1 | )% | (562,438 | ) | (1 | )% | (210,893 | ) | 37 | % | ||||||||||||
|
Bad
debt recoveries
|
662,974 | 1 | % | 74,909 | 0.1 | % | 588,065 | 785 | % | |||||||||||||||
|
INCOME
FROM OPERATIONS
|
9,183,883 | 15 | % | 11,007,163 | 15 | % | (1,823,280 | ) | (17 | )% | ||||||||||||||
|
Interest
expense, net
|
(203,895 | ) | (0.33 | )% | (176,936 | ) | (0.24 | )% | (26,959 | ) | 15 | % | ||||||||||||
|
Other
income (expense), net
|
238,102 | 0.4 | % | (784 | ) | — | 238,886 | 30,470 | % | |||||||||||||||
|
Refunded
value added tax
|
3,258,380 | 5 | % | — | — | 3,258,380 | — | |||||||||||||||||
|
INCOME
BEFORE INCOME TAXES
|
12,476,470 | 20 | % | 10,829,443 | 15 | % | 1,647,027 | 15 | % | |||||||||||||||
|
INCOME
TAXES
|
(1,643,137 | ) | (3 | )% | (1,688,892 | ) | (2 | )% | 45,755 | (3 | )% | |||||||||||||
|
NET
INCOME
|
10,833,333 | 17 | % | 9,140,551 | 12 | % | 1,692,782 | 19 | % | |||||||||||||||
|
Foreign
currency translation gain (loss)
|
1,820,017 | 3 | % | 28,049 | — | 1,791,968 | 6,389 | % | ||||||||||||||||
|
OTHER
COMPREHENSIVE INCOME (LOSS)
|
1,820,017 | 3 | % | 28,049 | — | 1,791,968 | 6,389 | % | ||||||||||||||||
|
COMPREHENSIVE
INCOME
|
12,653,350 | 20 | % | 9,168,600 | 12 | % | 3,484,750 | 38 | % | |||||||||||||||
Revenues
Our
revenues are derived from design, development, manufacturing and
commercialization of fuel injection pumps, injectors, multi—cylinder diesel
engines and small generator units for the PRC and overseas markets. The table
below sets forth a breakdown of our revenues by product for the six months
indicated:
|
Six
Months Ended December 31,
|
||||||||||||||||||||||||
|
2010
|
2009
|
Comparisons
|
||||||||||||||||||||||
|
Amount
|
%
of Revenues
|
Amount
|
%
of Revenues
|
Change
in Amount
|
Change
in %
|
|||||||||||||||||||
|
$
|
$
|
$
|
||||||||||||||||||||||
|
Revenues:
|
||||||||||||||||||||||||
|
Electricity
pumps
|
5,218,753 | 8 | % | 4,615,498 | 6 | % | 603,255 | 13 | % | |||||||||||||||
|
Multi-cylinder
pumps
|
18,413,935 | 29 | % | 14,420,813 | 20 | % | 3,993,122 | 28 | % | |||||||||||||||
|
Single-cylinder
pumps
|
1,084,622 | 2 | % | 1,311,217 | 2 | % | (226,595 | ) | (17 | )% | ||||||||||||||
|
Fuel
muzzles
|
3,271,893 | 5 | % | 3,546,264 | 5 | % | (274,371 | ) | (8 | )% | ||||||||||||||
|
Parts
|
372,155 | 1 | % | 407,500 | 1 | % | (35,345 | ) | (9 | )% | ||||||||||||||
|
Diesel
engines
|
23,030,204 | 37 | % | 30,234,425 | 41 | % | (7,204,221 | ) | (24 | )% | ||||||||||||||
|
Generator
sets
|
11,013,857 | 18 | % | 18,707,401 | 25 | % | (7,693,544 | ) | (41 | )% | ||||||||||||||
|
Accessories
|
297,929 | — | 138,589 | — | 159,340 | 115 | % | |||||||||||||||||
|
Less:
sales tax
|
(16,420 | ) | — | (14,008 | ) | — | (2,412 | ) | 17 | % | ||||||||||||||
|
Total
|
62,686,928 | 100 | % | 73,367,699 | 100 | % | (10,680,771 | ) | (15 | )% | ||||||||||||||
- 12
-
Our
revenues decreased by 15% to $62,686,928 for the six months ended December 31,
2010 from $73,367,699 for the six months ended December 31, 2009. This decrease
was primarily attributable to a decrease in the sales of generator sets, which
decreased by 41% and accounted for 18% of our total revenue for the six months
ended December 31, 2010. The main reason for this decline was attributable to
the declining
demand for our products with lower power. We are adjusting the product mix by
introducing more products with greater power. Since July 2010 we have
reduced the production and sales of older style diesel engines and
generator sets. Additionally, as a result of the PRC government’s policy of
controlling inflation, development in infrastructure in the PRC has slowed,
which has resulted in less demand in the market and a decrease in our product
sales.
Cost
of Goods Sold
The
principal components of our cost of goods sold are costs of direct materials.
The following table sets forth a breakdown of our cost of goods sold by product
for the six months indicated:
|
Six
Months Ended December 31,
|
||||||||||||||||||||||||
|
2010
|
2009
|
Comparisons
|
||||||||||||||||||||||
|
Amount
|
%
of Cost of Goods Sold
|
Amount
|
%
of Cost of Goods Sold
|
Change
in Amount
|
Change
in
%
|
|||||||||||||||||||
|
$
|
$
|
$
|
||||||||||||||||||||||
|
Costs
of Goods Sold:
|
||||||||||||||||||||||||
|
Electricity
pumps
|
4,123,085 | 8 | % | 3,535,106 | 6 | % | 587,979 | 17 | % | |||||||||||||||
|
Multi-cylinder
pumps
|
12,913,356 | 25 | % | 9,308,518 | 15 | % | 3,604,838 | 39 | % | |||||||||||||||
|
Single-cylinder
pumps
|
969,005 | 2 | % | 1,204,487 | 2 | % | (235,482 | ) | (20 | )% | ||||||||||||||
|
Fuel
muzzles
|
2,912,647 | 6 | % | 2,764,002 | 5 | % | 148,645 | 5 | % | |||||||||||||||
|
Parts
|
364,155 | 1 | % | 367,867 | 1 | % | (3,712 | ) | (1 | )% | ||||||||||||||
|
Diesel
engines
|
20,508,904 | 40 | % | 26,630,165 | 44 | % | (6,121,261 | ) | (23 | )% | ||||||||||||||
|
Generator
sets
|
9,321,179 | 18 | % | 16,657,370 | 27 | % | (7,336,191 | ) | (44 | )% | ||||||||||||||
|
Accessories
|
255,260 | — | 123,069 | — | 132,191 | 107 | % | |||||||||||||||||
|
Total
|
51,367,591 | 100 | % | 60,590,584 | 100 | % | (9,222,993 | ) | (15 | )% | ||||||||||||||
Our cost
of goods sold decreased by 15%, or $9,222,994, to $51,367,591 for the six months
ended December 31, 2010 from $60,590,584 for the six months ended December 31,
2009. This decrease was in line with the decrease in product sales during the
same period.
- 13
-
Gross
Profit and Gross Margin
Gross
profit is equal to revenues less cost of goods sold. Gross margin is equal to
gross profit divided by revenues. The table below sets forth a breakdown of our
gross profit and gross margin by revenue source for the years
indicated:
|
Six
Months Ended December 31,
|
||||||||||||||||||||||||
|
2010
|
2009
|
|
||||||||||||||||||||||
|
Gross
Profit
|
Gross
Margin
|
Gross
Profit
|
Gross
Margin
|
Change
in Amount
|
Change
in
Gross Margin
|
|||||||||||||||||||
|
$
|
$
|
$
|
||||||||||||||||||||||
|
Gross
Profit and Gross Margin:
|
||||||||||||||||||||||||
|
Electricity
pumps
|
1,095,668 | 21 | % | 1,080,392 | 23 | % | 15,276 | (2 | )% | |||||||||||||||
|
Multi-cylinder
pumps
|
5,500,579 | 30 | % | 5,112,295 | 35 | % | 388,284 | (5 | )% | |||||||||||||||
|
Single-cylinder
pumps
|
115,617 | 11 | % | 106,730 | 8 | % | 8,887 | 3 | % | |||||||||||||||
|
Fuel
muzzles
|
359,246 | 11 | % | 782,262 | 22 | % | (423,016 | ) | (11 | )% | ||||||||||||||
|
Parts
|
8,000 | 2 | % | 39,633 | 10 | % | (31,633 | ) | (8 | )% | ||||||||||||||
|
Diesel
engines
|
2,521,300 | 11 | % | 3,604,260 | 12 | % | (1,082,960 | ) | (1 | )% | ||||||||||||||
|
Generator
sets
|
1,692,678 | 15 | % | 2,050,031 | 11 | % | (357,353 | ) | 4 | % | ||||||||||||||
|
Accessories
|
42,669 | 14 | % | 15,520 | 11 | % | 27,149 | 3 | % | |||||||||||||||
|
Less:
sales taxes
|
(16,420 | ) | — | (14,008 | ) | — | (2,412 | ) | — | |||||||||||||||
|
Total
|
11,319,337 | 18 | % | 12,777,115 | 17 | % | (1,457,778 | ) | 1 | % | ||||||||||||||
Although
our gross profit decreased by $1,457,778 to $11,319,337 for the six months ended
December 31, 2010 as compared with $12,777,115 for the six months ended December
31, 2009, our margin for the six months ended December 31, 2010 increased by 1%
from the six months ended December 31, 2009. This was mainly due to the
Company’s efforts since July 2010 to adjust its product structure by introducing
more products with higher gross margins and reducing the production and sales
scale for products of older style diesel engines and generator sets with lower
gross margins.
Selling
and Marketing Expenses
Our
selling and marketing expenses primarily include sales commissions, after-sales
services fees, payroll, travel costs and freight fees. Our selling and marketing
expenses accounted for 3% of our revenues for the six months ended December 31,
2010. Selling and marketing expenses increased by 58%, or $742,674, to
$2,025,097 for the six months ended December 31, 2010 from $1,282,423 for the
six months ended December 31, 2009. This increase was primarily due to an
increase of $473,000 in total in after-sales services fee and promotional fees
in connection with sales activities.
General
and Administrative Expenses
Our
general and administrative expenses consist primarily of bad debt provision,
payroll, consulting fees, property depreciation,
entertainment fees, office general expenses, labor insurance fees, travel costs,
land usage taxes, welfare fees and land use rights amortization.
Our
general and administrative expenses increased by 37%, or $210,893, to $773,331
for the six months ended December 31, 2010 from $562,438 for the six months
ended December 31, 2009. This increase was primarily due to the increase of
$167,798 in the aggregate in bad debt provision and accounting service charge in
connection with being a publicly traded Company. Our general and administrative
expenses were approximately 1% of revenues, which has remained stable from the
six months ended December 31, 2009.
Interest
Expense, Net
For the
six months ended December 31, 2010 and 2009, interest expense was $203,895 and
$176,936, or 0.33% and 0.24% of our revenues, respectively. Interest expense
increased by 15%, or $26,959, to $203,895 for the six months ended December 31,
2010 from $176,936 for the six months ended December 31, 2009. The increase in
interest expense was primarily attributable to an increase of $617,044 in notes
payable bearing interest.
- 14
-
Other
Income (Expense), Net
Other
income was $238,102 for the six months ended December 31, 2010 compared to other
expense of $784 for the six months ended December 31, 2009. This was primarily
due to a subsidy of $77,199 and a gain of $86,811 from waived accounts
payable.
Refunded
Value Added Tax
To honor
the Company’s on-going contributions to the local economy and its achievement of
becoming a public company in the U.S., the local tax bureau exempted the
Company’s output VAT payable of $3,258,380, which was recorded as refunded value
added tax in the accompanying condensed consolidated statements of income and
comprehensive income for the six months ended December 31, 2010.
Income
Taxes
Our
income tax expenses decreased by 3%, or $45,755, to $1,643,137 for the six
months ended December 31, 2010 from $1,688,892 for the six months ended December
31, 2009.
In
accordance with the relevant tax laws and regulations of the PRC, the applicable
corporate income tax rate for Hengyuan is 25%. In 2010 and 2009,
Jinma and Huaxin were defined by the local tax bureau as tax payers subject to
the “Verification Collection” method, according to which the amount of income
taxes paid is determined by the local tax bureau based on certain criteria
instead of applying the CIT rate of 25%. Therefore, the amount of income tax
assessed for Jinma and Huaxin under this Verification Collection method differed
from the normal computation by applying the CIT rate of 25%. Our effective
tax rate was 13% and 16% for the six months ended December 31, 2010 and 2009,
respectively.
Net
Income
Primarily
as a result of the foregoing, our net income increased by 19%, or $1,692,782, to
$10,833,333 for the six months ended December 31, 2010 from $9,140,551 for the
six months ended December 31, 2009.
Liquidity
and Capital Resources
We
generally finance our operations through our operating profit and borrowings
from banks. During the reporting periods, we arranged a number of bank loans to
satisfy our financing needs. As of the date of this report, we have not
experienced any difficulty in raising funds through bank loans, and we have not
experienced any liquidity problems in settling our payables in the normal course
of business and repaying our bank loans when they are due. We believe that the
Company has adequate funds and capital with respect to conducting its business
over the next twelve months.
The
following table sets forth a summary of our cash flows for the periods
indicated:
|
Six
months ended December 31,
|
||||||||
|
2010
|
2009
|
|||||||
|
$
|
$
|
|||||||
|
Net
cash provided by operating activities
|
1,690,471 | 13,125,252 | ||||||
|
Net
cash (used in) investing activities
|
(3,455,036 | ) | (14,183,185 | ) | ||||
|
Net
cash (used in) provided by financing activities
|
(464,207 | ) | 994,751 | |||||
|
Net
(decrease) in cash and cash equivalents
|
(2,228,772 | ) | (63,182 | ) | ||||
|
Effect
of exchange rate changes on cash
|
1,740,813 | 55,205 | ||||||
|
Cash
and cash equivalents at beginning of period
|
3,399,360 | 127,576 | ||||||
|
Cash
and cash equivalents at end of period
|
2,911,401 | 119,599 | ||||||
We
believe that the level of financial resources is a significant factor for our
future development and accordingly, we may determine from time to time to raise
capital through private debt or equity financing to strengthen the Company’s
financial position, to expand our facilities and to provide us with additional
flexibility to take advantage of business opportunities. No assurances can be
given that we will be successful in raising such additional capital on terms
acceptable to us.
- 15
-
Liquidity
Operating
Activities
Net cash
provided by operating activities primarily consists of net income, as adjusted
by bad debt expense, depreciation and amortization, deferred income taxes, gain
or loss on disposal of property, and changes in operating assets and
liabilities such as accounts receivable, prepayments, deposits and other
receivables, due from employees and related parties, inventories, account
payable, notes payable, advances from customers, other payables and accrued
liabilities and income taxes payable.
Net cash
provided by operating activities was $1,690,471 for the six months ended
December 31, 2010, which is primarily attributable to our net income of
$10,833,333, adjusted by increased in value added tax payable of $10,052,818 and
increase in taxes payable of $1,459,542, offset by decrease in accounts
receivable of $8,636,128, decrease in inventories of $8,866,033, decrease in refunded value added
tax of $3,258,380 and decrease in prepayments for goods of
$1,348,151.
Net cash
provided by operating activities was $13,125,252 for the six months ended
December 31, 2009, which is primarily attributable to our net income of
$9,140,551, adjusted by an increase in accounts payable of $636,349, an increase
in value added tax payable of $12,188,453 and an increase in taxes payable of
$1,693,117, offset by a decrease in accounts receivable of $809,078, a decrease
in inventories of $8,353,060 and a decrease in other payable of
$680,197.
Investing
Activities
Net cash
used in investing activities primarily consists of purchases of plant and
equipment, purchases of construction in progress, and notes
receivable.
Net cash
used in investing activities was $3,455,036 for the six months ended December
31, 2010, which is primarily attributable to increase in issuance of notes
receivable of $47,738,078, offset by a decrease in repayment of notes receivable
of $44,414,853.
Net cash
used in investing activities was $14,183,185 for the six months ended December
31, 2009, which is primarily attributable to an increase in issuance of notes
receivable of $64,904,916 and an increase in purchases of construction in
progress of $682,561, offset by a decrease in repayment of notes receivable of
$51,499,380.
Financing
Activities
Net cash
used in/provided by financing activities primarily consists of proceeds from
short-term loans, repayments of short-term loans, repayments of notes payable,
proceeds from notes payable and repayment of long-term debt.
Net cash
used in financing activities was $464,207 for the six months ended December 31,
2010, which is primarily attributable to an increase in repayments of short-term
loans of $1,725,248, offset by a decrease in proceeds from short-term loans of
$743,641 and a decrease in proceeds from notes payable of $654,601.
Net cash
provided by financing activities was $994,751 for the six months ended December
31, 2009, which is primarily attributable to an increase in proceeds from
short-term loans of $2,923,558 and an increase in proceeds from notes payable of
$1,527,559, offset by a decrease in repayments of short-term loans of $2,335,923
and a decrease in repayments of note payable of $1,018,846.
Working
Capital
Working
capital is current liabilities deducted from current assets.
- 16
-
Our
working capital was $63,219,425 for the six months ended December 31, 2010, as
compared with $50,735,680 for the year ended June 30, 2010, which is primarily
attributable to an increase in cash and cash equivalents of $2,911,401, an
increase in accounts receivable of $68,920,330, an increase in inventories of
$14,450,349, an increase in notes receivable of $4,026,283 and an increase in
prepayments for goods of $5,170,271, offset by a decrease in accounts payable of
$5,121,746, a decrease in short-term bank loans of $1,966,182, a decrease in
notes payable of $1,632,031, a decrease in income tax payable of $6,449,705, a
decrease in other payables of $1,063,228 and a decrease in value added tax
payable of $13,726,279.
Contractual
Obligations
We have
certain fixed contractual obligations and commitments that include future
estimated payments. Changes in our business needs, cancellation provisions,
changing interest rates, and other factors may result in actual payments
differing from the estimates. We cannot provide certainty regarding the timing
and amounts of payments. We have presented below a summary of the most
significant assumptions used in our determination of amounts presented in the
tables, in order to assist in the review of this information within the context
of our consolidated financial position, results of operations, and cash
flows.
The
following tables summarize our contractual obligations as of December 31, 2010,
and the effect these obligations are expected to have on our liquidity and cash
flows in future periods.
|
Payments
Due by Period
|
||||||||||||
|
|
Total
|
Less
than
1
year
|
Over
1 year
|
|||||||||
|
Contractual
Obligations:
|
|
|
|
|||||||||
|
Bank
Indebtedness
|
$ | 1,966,182 | $ | 1,966,182 | $ | — | ||||||
|
Notes
payable
|
1,907,363 | 1,632,031 | 275,332 | |||||||||
|
Construction
In Processing
|
571,781 | 571,781 |
—
|
|||||||||
|
Total
Contractual Obligations:
|
$ | 4,445,326 | $ | 4,169,994 | $ | 275,332 | ||||||
Bank
indebtedness consists of secured and unsecured borrowings from Industrial and
Commercial Bank of China, Rural Credit Cooperative, Bank of Communications,
Weifang Bank, China Construction Bank and Bank of China.
Notes
payable includes loan from an unrelated individual and related
individuals.
The
Company has a capital commitment of approximately $571,781 for the construction
of the new production line in connection with the new plant as of December 31,
2010.
On May
15, 2003, Hengyuan entered into a guarantee contract to serve as guarantor for
the bank loans borrowed by Mr. Liu Dianjun, a shareholder and officer of the
Company, from Industrial and Commercial Bank of China with a guarantee amount of
$47,614. Under this guarantee contract, a land use right and an office
building of Hengyuan were pledged for the bank loans.
On August
4, 2009, Hengyuan entered into a guarantee contract to serve as guarantor for
bank loans borrowed by Mr. Li Zengshan, a shareholder and officer of the
Company, from the Industrial and Commercial Bank of China with a guarantee
amount of $347,589. Under this guarantee contract, a land use right and an
office building of Hengyuan were pledged for the bank loans.
Off-Balance
Sheet Commitments and Arrangements
Other
than the arrangement described above, as of December 31, 2010, we do not have
any outstanding derivative financial instruments, off-balance sheet guarantees,
interest rate swap transactions of foreign currency forward contracts.
Furthermore, we do not have any retained or contingent interest in assets
transferred to an unconsolidated entity that serves as credit, liquidity or
market risk support to such entity. We do not have any variable interest in an
unconsolidated entity that provides financing, liquidity, market risk or credit
support to us or that engages in leasing, hedging or research and development
services with us.
- 17
-
ITEM
3. QUANTITATIVE AND QUALITATIVE DISCLOSURES ABOUT MARKET RISK
The
Company is Subject to Special Considerations do to its Operations in the
PRC
The
Company’s operations are conducted in the PRC. Accordingly, the Company’s
business, financial condition and results of operations may be influenced by the
political, economic and legal environment in the PRC, and by the general state
of the PRC economy.
The
Company’s operations in the PRC are subject to special considerations and
significant risks not typically associated with companies in North America and
Western Europe. These include risks associated with, among others, the
political, economic and legal environment and foreign currency exchange. The
Company’s results may be adversely affected by changes in the political and
social conditions in the PRC, and by changes in governmental policies with
respect to laws and regulations, anti-inflationary measures, currency
conversion, remittances abroad, and rates and methods of taxation, among other
things.
ITEM
4. CONTROLS AND PROCEDURES
Disclosure
Controls and Procedures
Under the
supervision and with the participation of our management, including our
principal executive officer and principal financial officer, we conducted an
evaluation of the effectiveness of the design and operation of our disclosure
controls and procedures, as defined in Rule 13a-15(e) under the Exchange Act, as
of the end of the fiscal quarter covered by this report. Based on this
evaluation, our management, including our principal executive officer and our
principal financial officer, concluded that our disclosure controls and
procedures were effective as of December 31, 2010, to ensure that information
required to be disclosed by us in the reports filed or submitted by us under the
Exchange Act (i) is recorded, processed, summarized and reported within the time
period specified in SEC rules and forms, and (ii) is accumulated and
communicated to our management, including our principal executive officer and
our principal financial officer, as appropriate to allow appropriate decisions
on a timely basis regarding required disclosure.
Internal
Control over Financial Reporting
There
were no changes in internal control over financial reporting that occurred
during the fiscal quarter ended December 31, 2010 that have materially affected,
or are reasonably likely to materially affect, our internal control over
financial reporting.
PART
II
OTHER
INFORMATION
ITEM
1. LEGAL PROCEEDINGS
In the
normal course of business, we are named as defendant in lawsuits in which claims
are asserted against us. In our opinion, the liabilities, if any, which may
ultimately result from such lawsuits, are not expected to have a material
adverse effect on our financial position, results of operations or cash flows.
As of December 31, 2010, there was no pending or outstanding material litigation
with the Company.
- 18
-
ITEM
1A. RISK FACTORS
Not
required for a "smaller reporting company".
ITEM
2. UNREGISTERED SALES OF EQUITY SECURITIES AND USE OF PROCEEDS
During
the quarter ended December 31, 2010, the Company had no unregistered sales of
equity securities.
ITEM
3. DEFAULTS UPON SENIOR SECURITIES
None.
ITEM
4. (REMOVED AND RESERVED)
ITEM
5. OTHER INFORMATION
None.
ITEM
6. EXHIBITS
(a) Exhibits
|
EXHIBIT
NO.
|
|
DESCRIPTION
|
|
LOCATION
|
|
2.1
|
Share
Exchange Agreement, dated December 28, 2009, by and between the Company,
Jolly Promise Limited and Welldone Pacific Limited
|
Incorporated
by reference to Exhibit 2.1 to the Company’s Current Report on
Form 8-K as filed with the SEC on December 29, 2009
|
||
|
3.1
|
Articles
of Incorporation of the Company
|
Incorporated
by reference to Exhibit 3.1 to the Company’s General Form for Registration
of Securities on Form 10 as filed with the SEC on May 15,
2009
|
||
|
3.2
|
Amended
and Restated Bylaws of the Company
|
Incorporated
by reference to Exhibit 3.1 to the Company’s Current Report on Form 8-K as
filed with the SEC on September 21, 2010
|
||
|
3.3
|
Memorandum
and Articles of Association of Jolly Promise Limited, dated July 2,
2008
|
Incorporated
by reference to Exhibit 3.3 to the Company’s Current Report on Form 8-K as
filed with the SEC on December 29, 2009
|
||
|
3.4
|
Certificate
of Incorporation of Jolly Promise Limited
|
Incorporated
by reference to Exhibit 3.4 to the Company’s Current Report on Form 8-K as
filed with the SEC on December 29, 2009
|
||
|
10.1
|
Stock
Purchase Agreement between Shaun Carter and the company dated
December 28, 2009
|
Incorporated
by reference to Exhibit 10.1 to the Company’s Current Report on Form 8-K
as filed with the SEC on December 29, 2009
|
||
|
14.1
|
Code
of Business Conduct and Ethics
|
Incorporated
by reference to Exhibit 14.1 to the Company’s Current Report on Form 8-K
as filed with the SEC on September 21, 2010
|
||
- 19
-
|
16.1
|
Letter
Regarding Change in Certifying Accountant
|
Incorporated
by reference to Exhibit 16.1 to the Company’s Current Report on Form 8-K
as filed with the SEC on February 9, 2010
|
||
|
21
|
List
of Subsidiaries of the Company
|
Incorporated
by reference to Exhibit 21 to the Company’s Current Report on Form 8-K as
filed with the SEC on December 29, 2009
|
||
|
22
|
Published
Report Regarding Matter Submitted to Vote of Security Holders Regarding
Name Change of the Company
|
Incorporated
by reference to the Company’s Current Report on Form 8-K as field with the
SEC on April 28, 2010
|
||
|
31.1
|
Certifications
of the Chief Executive Officer pursuant to Section 302 of the
Sarbanes-Oxley Act of 2002
|
Provided
herewith
|
||
|
31.2
|
Certifications
of the Chief Financial Officer pursuant to Section 302 of the
Sarbanes-Oxley Act of 2002
|
Provided
herewith
|
|
32.1
|
Certification
Pursuant To 18 U.S.C. Section 1350, As Adopted Pursuant To Section 906 of
the Sarbanes-Oxley Act Of 2002
|
Provided
herewith
|
||
|
32.2
|
Certification
Pursuant To 18 U.S.C. Section 1350, As Adopted Pursuant To Section 906 of
the Sarbanes-Oxley Act Of 2002
|
Provided
herewith
|
||
|
99.1
|
Audit
Committee Charter
|
Incorporated
by reference to Exhibit 99.1 to the Company’s Current Report on Form 8-K
as filed with the SEC on September 21, 2010
|
||
|
99.2
|
Compensation
Committee Charter
|
Incorporated
by reference to Exhibit 99.2 to the Company’s Current Report on Form 8-K
as filed with the SEC on September 21, 2010
|
||
|
99.3
|
Corporate
Governance and Nominating Committee Charter
|
Incorporated
by reference to Exhibit 99.3 to the Company’s Current Report on Form 8-K
as filed with the SEC on September 21, 2010
|
||
|
99.4
|
Related
Person Transaction Policy
|
Incorporated
by reference to Exhibit 99.3 to the Company’s Current Report on Form 8-K
as filed with the SEC on September 21, 2010
|
||
|
99.5
|
Written
Disclosure Policy
|
Incorporated
by reference to Exhibit 99.5 to the Company’s Annual Report on Form 10-K
as filed with the SEC on September 28,
2010
|
- 20
-
SIGNATURES
Pursuant
to the requirements of Section 13 or 15 (d) of the Securities Exchange Act of
1934, as amended, the Registrant has duly caused this Quarterly Report on Form
10-Q report to be signed on its behalf by the undersigned, thereunto duly
authorized.
|
Date: February
14, 2011
|
By:
|
/s/
Dianjun Liu
|
|
|
Name:
Dianjun Liu
|
|||
|
Its:
President, Chief Executive
Officer
and Principal Executive
Officer
|
|||
|
Date: February
14, 2011
|
By:
|
/s/
Chenglin Wang
|
|
|
Name:
Chenglin Wang
|
|||
|
Its:
Chief Financial Officer,
Corporate
Secretary, and Principal
Financial
and Accounting Officer
|
|||
- 21
-