Attached files
| file | filename |
|---|---|
| EX-32.2 - EX-32.2 - Bohai Pharmaceuticals Group, Inc. | v211017_ex32-2.htm |
| EX-31.2 - EX-31.2 - Bohai Pharmaceuticals Group, Inc. | v211017_ex31-2.htm |
| EX-31.1 - EX-31.1 - Bohai Pharmaceuticals Group, Inc. | v211017_ex31-1.htm |
| EX-32.1 - EX-32.1 - Bohai Pharmaceuticals Group, Inc. | v211017_ex32-1.htm |
UNITED
STATES
SECURITIES
AND EXCHANGE COMMISSION
Washington,
D.C. 20549
FORM
10-Q
|
x
|
QUARTERLY REPORT PURSUANT TO
SECTION 13 OR 15(d) OF THE SECURITIES EXCHANGE ACT OF
1934
|
For the
quarterly period ended December 31, 2010
|
¨
|
TRANSITION REPORT PURSUANT TO
SECTION 13 OR 15(d) OF THE SECURITIES EXCHANGE ACT OF
1934
|
For the
transition period from _______________ to _______________
Commission
File Number: 000-53401
Bohai Pharmaceuticals Group,
Inc.
(Exact
name of registrant as specified in its charter)
|
Nevada
(State
or other jurisdiction of
incorporation
or organization)
|
98-0588402
(I.R.S.
Employer Identification
No.)
|
|
c/o
Yantai Bohai Pharmaceuticals Group Co. Ltd.
No.
9 Daxin Road, Zhifu District
Yantai,
Shandong Province, China
|
264000
|
|
(Address
of principal executive offices)
|
(Zip
Code)
|
Registrant’s
telephone number (including area
code): +86(535)-685-7928
Indicate
by check mark whether the registrant (1) has filed all reports required to be
filed by Section 13 or 15(d) of the Securities Exchange Act of 1934 during the
preceding 12 months (or for such shorter period that the registrant was required
to file such reports), and (2) has been subject to such filing requirements for
the past 90 days. Yes x No
¨
Indicate
by check mark whether the registrant is a large accelerated filer, an
accelerated filer, or a non-accelerated filer or a smaller reporting
company. See definition of “large accelerated filer”, “accelerated
filer” and “smaller reporting company” in Rule 12b-2 of the Exchange Act.
(Check one):
|
Large
accelerated filer ¨
|
Accelerated
filer ¨
|
|
|
Non-accelerated
filer ¨
|
Smaller
reporting company x
|
|
|
(Do
not check if a smaller reporting company)
|
Indicate by check mark whether the
registrant is a shell company (as defined in Rule 12b-2 of the Exchange
Act). Yes ¨ No x
Indicate
by check mark whether the registrant has submitted electronically and posted on
its corporate Website, if any, every Interactive Date File required to be
submitted and posted pursuant to Rule 405 of Regulation S-T (§232.405 of this
chapter) during the preceding 12 months (or for such shorter period that the
registrant was required to submit and post such
files). ¨
As of
February 11, 2011, there were 16,977,221 shares of company common stock issued
and outstanding.
Bohai
Pharmaceuticals Group, Inc.
Quarterly
Report on Form 10-Q
TABLE
OF CONTENTS
|
PART
I – FINANCIAL INFORMATION
|
||
|
Cautionary
Note Regarding Forward-Looking Statements
|
||
|
Item
1.
|
Financial
Statements (unaudited)
|
|
|
Condensed
Consolidated Balance Sheets as of December 31, 2010 and June 30, 2010
(audited)
|
1
|
|
|
Condensed
Consolidated Statements of Income and Comprehensive Income for Three and
Six Months ended December 31, 2009 and 2010
|
2
|
|
|
Condensed
Consolidated Statements of Changes in Stockholders’ Equity for the
Six Months
Ended December 31, 2010
|
3
|
|
|
Condensed
Consolidated Statements of Cash Flows for Six Months ended December 31,
2009 and 2010
|
4
|
|
|
Notes
to Condensed Consolidated Financial Statements
|
5
|
|
|
Item
2.
|
Management’s
Discussion and Analysis of Financial Condition and Results of
Operations
|
31
|
|
Item
3.
|
Quantitative
and Qualitative Disclosures About Market Risk
|
44
|
|
Item
4(T).
|
Controls
and Procedures
|
44
|
|
PART
II – OTHER INFORMATION
|
||
|
Item
1.
|
Legal
Proceedings
|
46
|
|
Item
2.
|
Unregistered
Sales of Equity Securities and Use of Proceeds
|
46
|
|
Item
3.
|
Defaults
Upon Senior Securities
|
46
|
|
Item
4.
|
Removed
and Reserved
|
46
|
|
Item
5.
|
Other
Information
|
46
|
|
Item
6.
|
Exhibits
|
46
|
|
SIGNATURES
|
47
|
|
CAUTIONARY
NOTE REGARDING FORWARD-LOOKING STATEMENTS
In
addition to historical information, this Quarterly Report on Form 10-Q contains
forward looking statements within the meaning of the Private Securities
Litigation Reform Act of 1995. These forward-looking statements are
subject to certain risks and uncertainties that could cause actual results to
differ materially from those reflected in such forward-looking statements.
We cannot give any guarantee that the plans, intentions or expectations
described in the forward looking statements will be achieved. All
forward-looking statements involve significant risks and uncertainties, and
actual results may differ materially from those discussed in the forward-looking
statements as a result of various factors, including those factors described in
the “Risk Factors” section of our Annual Report for the fiscal year ended June
30, 2010 (the “2010 10-K”). Readers should carefully review such risk
factors as well as factors described in other documents that we file from time
to time with the Securities and Exchange Commission.
In some
cases, you can identify forward-looking statements by terminology such as
“guidance,” “may,” “will,” “should,” “expects,” “plans,” “anticipates,”
“believes,” “estimates,” “predicts,” “projects,” “potential,” “proposed,”
“intended,” or “continue” or the negative of these terms or other comparable
terminology. You should read statements that contain these words
carefully, because they discuss our expectations about our future operating
results or our future financial condition or state other “forward-looking”
information. There may be events in the future that we are not able to
accurately predict or control. You should be aware that the occurrence of
any of the events described in our risk factors and other disclosures could
substantially harm our business, results of operations and financial condition,
and that upon the occurrence of any of these events, the trading price of our
securities could decline. Although we believe that the expectations
reflected in the forward-looking statements are reasonable, we cannot guarantee
future results, growth rates, and levels of activity, performance or
achievements. Factors that may cause actual results, our performance or
achievements, or industry results, to differ materially from those contemplated
by such forward-looking statements include, without limitation:
|
|
·
|
our
ability to obtain sufficient working capital to support our business
plans;
|
|
|
·
|
our
ability to expand our product offerings and maintain the quality of our
products;
|
|
|
·
|
the
availability of Chinese government granted rights to exclusively
manufacture or co-manufacture our
products;
|
|
|
·
|
the
availability of Chinese national healthcare reimbursement of our
products;
|
|
|
·
|
our
ability to manage our expanding operations and continue to fill customers’
orders on time;
|
|
|
·
|
our
ability to maintain adequate control of our expenses allowing us to
realize anticipated revenue growth;
|
|
|
·
|
our
ability to maintain or protect our intellectual
property;
|
|
|
·
|
our
ability to maintain our proprietary
technology;
|
|
|
·
|
the
impact of government regulation in China and elsewhere, including the
support provided by the Chinese government to the Traditional Chinese
Medicine and healthcare sectors in
China;
|
|
|
·
|
our
ability to implement product development, marketing, sales and acquisition
strategies and adapt and modify them as
needed;
|
|
|
·
|
our
ability to integrate any future
acquisitions;
|
|
|
·
|
our
implementation of required financial, accounting and disclosure controls
and procedures and related corporate governance policies;
and
|
|
|
·
|
our
ability to anticipate and adapt to changing conditions in the Traditional
Chinese Medicine and healthcare industries resulting from changes in
government regulations, mergers and acquisitions involving our
competitors, technological developments and other significant competitive
and market dynamics.
|
Readers
are cautioned not to place undue reliance on our forward-looking statements,
which reflect management’s opinions only as of the date thereof. We
undertake no obligation to revise or publicly release the results of any
revision of our forward-looking statements, except as required by
law.
BOHAI
PHARMACEUTICALS GROUP, INC. AND SUBSIDIARIES
CONDENSED
CONSOLIDATED BALANCE SHEETS
AS
OF DECEMBER 31, 2010 AND JUNE 30, 2010
|
Notes
|
As of
December 31,
2010
|
As of
June 30,
2010
|
||||||||
|
|
(unaudited)
|
|||||||||
|
ASSETS
|
||||||||||
|
Current
assets:
|
||||||||||
|
Cash
and cash equivalents
|
$ | 12,422,418 | $ | 17,149,082 | ||||||
|
Restricted
cash
|
2,151,068 | 576,019 | ||||||||
|
Accounts
receivable
|
14,505,908 | 10,409,527 | ||||||||
|
Other
receivables and prepayments
|
4
|
2,073,434 | 1,449,590 | |||||||
|
Amount
due from equity holder
|
5
|
- | 40,160 | |||||||
|
Inventories
|
6
|
1,898,099 | 748,422 | |||||||
|
Total
current assets
|
33,050,927 | 30,372,801 | ||||||||
|
Non-current
assets:
|
||||||||||
|
Property,
plant and equipment, net
|
8
|
7,957,796 | 7,895,042 | |||||||
|
Prepayment
for land use right
|
19
|
12,426,268 | 7,343,654 | |||||||
|
Intangible
assets
|
7
|
25,118,727 | 17,342,772 | |||||||
|
Deferred
fees on convertible notes
|
14
|
956,552 | 1,562,617 | |||||||
|
Total
non-current assets
|
46,459,343 | 34,144,085 | ||||||||
|
TOTAL
ASSETS
|
$ | 79,510,270 | $ | 64,516,886 | ||||||
|
LIABILITIES
AND STOCKHOLDERS’ EQUITY
|
||||||||||
|
Current
liabilities:
|
||||||||||
|
Accounts
payable
|
$ | 1,667,360 | $ | 741,621 | ||||||
|
Other
accrued liabilities
|
12
|
10,414,405 | 2,984,988 | |||||||
|
Amount
due to equity holder
|
11,980 | - | ||||||||
|
Income
taxes payable
|
18
|
1,416,227 | 700,326 | |||||||
|
Short-term
borrowings
|
9
|
899,906 | 4,398,849 | |||||||
|
Total
current liabilities
|
14,409,878 | 8,825,784 | ||||||||
|
Non-current
liabilities
|
||||||||||
|
Derivative
liabilities - investor and agent warrants
|
13
|
2,563,443 | 5,481,928 | |||||||
|
Convertible
notes, net of discount
|
13
|
213,938 | 124,820 | |||||||
|
Total
non-current liabilities
|
2,777,381 | 5,606,748 | ||||||||
|
TOTAL
LIABILITIES
|
17,187,259 | 14,432,532 | ||||||||
|
STOCKHOLDERS'
EQUITY
|
||||||||||
|
Common
stock , $0.001 par value, 150,000,000 shares authorized, 16,977,221 and
16,500,000 shares issued and outstanding as of December 31,
2010 and June 30, 2010, respectively
|
10
|
16,977 | 16,500 | |||||||
|
Additional
paid-in capital
|
10
|
16,272,889 | 15,317,621 | |||||||
|
Accumulated
other comprehensive income
|
2,356,126 | 626,584 | ||||||||
|
Statutory
reserves
|
21
|
2,201,817 | 2,201,817 | |||||||
|
Retained
earnings
|
41,475,202 | 31,921,832 | ||||||||
|
Total
stockholders’ equity
|
62,323,011 | 50,084,354 | ||||||||
|
TOTAL
LIABILITIES AND STOCKHOLDERS' EQUITY
|
$ | 79,510,270 | $ | 64,516,886 | ||||||
See
accompanying notes to the unaudited condensed consolidated financial
statements
1
BOHAI
PHARMACEUTICALS GROUP, INC. AND SUBSIDIARIES
CONDENSED
CONSOLIDATED STATEMENTS OF INCOME AND COMPREHENSIVE INCOME
FOR
THE SIX MONTHS ENDED DECEMBER 31, 2010 AND 2009
(UNAUDITED)
|
For The Three Months Ended
|
For The Six Months Ended
|
|||||||||||||||||
|
December 31,
|
December 31,
|
|||||||||||||||||
|
Notes
|
2010
|
2009
|
2010
|
2009
|
||||||||||||||
|
Net
revenues
|
$ | 22,204,348 | $ | 16,846,303 | $ | 39,233,996 | $ | 30,800,317 | ||||||||||
|
Cost
of revenues
|
( 4,681,045 | ) | ( 2,662,427 | ) | (8,128,311 | ) | (4,879,940 | ) | ||||||||||
|
Gross
profit
|
17,523,303 | 14,183,876 | 31,105,685 | 25,920,377 | ||||||||||||||
|
Selling,
general and administrative expenses
|
16
|
(11,105,260 | ) | (9,813,217 | ) | (19,720,019 | ) | (19,069,289 | ) | |||||||||
|
Income
from operations
|
6,418,043 | 4,370,659 | 11,385,666 | 6,851,088 | ||||||||||||||
|
Other
income (expenses)
|
||||||||||||||||||
|
Other
income
|
701 | 40,322 | 701 | 20,125 | ||||||||||||||
|
Interest
income
|
15,289 | - | 29,497 | - | ||||||||||||||
|
Amortization
of deferred financing fees
|
(244,059 | ) | - | (504,024 | ) | - | ||||||||||||
|
Interest
expense
|
17
|
(1,155,307 | ) | (51,814 | ) | (1,649,346 | ) | (149,594 | ) | |||||||||
|
Other
expenses
|
1,192 | (23,738 | ) | (1,922 | ) | (29,003 | ) | |||||||||||
|
Change
in fair value of derivative liabilities
|
2,949,039 | - | 2,918,485 | - | ||||||||||||||
|
Total
other income (expenses)
|
1,566,855 | (35,230 | ) | 793,390 | (158,472 | ) | ||||||||||||
|
Income
before provision for income taxes
|
7,984,898 | 4,335,429 | 12,179,056 | 6,692,616 | ||||||||||||||
|
Provision
for income taxes
|
18
|
(1,444,003 | ) | (1,057,890 | ) | (2,625,686 | ) | (1,613,261 | ) | |||||||||
|
Net
income
|
$ | 6,540,895 | $ | 3,277,539 | $ | 9,553,370 | $ | 5,079,355 | ||||||||||
|
Comprehensive
income:
|
||||||||||||||||||
|
Net
income
|
$ | 6,540,895 | $ | 3,277,539 | $ | 9,553,370 | $ | 5,079,355 | ||||||||||
|
Other
comprehensive income:
|
||||||||||||||||||
|
Unrealized
foreign currency translation gain
|
803,074 | 978 | 1,729,542 | 48,561 | ||||||||||||||
|
Comprehensive
income
|
$ | 7,343,969 | $ | 3,278,517 | $ | 11,282,912 | $ | 5,127,916 | ||||||||||
|
Earnings
per common share
|
||||||||||||||||||
|
Basic
|
11
|
$ | 0.39 | $ | 0.25 | $ | 0.57 | $ | 0.39 | |||||||||
|
Diluted
|
$ | 0.31 | $ | 0.25 | $ | 0.45 | $ | 0.39 | ||||||||||
|
Weighted
average common shares outstanding
|
||||||||||||||||||
|
Basic
|
11
|
16,925,928 | 13,162,500 | 16,716,691 | 13,162,500 | |||||||||||||
|
Diluted
|
22,266,662 | 13,162,500 | 22,258,835 |
13,162,500
|
||||||||||||||
See
accompanying notes to the unaudited condensed consolidated financial
statements
2
BOHAI
PHARMACEUTICALS GROUP, INC. AND SUBSIDIARIES
CONDENSED
CONSOLIDATED STATEMENTS OF CHANGES IN STOCKHOLDERS’ EQUITY
FOR
THE SIX MONTHS ENDED DECEMBER 31, 2010
(UNAUDITED)
|
Accumulated
|
||||||||||||||||||||||||||||
|
Common stock
|
Additional
|
other
|
||||||||||||||||||||||||||
|
Shares
|
paid-in
|
comprehensive
|
Statutory
|
Retained
|
||||||||||||||||||||||||
|
outstanding
|
Amount
|
capital
|
income
|
reserves
|
Earnings
|
Total
|
||||||||||||||||||||||
|
Balance
at June 30, 2010
|
16,500,000 | $ | 16,500 | $ | 15,317,621 | $ | 626,584 | $ | 2,201,817 | $ | 31,921,832 | $ | 50,084,354 | |||||||||||||||
|
Net
income for the period
|
9,553,370 | 9,553,370 | ||||||||||||||||||||||||||
|
Stock
based compensation
|
79,500 | 79,500 | ||||||||||||||||||||||||||
|
Option
based compensation
|
23,844 | 23,844 | ||||||||||||||||||||||||||
|
Conversion
of convertible notes
|
477,221 | 477 | 851,924 | 852,401 | ||||||||||||||||||||||||
|
Foreign
currency translation difference
|
1,729,542 | 1,729,542 | ||||||||||||||||||||||||||
|
Balance
at December 31, 2010
|
16,977,221 | $ | 16,977 | $ | 16,272,889 | $ | 2,356,126 | $ | 2,201,817 | $ | 41,475,202 | $ | 62,323,011 | |||||||||||||||
See
accompanying notes to the unaudited condensed consolidated financial
statements
3
BOHAI
PHARMACEUTICALS GROUP, INC. AND SUBSIDIARIES
CONDENSED
CONSOLIDATED STATEMENTS OF CASH FLOWS
FOR
THE SIX MONTHS ENDED DECEMBER 31, 2010 AND 2009
(UNAUDITED)
|
For The Six Months Ended
|
||||||||
|
December 31,
|
||||||||
|
2010
|
2009
|
|||||||
|
Cash
flows from operating activities
|
||||||||
|
Net
income
|
$ | 9,553,370 | $ | 5,079,355 | ||||
|
Adjustments
to reconcile net income to net cash used in operating
activities:
|
||||||||
|
Depreciation
|
172,730 | 341,868 | ||||||
|
Loss
on disposal of property, plant and equipment
|
1,895 | 3,655 | ||||||
|
Accretion
of beneficial conversion feature
|
933,094 | - | ||||||
|
Amortization
of deferred fees on convertible notes
|
504,024 | - | ||||||
|
Interest
expense on convertible notes
|
110,466 | - | ||||||
|
Change
in fair value of warrants
|
(2,918,485 | ) | - | |||||
|
Stock
based compensation
|
103,344 | - | ||||||
|
Changes
in operating assets and liabilities:
|
||||||||
|
(Increase)
in accounts receivable
|
(3,724,323 | ) | (684,497 | ) | ||||
|
(Increase)/decrease
in other receivables and prepayments
|
(571,675 | ) | 1,257,905 | |||||
|
(Increase)
in inventories
|
(1,108,642 | ) | (464,670 | ) | ||||
|
Increase
in accrued liabilities
|
150,726 | 930,686 | ||||||
|
(Decrease)/increase
in accounts payable
|
888,629 | (216,150 | ) | |||||
|
Increase
in other payable
|
1,064,563 | - | ||||||
|
Increase
in income taxes payable
|
683,491 | 400,135 | ||||||
|
Increase
in restricted cash
|
299,069 | - | ||||||
|
Net
cash provided by operating activities
|
6,142,276 | 6,648,287 | ||||||
|
Cash
flows used in investing activities
|
||||||||
|
Purchases
of property, plant and equipment
|
(9,711 | ) | (238,431 | ) | ||||
|
Proceeds
from disposal of property, plant and equipment
|
4,462 | 2,925 | ||||||
|
Purchase
of leased land use rights
|
(4,783,102 | ) | - | |||||
|
Purchase
of intangible assets
|
(2,974,566 | ) | - | |||||
|
Net
cash used in investing activities
|
(7,762,917 | ) | (235,506 | ) | ||||
|
Cash
flows from financing activities
|
||||||||
|
Proceeds
from borrowings
|
884,933 | 3,073,365 | ||||||
|
Repayment
of borrowings
|
(4,454,413 | ) | (4,541,500 | ) | ||||
|
Repayment
from related party
|
52,799 | - | ||||||
|
Contributed
capital
|
- | 5,970 | ||||||
|
Proceeds
of note payable
|
- | 400,000 | ||||||
|
Net
cash flows used in financing activities
|
(3,516,681 | ) | (1,062,165 | ) | ||||
|
Effect
of foreign currency translation on cash and cash
equivalents
|
410,659 | 48,126 | ||||||
|
Net
(decrease) increase in cash and cash equivalents
|
(4,726,664 | ) | 5,398,742 | |||||
|
Cash
and cash equivalents at beginning of period
|
17,149,082 | 2,494,166 | ||||||
|
Cash
and cash equivalents at end of period
|
$ | 12,422,418 | $ | 7,892,908 | ||||
|
Cash
paid during the period for:
|
||||||||
|
Interest
paid
|
$ | 583,047 | $ | 200,068 | ||||
|
Income
taxes paid
|
$ | 1,942,195 | $ | 1,233,901 | ||||
|
Non-cash
investing and financing activities:
|
||||||||
|
Common
stock issued upon conversion of convertible notes and accrued
interest
|
$ | 852,401 | $ | - | ||||
|
Deposits
received from investors for future financing included in restricted
cash
|
$ | 1,874,117 | $ | - | ||||
|
Purchase
of intangible assets has not been paid and included in Other Payable as of
December 31, 2010
|
$ | 4,234,853 | $ | - | ||||
See
accompanying notes to the unaudited condensed consolidated financial
statements
4
BOHAI
PHARMACEUTICALS GROUP, INC. AND SUBSIDIARIES
NOTES
TO UNAUDITED CONDENSED CONSOLIDATED FINANCIAL STATEMENTS
FOR
THE THREE AND SIX MONTHS ENDED DECEMBER 31, 2010 AND 2009
1.
ORGANIZATION AND PRINCIPAL
ACTIVITIES
Bohai
Pharmaceuticals Group, Inc., or the Company (formerly known as Link Resources,
Inc.), was incorporated under the laws of the State of Nevada on January 9,
2008. Until January 5, 2010, our principal office was located in Calgary,
Alberta, Canada. Prior to January 5, 2010, we were a public “shell”
company in the exploration stage since our formation had not yet realized any
revenues from our planned operations.
Pursuant
to a Share Exchange Agreement, dated January 5, 2010 (the “Share Exchange
Agreement” and the transactions contemplated thereby, the “Share Exchange”), the
Company acquired Chance High International Limited, a British Virgin Islands
company, or Chance High, from Chance High’s shareholders, or the Chance High
shareholders, and, as a result, acquired Chance High’s indirect, controlled
affiliate, Yantai Bohai Pharmaceuticals Group Co., Ltd., or Bohai, a Chinese
company engaged the production, manufacturing and distribution in the People’s
Republic of China (“China” or the “PRC”) of herbal medicines, including
capsules and other products, based on traditional Chinese
medicine.
The
closing of the Share Exchange, or the Closing, took place on January 5, 2010, or
the Closing Date. On the Closing Date, pursuant to the terms of the Share
Exchange Agreement, the Company acquired all of the outstanding equity
securities, or the Chance High shares, of Chance High from the Chance High
Shareholders, and the Chance High Shareholders transferred and contributed all
of their Chance High Shares to the Company. In exchange, we issued to
Chance High Shareholders an aggregate of 13,162,500 newly issued shares of
common stock, par value $0.001 per share, or the Common Stock. In
addition, pursuant to the terms of the Share Exchange Agreement, Anthony
Zaradic, the former President and Chief Executive Officer of the Company,
cancelled a total of 1,500,000 shares of Common Stock.
Chance
High owns 100% of the issued and outstanding capital stock of a Chinese
wholly-foreign owned enterprise, Yantai Shencaojishi Pharmaceuticals Co., Ltd.,
or the WFOE. On December 7, 2009, the WFOE entered into a series of
variable interest entity contractual agreements, or the VIE Agreements, with
Bohai and its three shareholders, including Mr. Hongwei Qu, currently the
Company’s Chairman, Chief Executive Officer and President, pursuant to which
WFOE effectively assumed management of the business activities of Bohai and has
the right to appoint all executives and senior management and the members of the
board of directors of Bohai.
Chance
High, WFOE and Bohai are referred to herein collectively and on a consolidated
basis as the “Company” or “we”, “us” or “our”.
The VIE
Agreements are comprised of a series of agreements, including a Consulting
Services Agreement, Operating Agreement and Proxy Agreement, through which WFOE
has the right to advise, consult, manage and operate
Bohai for an annual fee in the amount of Bohai’s yearly
net profits after tax. Additionally, Bohai’s shareholders pledged their
rights, titles and equity interest in Bohai as security for WFOE to collect
consulting and services fees provided to Bohai through an equity pledge
agreement. In order to further reinforce WFOE’s rights to control and
operate Bohai, Bohai’s shareholders granted WFOE an exclusive right and option
to acquire all of their equity interests in Bohai through an option
agreement.
5
On
January 29, 2010, we entered into an agreement and plan of merger, the sole
purpose of which was to effect a change of our corporate name from Link
Resources Inc. to Bohai Pharmaceuticals Group, Inc.
We are
engaged in the production, manufacturing and distribution of herbal
pharmaceuticals based on traditional Chinese medicine, or TCM, in the People’s
Republic of China. We are based in the city of Yantai, Shandong Province,
China, and our operations are exclusively in China.
2.
BASIS OF
PREPARATION
The
accompanying unaudited condensed consolidated financial statements of our
company and our subsidiaries at December 31, 2010 and for the three and six
months ended December 31, 2010 and 2009 reflect all adjustments (consisting only
of normal recurring adjustments) that, in the opinion of management, are
necessary to present fairly our consolidated financial position and results of
operations for the periods presented. Operating results for the three and six
months ended December 31, 2010 are not necessarily indicative of the results
that may be expected for the year ending June 30, 2011. The accompanying
condensed consolidated financial statements should be read in conjunction with
the audited consolidated financial statements and the notes thereto included in
our Annual Report on Form 10-K filed with the Securities and Exchange
Commission on September 28, 2010.
The
accompanying unaudited condensed consolidated financial statements for our
company, our subsidiaries and our variable interest entity (Bohai) have been
prepared in accordance with accounting principles generally accepted in the
United States of America, or the US, for interim financial information and with
the instructions to Form 10-Q and Article 8-03 of Regulation S-X.
Operating results for interim periods are not necessarily indicative of
results that may be expected for the fiscal year as a whole.
The Share
Exchange was accounted for as a reverse recapitalization effected as of January
5, 2010. Although we legally acquired Chance High and its controlled subsidiary
Bohai, for accounting purposes, Chance High and Bohai are considered to be the
accounting acquirers and Link Resources, Inc. as the accounting acquiree.
As a result, the historical consolidated financial statements for
periods prior to January 5, 2010 are those of Chance High and Bohai and the
operating results, financial position and cash flows of our company (formerly
known as Link Resources, Inc.) are consolidated only from its acquisition
on January 5, 2010. As the transaction between our company and Chance High
and its subsidiaries is treated as reverse acquisition, no goodwill was
recorded. Intercompany transactions and balances are eliminated in
consolidation.
3.
SUMMARY OF SIGNIFICANT
ACCOUNTING POLICIES
Basis
of Presentation and Consolidation
We
adopted FAS ASC 810-10-15-14 and also ASC 810-10-05-8, which requires that a
Variable Interest Entity, or VIE, to be consolidated by a company if that
company is entitled to receive a majority of the VIE’s residual returns and has
the direct ability to make decisions on all operating activities of the
voting right of the VIE. We controls Bohai through the VIE Agreements
described in Note 1 and accordingly it is consolidated for all periods
presented.
The
Operating Agreement provides that the WFOE has the direct ability to make
decisions on all the operating activities and exercise all voting rights of
Bohai, the Company’s VIE.
Under
Consultant Service Agreement entered between WFOE and Bohai on December 7, 2009,
Bohai agreed to pay all of its net income to WOFE quarterly as
a consulting fee. Accordingly, WOFE has the right to receive the
expected residual returns of Bohai.
6
Under the
above mentioned contractual arrangement, our company
qualifies as the primary beneficiary of such controlling financial interest in
Bohai as operating under ASC 810-10-15-14, an Interpretation of Accounting
Research Bulletin No. 51. The results of subsidiaries or VIEs acquired
prior to the date of Share Exchange Agreement on January 5, 2010 are included in
the consolidated financial statements.
As of
December 31, 2010, the particulars of our company’s subsidiaries and VIE are as
follows:
|
Name of Company
|
Place of
incorporation
|
Date of
incorporation
|
Attributable
equity interest
|
Issued Capital
(US Dollars)
|
||||||||
|
Chance
High International Limited
|
British
Virgin Islands
|
July
2, 2009
|
100 | % | $ | 50,000 | ||||||
|
Yantai
Shencaojishi Pharmaceuticals Co., Ltd.
|
People’s
Republic of China
|
November
25, 2009
|
100 | % | $ | 10,000,000 | ||||||
|
Yantai
Bohai Pharmaceuticals Group Co., Ltd.
|
People’s
Republic of China
|
July
8, 2004
|
* |
$
|
2,918,000
(RMB20,000,000)
|
|||||||
|
*
|
We
have an indirect controlling interest in Bohai under the VIE Agreements
entered on December 7, 2009, which are described in Note 1
above.
|
Initial measurement of VIE:
we initially measured the assets, liabilities, and non-controlling interests of
the VIEs at their carrying amount as of the date of the
acquisition.
Accounting after initial measurement of
VIE: subsequent accounting for the assets, liabilities, and non-
controlling interest of a consolidated VIE are accounted for as if the entity
were consolidated based on voting interests and the usual accounting rules for
which the VIE operates are applied as they would to a consolidated subsidiary as
follows:
|
·
|
Carrying
amounts of the VIE are consolidated into the financial statements of the
Company as the primary
beneficiary, or Primary Beneficiary, or PB;
and
|
|
·
|
Inter-company
transactions and balances, such as revenues and costs, receivables and
payables between or among the Primary Beneficiary and the VIE(s) are
eliminated in their entirety.
|
Economic
and Political Risks
Our
operations are conducted solely in the PRC. There are significant risks
associated with doing business in the PRC, among others, political, economic,
legal and foreign currency exchange risks. Our results may be adversely affected
by changes in the political and social conditions in the PRC, and by changes in
governmental policies with respect to laws and regulations, anti-inflationary
measures, currency conversion, remittances abroad, and rates and
methods of taxation, among other things.
Use of Estimates
In
preparing the condensed consolidated financial statements in conformity with US
GAAP, management makes estimates and assumptions that affect the reported
amounts of assets and liabilities and disclosures of contingent assets and
liabilities at the dates of the financial statements, as well as the reported
amounts of revenues and expenses during the reporting periods. These
accounts and estimates include, but are not limited to, the valuation of
accounts receivable, inventories, deferred income taxes, the estimation on
useful lives of plant and machinery, and the fair value of derivative
liabilities. Actual results could differ from those
estimates.
7
Fair
Value Measurements and Fair Value of Financial Instruments
We
adopted the guidance of Accounting Standards Codification, or ASC, 820 for fair
value measurements, which clarifies the definition of fair value, prescribes
methods for measuring fair value, and establishes a fair value hierarchy to
classify the inputs used in measuring fair value as follows:
Level 1 -
Inputs are unadjusted quoted prices in active markets for identical assets or
liabilities available at the measurement date.
Level 2 -
Inputs are unadjusted quoted prices for similar assets and liabilities in active
markets, quoted prices for identical or similar assets and liabilities in
markets that are not active, inputs other then quoted prices that are
observable, and inputs derived from or corroborated by observable market
data.
Level 3 -
Inputs are unobservable inputs which reflect the reporting entity’s own
assumptions on what assumptions the market participants would use in pricing the
asset or liability based on the best available information.
The
carrying amounts reported in the balance sheets for cash, accounts receivable,
other receivables, short-term borrowings, accounts payable and accrued expenses,
customer advances, and amounts due from related parties approximate their fair
market value based on the short-term maturity of these instruments.
ASC
825-10 “Financial
Instruments,” allows entities to voluntarily choose to measure certain
financial assets and liabilities at fair value (fair value option). The fair
value option may be elected on an instrument-by-instrument basis and is
irrevocable, unless a new election date occurs. If the fair value option is
elected for an instrument, unrealized gains and losses for that instrument
should be reported in earnings at each subsequent reporting date. We use Level 3
inputs to value our derivative liabilities.
The
following table reflects gains and losses for the three and six months ended
December 31, 2010 for all financial assets and liabilities categorized as Level
3 as of December 31, 2010.
|
Liabilities:
|
||||
|
Balance
of derivative liabilities as of September 30, 2010
|
$
|
5,512,482
|
||
|
Change
in the fair value of derivative liabilities
|
(2,949,039)
|
|||
|
Balance
of derivative liabilities as of December 31, 2010
|
$
|
2,563,443
|
||
|
Liabilities:
|
||||
|
Balance
of derivative liabilities as of June 30, 2010
|
$
|
5,481,928
|
||
|
Change
in the fair value of derivative liabilities
|
(2,918,485)
|
|||
|
Balance
of derivative liabilities as of December 31, 2010
|
$
|
2,563,443
|
||
Estimating
fair values of derivative financial instruments require the development of
significant and subjective estimates that may, and are likely to, change over
the duration of the instrument with related changes in internal and external
market factors. In addition, valuation techniques are sensitive to changes
in the trading market price of our Common Stock and its estimated volatility.
Because derivative financial instruments are initially and subsequently carried
at fair values, our net income may include significant charges or credits as
these estimates and assumptions change.
8
The
potential credit risk to our company is mainly attributable to its accounts
receivable and bank balances. We have policies in place to ensure that we will
only accept customers from countries which are politically stable and customers
with an appropriate credit history. In addition, all bank balances are on
deposit with financial institutions with high-credit quality. Accordingly, we do
not consider that we are subject to significant credit risk.
Our
interest rate risk is primarily attributable to our borrowings, all of which
have fixed interest rates. We do not use interest rate swaps to hedge our
exposure to interest rate risk.
Cash
and Cash Equivalents
We
consider all highly liquid investments purchased with original maturities of
three months or less to be cash equivalents. We maintain bank accounts in
the PRC and restricted cash accounts and a checking account in the United States
of America. The restricted cash accounts were created for interest payments
due to convertible note holders and payments for investor relations activities
in the US.
Concentrations
of Credit Risk
Financial
instruments which potentially subject us to concentrations of credit risk
consist principally of cash and trade accounts receivable. Substantially all of
our cash is maintained with state-owned banks within the PRC, and no deposits
are covered by insurance. We have not experienced any losses in such accounts
and believe we are not exposed to any risks on our cash in bank accounts. A
significant portion of our sales are credit sales which are primarily to
customers whose ability to pay is dependent upon the industry economics
prevailing in these areas; however, concentrations of credit risk with respect
to trade accounts receivables is limited due to generally short payment
terms. We also perform ongoing credit evaluations of our customers to help
further reduce credit risk.
At
December 31, 2010 and June 30, 2010, our cash balances by geographic area were
as follows:
|
December 31, 2010
|
June 30, 2010
|
|||||||||||||||
|
(unaudited)
|
||||||||||||||||
|
Country:
|
||||||||||||||||
|
United
States
|
$
|
7,951
|
-
|
%
|
$
|
-
|
-
|
%
|
||||||||
|
China
|
12,414,467
|
100.0
|
%
|
17,149,082
|
100.0
|
%
|
||||||||||
|
Total
cash and cash equivalents
|
$
|
12,422,418
|
100.0
|
%
|
$
|
17,149,082
|
100.0
|
%
|
||||||||
Accounts
Receivable
Accounts
receivable consists of amounts due from customers. We extend unsecured credit to
our customers in the ordinary course of business but mitigate the associated
risks by performing credit checks and actively pursuing past due accounts.
An allowance for doubtful accounts is established and determined based on
management’s assessment of known requirements, aging of receivables, payment
history, the customer’s current credit worthiness and the economic
environment. As of December 31, 2010 and June 30, 2010, no allowance for
doubtful accounts was deemed necessary based on management’s
assessment.
9
Inventories
Inventories
are valued at the lower of cost or market with cost is determined using the
weighted average method. Finished goods inventories consist of raw materials,
direct labor and overhead associated with the manufacturing process. In
assessing the ultimate realization of inventories, management makes
judgments as to future demand requirements compared to current or committed
inventory levels. Our reserve requirements generally increase/decrease due
to management’s projected demand requirements, market conditions and product
life cycle changes. As of December 31, 2010 and June 30, 2010, we did not
make any allowance for slow-moving or defective inventories.
Intangible
Assets
Intangible
assets consist of “Pharmaceutical Formulas”, which were acquired with indefinite
useful lives. These intangible assets are measured initially at cost and not
subject to amortization and will be tested for impairment annually or more
frequently if there is indication of impairment. If the carrying amount exceeds
fair value, an impairment loss would be recognized. Subsequently
reversal of a recognized impairment loss is prohibited. There was no
impairment of the intangible assets as of December 31, 2010 and June 30,
2010.
Property,
Plant and Equipment
Property,
plant and equipment are carried at cost and are depreciated on a straight-line
basis over the estimated useful lives of the assets. The cost of repairs and
maintenance is expensed as incurred; major replacements and improvements are
capitalized. When assets are retired or disposed of, the cost and
accumulated depreciation are removed from the accounts, and any resulting gains
or losses are included in income in the year of disposition. We examine the
possibility of decreases in the value of fixed assets when events or changes in
circumstances reflect the fact that their recorded value may not be
recoverable.
Included
in property and equipment was construction-in-progress which consisted of
factories and office buildings under construction and machinery pending
installation and includes the costs of construction, machinery and equipment,
and any interest charges arising from borrowings used to finance these assets
during the period of construction or installation. No provision for depreciation
is made on construction-in-progress until such time as the relevant assets are
completed and ready for their intended use. The principal annual rates are as
follows:
|
Leasehold
land and buildings
|
30
to 40 years
|
|
|
Motor
vehicles
|
10
years
|
|
|
Plant
and machinery
|
10
years
|
|
|
Office
equipment
|
5
years
|
Accounting
for the Impairment of Long-Lived Assets
We use
ASC Topic 360, which addresses financial accounting and reporting for the
impairment or disposal of long-lived assets. We periodically evaluate the
carrying value of long-lived assets to be held and used in accordance with ASC
Topic 360. ASC Topic 360 requires impairment losses to be recorded on long-lived
assets used in operations when indicators of impairment are present and the
undiscounted cash flows estimated to be generated by those assets are less than
the assets’ carrying amounts. In that event, a loss is recognized based on the
amount by which the carrying amount exceeds the fair market value of the
long-lived assets. Loss on long-lived assets to be disposed of is determined in
a similar manner, except that fair market values are reduced for the cost of
disposal. Based on its review, we believe that, as of December 31, 2010 and June
30, 2010, there were no impairments of its long-lived
asset.
10
Foreign
Currency Translation
Our
reporting currency is the U.S. dollar. We maintain our consolidated financial
statements in the functional currency. Our functional currency is the Chinese
Renminbi, or RMB. For our subsidiaries and affiliates whose functional
currencies are the RMB, results of operations and cash flows are translated
at average exchange rates during the period, assets and liabilities are
translated at the unified exchange rate at the end of the period, and equity is
translated at historical exchange rates. As a result, amounts relating to assets
and liabilities reported on the statements of cash flows may not necessarily
agree with the changes in the corresponding balances on the balance
sheets. Translation adjustments resulting from the process of translating
the local currency financial statements into U.S. dollars are included in
determining comprehensive income. Transactions denominated in currencies
other than the functional currency are translated into the functional currency
at the exchanges rates prevailing at the dates of the transaction. Exchange
gains or losses arising from foreign currency transactions are included in the
determination of net income for the respective periods. All of our revenue
transactions are transacted in the functional currency. We do not enter any
material transaction in foreign currencies and, accordingly, transaction gains
or losses have not had, and are not expected to have a material effect on our
results of operations.
Assets
and liabilities are translated at the exchange rates at the balance sheet dates
and revenue and expenses are translated at the average exchange rates using the
following exchange rates:
|
December 31,
2010
|
June 30,
2010
|
December 31,
2009
|
||||||||||
|
Period
end US$: RMB exchange rate
|
6.61180 | 6.80860 | 6.81663 | |||||||||
|
Average
periodic US$: RMB exchange rate
|
6.72367 | 6.83667 | 6.81942 | |||||||||
RMB is
not freely convertible into foreign currency and all foreign exchange
transactions must take place through authorized institutions. No representation
is made that the RMB amounts could have been, or could be, converted into US
dollar at the rates used in translation.
Revenue Recognition
Revenue
represents the invoiced value of goods sold recognized upon the delivery of
goods to distributors. Pursuant to the guidance of ASC Topic 605 and ASC Topic
36, revenue is recognized when all of the following criteria are
met:
|
·
|
Persuasive
evidence of an arrangement exists;
|
|
·
|
Delivery has occurred
or services have been
rendered;
|
|
·
|
The
seller’s price to the buyer is fixed
or determinable; and
|
|
·
|
Collectability
is reasonably assured.
|
We
account for sales returns by establishing an accrual in an amount equal to our
estimate of sales recorded for which the related products are expected to be
returned. We determine the estimate of the sales return accrual primarily based
on our historical experience regarding sales returns, but also by
considering other factors that could impact sales returns. These factors include
levels of inventory in the distribution channel, estimated shelf life, product
discontinuances, and price changes of competitive products, introductions of
generic products and introductions of competitive new products. For the
three and six months ended December 31, 2010 and 2009, our sales return rate is
low and deemed immaterial and accordingly, no provision for sales returns was
recorded.
11
Cost
of Revenue
Cost of
revenue consists primarily of raw material costs, labor cost, overhead costs
associated with the manufacturing process and related expenses which are
directly attributable to our revenues.
Stock-based
Compensation
Stock
based compensation is accounted for based on the requirements of the Share-Based
Payment topic of ASC 718 which requires recognition in the financial statements
of the cost of employee and director services received in exchange for an award
of equity instruments over the employee or director’s requisite service period
(presumptively, the vesting period). The FASB Accounting Standards Codification
also requires measurement of the cost of employee and director services received
in exchange for an award based on the grant-date fair value of the
award.
Pursuant
to ASC Topic 505-50, for share-based payments to consultants and other
third-parties, compensation expense is determined at the “measurement date.” The
expense is recognized over the vesting period of the award. Until the
measurement date is reached, the total amount of compensation expense remains
uncertain. We record compensation expense based on the fair value of the award
at the reporting date. The awards to consultants and other third-parties are
then revalued, or the total compensation is recalculated based on the then
current fair value, at each subsequent reporting date.
Research
and Development Costs
Research
and development costs are charged as an expense when incurred and included in
operating expenses. Research and development costs totaled $187,464 and $0 for
the three months ended December 31, 2010 and 2009, respectively. Research and
development costs totaled $371,821and $295,406 for the six months ended December
31, 2010 and 2009, respectively.
Shipping
costs
Shipping
costs are included in selling expense and totaled $210,725 and $157,999 the
three months ended December 31, 2010 and 2009, respectively. Shipping costs are
included in selling expense and totaled $367,587 and $282,403 for the six months
ended December 31, 2010 and 2009, respectively
Advertising
and Promotion
Advertising
and promotion is expensed as incurred. Advertising and promotion expenses were
included in operating expenses and amounted to $3,671,269 and $3,346,014 for the
three months ended December 31, 2010 and 2009, respectively. Advertising and
promotion expenses were included in operating expenses and amounted to
$6,498,981 and $5,964,703 for the six months ended December 31, 2010 and
2009, respectively.
12
Income
Taxes
We are
governed by the Income Tax Law of the People’s Republic of China and the
Internal Revenue Code of the United States. Income taxes are accounted for under
the asset and liability method. Deferred tax assets and liabilities are
recognized for the future tax consequences attributable to differences between
the financial statement carrying amounts of existing assets and liabilities and
their respective tax bases and operating loss and tax credit carry-forwards.
Deferred tax assets are reduced by a valuation allowance to the extent
management concludes it is more likely than not that the assets will not be
realized. Deferred tax assets and liabilities are measured using enacted tax
rates expected to apply to taxable income in the years in which those temporary
differences are expected to be recovered or settled. The effect on
deferred tax assets and liabilities of a change in tax rates is recognized in
the statements of income and comprehensive income in the periods that includes
the enactment date.
Comprehensive
Income
Comprehensive
income is defined to include all changes in equity except those resulting from
investments by owners and distributions to owners. Among other disclosures, all
items that are required to be recognized under current accounting standards as
components of comprehensive income are required to be reported in a financial
statement that is presented with the same prominence as other financial
statements. Our current components of other comprehensive income are the foreign
currency translation adjustment.
Commitments
and Contingencies
Liabilities
for loss contingencies arising from claims, assessments, litigation, fines and
penalties and other sources are recorded when it is probable that a liability
has been incurred and the amount of the assessment can be reasonably
estimated.
Earnings
Per Share
We report
basic earnings per share in accordance with ASC Topic 260, “Earnings Per
Share”. Basic earnings/ (loss) per share is computed by dividing net
income/ (loss) by weighted average number of shares of Common Stock outstanding
during the period. Diluted earnings per share is computed by dividing net income
by the weighted average number of shares of Common Stock, Common Stock
equivalents and potentially dilutive securities outstanding during the period.
Common equivalent shares are excluded from the computation in periods for which
they have an anti-dilutive effect. Stock options for which the exercise price
exceeds the average market price over the period are anti-dilutive and,
accordingly, are excluded from the calculation. At December 31, 2010, we
had 5,275,000 Common Stock equivalents from convertible notes and stock
options to purchase 26,000 shares of Common Stock that could potentially dilute
future earnings per share. Warrants to purchase 6,600,000 shares of Common Stock
were outstanding during the three and six months ended December 31, 2010, but
were excluded from the computation of diluted earnings per share as their effect
would have been anti-dilutive.
Recent
Accounting Pronouncements Adopted
The
following ASC updates have been issued, or became effective, since the beginning
of the current year covered by these financial statements:
In June
2009, the FASB issued ASC 810, “Amendments to FASB Interpretation No.46(R)”. ASC
810 amends FASB Interpretation No.46(R), “Variable Interest Entities” for
determining whether an entity is a VIE and requires an enterprise to perform an
analysis to determine whether the enterprise’s variable interest or
interests give it a controlling financial interest in a VIE. Under ASC 810, an
enterprise has a controlling financial interest when it has (a) the power to
direct the activities of a VIE that most significantly impact the entity’s
economic performance and (b) the obligation to absorb losses of the entity or
the right to receive benefits from the entity that could potentially be
significant to the VIE. ASC 810 also requires an enterprise to assess whether it
has an implicit financial responsibility to ensure that a VIE operates as
designed when determining whether it has power to direct the activities of the
VIE that most significantly impact the entity’s economic performance. ASC 810
also requires ongoing assessments of whether an enterprise is the primary
beneficiary of a VIE, requires enhanced disclosures and eliminates the scope
exclusion for qualifying special-purpose entities. ASC 810 is effective as of
the beginning of each reporting entity’ s first annual reporting period that
begins after November 15, 2009, for interim periods within that first
annual reporting period, and for interim and annual reporting periods
thereafter. Earlier application is prohibited. ASC 810 is effective for us in
the first quarter of fiscal 2011. The adoption of ASC 810 beginning July 1, 2010
did not have a material impact on our consolidated financial
statements.
13
In
December 2009, the FASB issued ASU No. 2009-17, “Improvements to Financial
Reporting by Enterprises Involved with Variable Interest Entities (“ASU
2009-17”)”. ASU 2009-17 amends the variable- interest entity guidance in FASB
ASC 810-10-05-8 to clarify the accounting treatment for legal entities in which
equity investors do not have sufficient equity at risk for the entity to finance
its activities without financial support. ASU 2009-17 shall be effective as of
the beginning of each reporting entity’s first annual reporting period that
begins after November 15, 2009. ASU 2009-17 is effective for us in the first
quarter of fiscal 2011. The adoption ASU 2009-17 beginning July 1, 2010 did not
have a material impact on our consolidated financial statements.
In
January 2010, FASB issued ASU No. 2010-06 – Improving Disclosures about Fair
Value Measurements. This update provides amendments to Subtopic 820-10 that
requires new disclosure as follows: (1) Transfers in and out of Levels 1 and 2.
A reporting entity should disclose separately the amounts of significant
transfers in and out of Level 1 and Level 2 fair value measurements and describe
the reasons for the transfers, and (2) Activity in Level 3 fair value
measurements. In the reconciliation for fair value measurements using
significant unobservable inputs (Level 3), a reporting entity should present
separately information about purchases, sales, issuances, and settlements (that
is, on a gross basis rather than as one net number). This update provides
amendments to Subtopic 820-10 that clarifies existing disclosures as follows:
(1) Level of disaggregation. A reporting entity should provide fair value
measurement disclosures for each class of assets and liabilities. A class is
often a subset of assets or liabilities within a line item in the statement of
financial position. A reporting entity needs to use judgment in determining the
appropriate classes of assets and liabilities. (2) Disclosures about inputs and
valuation techniques. A reporting entity should provide disclosures about the
valuation techniques and inputs used to measure fair value for both recurring
and nonrecurring fair value measurements. Those disclosures are required for
fair value measurements that fall in either Level 2 or Level 3. The new
disclosures and clarifications of existing disclosures are effective for interim
and annual reporting periods beginning after December 15, 2009, except for the
disclosures about purchases, sales, issuances, and settlements in the roll
forward of activity in Level 3 fair value measurements. These disclosures are
effective for fiscal years beginning after December 15, 2010, and for interim
periods within those fiscal years. The adoption ASU No. 2010-06 beginning
July 1, 2010 did not have a material impact on our consolidated financial
statements.
Recent
Accounting Pronouncements Not Yet Adopted
In April
2010, the FASB issued ASU 2010-13, Compensation-Stock Compensation (Topic 718):
Effect of Denominating the Exercise Price of a Share-Based Payment Award in the
Currency of the Market in Which the Underlying Equity Security Trades - a
consensus of the FASB Emerging Issues Task Force. The amendments in this
Update are effective for fiscal years, and interim periods within those fiscal
years, beginning on or after December 15, 2010. Earlier application is
permitted. We do not expect the provisions of ASU 2010-13 to have a
material effect on our position, results of operations or cash
flows.
14
|
4.
|
OTHER
RECEIVABLES AND PREPAYMENTS
|
Other
receivables and prepayments consist of the following:
|
As of
December 31,
2010
|
As of
June 30,
2010
|
|||||||
|
(unaudited)
|
||||||||
|
Prepayment
for advertising and promotion
|
$
|
1,702,101
|
$
|
1,198,484
|
||||
|
Prepayment
for director and officer insurance
|
13,542
|
29,792
|
||||||
|
Prepayment
for research and development
|
120,996
|
-
|
||||||
|
Other
receivables
|
236,795
|
221,314
|
||||||
|
Total
other receivables and prepayments
|
$
|
2,073,434
|
$
|
1,449,590
|
||||
|
5.
|
AMOUNT
DUE FROM EQUITY HOLDER
|
Amount
due from equity holder consists of the following:
|
As of
|
As of
|
|||||||
|
|
December 31,
|
June 30,
|
||||||
|
|
2010
|
2010
|
||||||
|
(unaudited)
|
||||||||
|
Mr.
Hongwei Qu
|
$
|
-
|
$
|
40,160
|
||||
The
amount due from an equity holder (the Company’s Chairman, President and Chief
Executive Officer) as of June 30, 2010 is unsecured, non-interest bearing. The
balance of $40,160 was repaid in July 2010.
|
6.
|
INVENTORIES
|
Inventories consist of
the following:
|
As of
December 31, 2010
|
As of
June 30, 2010
|
|||||||
|
(unaudited)
|
||||||||
|
Raw
materials
|
$
|
1,051,261
|
$
|
445,693
|
||||
|
Finished
goods
|
846,839
|
302,729
|
||||||
|
Total
inventories
|
$
|
1,898,099
|
$
|
748,422
|
||||
15
|
7.
|
INTANGIBLE
ASSETS
|
Intangible
assets consist of the following:
|
As of
December 31,
2010
|
As of
June 30,
2010
|
|||||||
|
(unaudited)
|
||||||||
|
Pharmaceuticals
formulas, at cost
|
$ | 25,118,727 | $ | 17,342,772 | ||||
On
December 9, 2010, we entered into an Intangible Assets Transfer
Agreement with Shandong Daxin Microbiology Pharmaceutical Industry Co.,
Ltd. (“Daxin”), an unrelated party, pursuant to which Daxin transferred to us
all rights and title for 14 State Food and Drug Administration previously
approved traditional Chinese medicine formulas. The aggregate purchase price is
$7,259,700 (RMB 48,000,000), of which $2,974,566 (RMB 20,000,000) has been paid
as of December 31, 2010 and the remaining balance was paid before January
31, 2011. The 14 new formulas consist of two new product categories,
powder and pellet formulations, which are the most popular product formulations
under Chinese government’s Essential Drug List (EDL). Additionally, 4 of
the 14 formulas are included in the EDL and an additional 5 medicines
are included in the National Drug Reimbursement List (NDRL).
Inclusion on EDL or NDRL allows for up to 100% insurance coverage by the Chinese
government.
|
8.
|
PROPERTY,
PLANT AND EQUIPMENT, NET
|
Property,
plant and equipment consisted of the following:
|
As of
December
31, 2010
|
As of
June 30, 2010
|
|||||||
|
(unaudited)
|
|
|||||||
|
Cost
|
||||||||
|
Leasehold
land and buildings
|
$ | 7,856,590 | $ | 7,629,498 | ||||
|
Plant
and equipment
|
1,271,753 | 1,234,994 | ||||||
|
Office
equipment
|
97,585 | 85,174 | ||||||
|
Motor
vehicles
|
419,285 | 414,622 | ||||||
|
Total
|
9,645,213 | 9,364,288 | ||||||
|
Less:
accumulated depreciation
|
(1,687,417 | ) | (1,469,246 | ) | ||||
|
Property,
plant and equipment, net
|
$ | 7,957,796 | $ | 7,895,042 | ||||
Depreciation
expense for the three months ended December 31, 2010 and 2009 amounted to
$87,029 and $258,145, respectively. Depreciation expense for the six months
ended December 31, 2010 and 2009 amounted to $172,730 and $341,868,
respectively.
As of
December 31, 2010 and June 30, 2010, we have pledged plant and machinery having
a carrying amount of $550,000 and $534,102, respectively to secure a bank loan
of Bohai.
16
|
9.
|
SHORT-TERM
BORROWINGS
|
Bohai
obtained several short-term loan facilities from financial institution in the
PRC. Short-term borrowings as of December 31, 2010 consisted of the
following:
|
Loan from financial
institution
|
Loan period
|
Annual
interest rate
|
Secured by
|
Amount
|
||||||
|
Yantai
Laishan Rural Credit Union
|
September
21, 2010 to September 20, 2011
|
9.0270%
|
Bohai’s
machinery and vehicle
|
$ |
604,979
|
|||||
|
Yantai Laishan Rural Credit
Union
|
September 21, 2010 to September 20,
2011
|
6.9030%
|
Yantai Ka Wah Medical Equipment Co.
Ltd
|
294,927
|
||||||
|
TOTAL
|
$
|
899,906
|
||||||||
Short-term borrowings
as of June 30, 2010 consisted of the following:
|
Loan from financial
institution
|
Loan period
|
Annual
interest rate
|
Secured by
|
Amount
|
||||||
|
China
Construction Bank
|
February
24, 2010 to February 23, 2011
|
5.8410%
|
Shandong
Dai Xin Heavy Industries Co. Ltd.
|
$
|
3,524,954
|
|||||
|
Yantai
Laishan Rural Credit Union
|
September
28, 2009 to September 26, 2010
|
9.0270%
|
Yantai
Ka Wah Medical Equipment Co. Ltd
|
587,492
|
||||||
|
Yantai Laishan Rural Credit
Union
|
September 28, 2009 to September 26,
2010
|
6.9030%
|
Bohai’s
machinery and vehicle
|
286,403
|
||||||
|
TOTAL
|
$
|
4,398,849
|
||||||||
|
10.
|
COMMON
STOCK
|
We are
authorized to issue 150 million shares of Common Stock, par value $0.001 per
share. Holders of Common Stock are entitled to one vote for each share
held of record on each matter submitted to a vote of shareholders. Holders
of Common Stock do not have a cumulative voting right, which means that the
holders of more than one half of our outstanding shares of Common Stock, subject
to the rights of the holders of preferred stock, if any, can elect all of our
directors, if they choose to do so. In this event, the holders of the
remaining shares of Common Stock would not be able to elect any directors.
Subject to the prior rights of any class or series of preferred stock which may
from time to time be outstanding, if any, holders of Common Stock are entitled
to receive ratably, dividends when, as, and if declared by our Board of
Directors out of funds legally available for that purpose and, upon our
liquidation, dissolution, or winding up, are entitled to share ratably in all
assets remaining after payment of liabilities and payment of accrued dividends
and liquidation preferences on the preferred stock, if any. Holders of
Common Stock have no preemptive rights and have no rights to convert their
Common Stock into any other securities. The outstanding Common Stock is
duly authorized and validly issued, fully-paid, and non-assessable.
Except as required or permitted by law or our charter documents, all stockholder
action is taken by the vote of a majority of the outstanding shares of Common
Stock present at a meeting of stockholders at which a quorum consisting of a
majority of the outstanding shares of Common Stock is present in person or by
proxy.
Notes
with an aggregate face amount of $950,000 and interest of $4,442 on the $950,000
Notes were converted into 477,221 shares of Common Stock during the six months
ended December 31, 2010.
17
Restricted
Stock Awards
On June
4, 2010, we issued 120,000 shares of restricted stock to our CFO for three years
of service. The restricted stock vests in three equal annual installments over
the agreement.. For the three and six months ended December 31, 2010, we
recognized $22,000 and $51,000 of the restricted stock as compensation
expenses.
On
November 10, 2010, we issued 25,000 shares of restricted Common Stock to a third
party in return for service, and the restricted stock vested immediately. For
the three and six months ended December 31, 2010, the Company recognized $28,500
of the restricted stock as general and administrative expenses.
|
11.
|
EARNINGS
PER SHARE
|
Basic
earnings per share are computed on the basis of the weighted average number of
shares of Common Stock outstanding during the period. Diluted earnings per share
is computed on the basis of the weighted average number of shares of Common
Stock plus the effect of dilutive potential common shares outstanding during the
period using the if-converted method for the convertible notes and the treasury
stock method for warrants. The following table sets forth the computation
of basic and diluted net income per common share:
|
Three
months
ended
|
Three
months
ended
|
Six months
ended
|
Six months
ended
|
|||||||||||||
|
December
31, 2010
|
December
31, 2009
|
December 31,
2010
|
December 31,
2009
|
|||||||||||||
|
(unaudited)
|
(unaudited)
|
(unaudited)
|
(unaudited)
|
|||||||||||||
|
Net
income available for common shareholders
|
$ | 6,540,895 | $ | 3,277,539 | $ | 9,553,370 | $ | 5,079,355 | ||||||||
|
Effective
interest charge on convertible note
|
291,749 | - | 548,466 | - | ||||||||||||
|
Net
income for diluted earnings per common share
|
$ | 6,832,644 | $ | 3,277,539 | $ | 10,101,836 | $ | 5,079,355 | ||||||||
|
Three
months
ended
|
Three
months
ended
|
Six months
ended
|
Six months
ended
|
|||||||||||||
|
December
31, 2010
|
December
31, 2009
|
December
31, 2010
|
December
31, 2009
|
|||||||||||||
|
(unaudited)
|
(unaudited)
|
(unaudited)
|
(unaudited)
|
|||||||||||||
|
Basic
weighted average Common Stock outstanding
|
16,925,928 | 13,162,500 | 16,716,691 | 13,162,500 | ||||||||||||
|
Effect
of dilutive securities:
|
||||||||||||||||
|
Warrants
- incremental shares based on assumed proceeds &
repurchases
|
- | - | - | - | ||||||||||||
|
Options
- incremental shares based on assumed proceeds &
repurchases
|
517 | - | 296 | - | ||||||||||||
|
Restricted
stock
|
14,130 | - | 7,065 | - | ||||||||||||
|
Common
shares if converted from Convertible Debt
|
5,326,087 | - | 5,534,783 | - | ||||||||||||
|
Diluted
weighted average for Common Stock outstanding
|
22,266,662 | 13,162,500 | 22,258,835 | 13,162,500 | ||||||||||||
18
Warrants
to purchase 6,600,000 shares of Common Stock were outstanding during the three
and six months ended December 31, 2010, but were excluded from the computation
of diluted earnings per share as their effect would have been
anti-dilutive.
For the
three and six months ended December 31, 2009, there were no Common Stock
equivalents outstanding; therefore the amounts reported for basic and dilutive
earning per share were the same.
|
12.
|
OTHER
ACCRUED LIABILITIES
|
Other
accrued liabilities as of December 31, 2010 and June 30, 2010 are consisted of
the following:
|
As of
|
As of
|
|||||||
|
December 31,
|
June 30,
|
|||||||
|
2010
|
2010
|
|||||||
|
(unaudited)
|
||||||||
|
Accrued
selling expenses
|
$
|
2,647,365
|
$
|
1,542,280
|
||||
|
Accrued
staff costs
|
250,953
|
221,810
|
||||||
|
Value
added tax payable
|
1,068,252
|
686,478
|
||||||
|
Other
taxes payable
|
147,913
|
78,370
|
||||||
|
Other
accrued expenses
|
190,952
|
456,050
|
||||||
|
Deposits
from investors for Common Stock sales (Note 19)
|
1,874,117
|
-
|
||||||
|
Payable
for intangible assets (Note 22)
|
4,234,853
|
-
|
||||||
|
Total
Other accrued liabilities
|
$
|
10,414,405
|
$
|
2,984,988
|
||||
|
13.
|
CONVERTIBLE PROMISSORY NOTES
AND WARRANTS
|
On
January 5, 2010, pursuant to a Securities Purchase Agreement, or securities
purchase agreement, with 128 accredited investors, or the investors, we sold
6,000,000 units for aggregate gross proceeds of $12,000,000, each unit
consisting of an 8% senior convertible promissory note, or Notes, in the
principal amount of $2 and one Common Stock purchase warrant, or Warrant.
By agreement with the Investors, each investor received: (i) a single Note
representing the aggregate number of Notes purchased by them as part of the
units (each, a “Note” and collectively, the “Notes”) and (ii) a single Investor
Warrant representing the aggregate number of Investor Warrants purchased by them
as part of the units.
The Notes
bear interest at 8% per annum, payable quarterly in arrears on the last day of
each fiscal quarter of our company. No principal payments are required until
maturity of the Notes on January 5, 2012. Each Note, plus all accrued but unpaid
interest thereon, is convertible, in whole but not in part, at any time at the
option of the holder, into shares of Common Stock at a conversion price of $2.00
per share, subject to adjustment as set forth in the Note. The Notes
issued have face amounts that range from $43,200 to $500,000.
19
The
conversion price of the Notes is subject to standard anti-dilution adjustments
for stock splits and similar events. In addition, if we issue or sell any
additional shares of Common Stock or instruments convertible or exchangeable for
Common Stock at a price per share less than the conversion price then in effect
or without consideration, then the conversion price upon each such issuance will
be adjusted to that price determined by multiplying the conversion price then in
effect by a fraction: (1) the numerator of which is the sum of (x) the number of
shares of Common Stock outstanding immediately prior to the issuance of
such additional shares of Common Stock plus (y) the number of shares of Common
Stock which the aggregate consideration for the total number of such additional
shares of Common Stock so issued would purchase at a price per share equal to
the conversion price then in effect, and (2) the denominator of which is the
number of shares of Common Stock outstanding immediately after the issuance of
such additional shares of Common Stock. Notwithstanding any provision of the
Note to the contrary, no adjustment will cause the conversion price to be
less than $1.00, as adjusted for any stock dividend, stock split, stock
combination, reclassification or similar transaction.
Effective
as of June 30, 2010, we entered into an Amendment and Agreement with the
Investors, pursuant to which the Company and the Investors agreed to make
certain amendments to the Notes and the Warrants. Pursuant to the
Amendment, the anti-dilution protection provisions in the Notes and the Warrants
were eliminated and a provision specifically precluding net cash settlement by
us of the Notes and the Warrants was added. In return, and subject to
certain non-financing exceptions, we agreed not to issue any new equity
securities at a price per share below $2.20 until the earlier of (i) January 5,
2013 or (ii) the date on which, collectively with any prior conversions or
exercises of Notes and Warrants, 75% of the principal face value of the Notes in
the aggregate has been converted into shares of Common Stock and Warrants
representing, in the aggregate, 75% of the aggregate shares of Common Stock
underlying the Warrants have been exercised. This Amendment did not change
the Company’s accounting for the Notes and the Warrants described
below.
The Notes
contain certain events of default, including non-payment of interest or
principal when due, bankruptcy, failure to maintain a listing of the Common
Stock or to make required filings on a timely basis. No premium is payable by us
if an event of default occurs. However, upon an Event of Default, and provided
no more than 50% of the aggregate face amount of the Notes have been converted,
the Investors holding Notes have the right to receive a portion, based on their
pro-rata participation in the transaction, of 1,000,000 shares of our Common
Stock that have been placed in escrow by our principal stockholder. The shares
in escrow will be returned to the principal stockholder when 50% of the
aggregate face amount of the Notes has been converted or, if later, when the
Notes are repaid.
The
Investor Warrants expire on January 5, 2013 and may be exercised by the holder
at any time to purchase one share of Common Stock at an exercise price of $2.40
per share (subject to adjustment as set forth in the Investor Warrants). The
exercise price of the Investor Warrants is subject to adjustment in the same
manner as the conversion price of the Notes described above, except that the
exercise price will not be adjusted to less than $1.20, as adjusted for any
stock dividend, stock split, stock combination, reclassification or similar
transaction. The Investor Warrants may only be exercised for cash and do not
permit the holder to perform a cashless exercise.
In
connection with the sale of the units, we paid our placement agents a cash fee
of $1,200,000. In addition, the placement agents received warrants, the
Placement Agent Warrants and, together with the Investor Warrants, the Warrants
to purchase 600,000 shares of Common Stock, which agent warrants are
substantially identical to the Investor Warrants, except that, pursuant to
separate lock-up agreements executed by the holders of the Placement Agent
Warrants, the Placement Agent Warrants are not exercisable until the six month
anniversary of the later of: (i) the date of effectiveness of the registration
statement registering the resale of the Common Stock underlying the Notes and
Warrants or (ii) the date of commencement of sales in connection with such
registration statement.
20
In
addition to the placement agent fee, we paid $370,000 of legal and other
expenses. As required by the Securities Purchase Agreement, $500,000 of the
proceeds from the sale of the units were placed in escrow to pay investor
relations expenses to be incurred by us and $240,000, equivalent to one
quarter’s interest expense on the Notes, was also placed in escrow. The interest
escrow will be released to us at such time as 75% of all shares underlying the
Notes have been issued upon conversion of Notes. After payment of the placement
agent fees and other expenses and the amounts required to be placed in escrow,
we received net proceeds of $9,690,000. At December 31, 2010 and June 30, 2010,
$233,043 and $576,019, respectively, remained in escrow and is
included in restricted cash.
We also
entered into a Registration Rights Agreement with the Investors. We agreed to
file, no later than March 6, 2010, a registration statement to register the
shares underlying the Notes and the Warrants and to have such registration
statement effective no later than August 13, 2010. The required registration
statement was filed on March 2, 2010 and became effective on August 12, 2010.
Accordingly, we did not incur any registration delay payments.
Valuation
At the
time the Notes and Warrants were issued, there had not been any market activity
for the Common Stock. Accordingly, determining the fair value of the
Common Stock required us to make complex and subjective judgments. We estimated
the value of our enterprise as of January 5, 2010 based on a review of the
enterprise value derived from the use of market and income valuation approaches.
We also reviewed an asset-based approach to assess whether the result of such an
approach was consistent with the value derived from the market and income
valuation approaches. The market approach was based on the market price to
earnings multiple for companies considered by management to be comparable to us.
The income approach was based on applying discount rates to estimated future net
income. The estimated enterprise value was then allocated to our existing
outstanding Common Stock, the Notes and the Warrants using the option pricing
method. The option pricing method was based on the two year period to maturity
of the Notes and the three year period to expiration of the Warrants, risk-free
interest rates commensurate with those periods and the expected volatility used
was based on a review of the historical volatility of companies considered
by management to be comparable to us.
Based on
the allocation of the estimated enterprise value, we estimated the fair value of
the Common Stock at $2.28 per share, as of January 5, 2010. The Investor
Warrants and the Placement Agent Warrants were valued at $5,824,538 and
$582,454, respectively, based on the estimated fair value of the Common Stock of
$2.28, a term equal to the remaining life of the Warrants, an expected dividend
yield of 0%, a risk-free interest rate of 1.57% based on constant maturity rates
published by the U.S. Federal Reserve applicable to the remaining life of the
Warrants and estimated volatility of 65%, based on a review of the historical
volatility of companies considered by management to be comparable to us.
As noted above, prior to the June 30, 2010 Amendment described above, the
Warrants contained a down-round anti-dilution protection feature. As of
January 5, 2010, the value of this feature was not considered to be
material and no adjustment was made for it in the estimated fair value of the
Warrants.
Accounting
for Convertible Notes
At
January 5, 2010 and December 31, 2010, the conversion options embedded in the
Notes are not derivative instruments as defined in FASB ASC 815-10-15-83 because
the Notes do not permit or require net settlement, there is no market mechanism
outside the contracts that permits net settlement and the shares to be received
on conversion of the Notes are not readily convertible to cash. At the time the
Notes were issued, there had not been any market activity for the Common Stock.
On March 31, 2010, an initial trade of 500 shares of the Common Stock
occurred in the market, the only trading activity during that period. The
Notes can be exercised only in whole but not in part and through December 31,
2010 and continuing, there has been insufficient trading volume to permit the
shares to be received on conversion of each Note to be readily sold in the
market, thus precluding the shares to be received by the holder of each Note
from being readily convertible to cash.
21
In future
periods, whether or not the embedded conversion option in each Note is
considered to be a derivative instrument will depend on whether or not the
aggregate number of shares to be received on exercise of each of the 128 Notes,
which Notes can be exercised only in whole but not in part, could be readily
sold in the market without significantly affecting the market price of the
Common Stock, thus permitting the shares received by the holder of each Note to
be readily convertible to cash. At each reporting date, the Company will re-
evaluate each Note, based on the level of activity in the market for the
Common Stock at that time, to determine whether or not the embedded
conversion option in each Note is a derivative instrument. Depending on the
trading volume for the Common Stock that develops in the future and the face
amount of each Note, the embedded conversion option may be considered a
derivative instrument for some Notes but not for others and its status as a
derivative instrument may vary from period to period.
FASB ASC
815-10-15-74 provides that a contract which would otherwise meet the definition
of a derivative instrument but that is both (a) indexed to a company’s own stock
and (b) classified in stockholders’ equity in the statement of financial
position would not be considered a derivative financial instrument. FASB ASC
815-40-15 and 815-40-25 provide guidance for determining whether those two
criteria are met. Because the Company’s functional currency is the Renminbi but
the Notes are denominated in U.S. Dollars, FASB ASC 815-40-15-7I provides that
the embedded conversion options are not considered to be indexed only to our
Common Stock. Furthermore, prior to the June 30, 2010 Amendment described above,
the criteria that the instruments be indexed only to the Common Stock was also
not met because the conversion price of the Notes would be reduced if we issued
securities at a lower exercise or conversion price. Because the requirement
that the instruments be indexed only to the Common Stock is not met, the
exemption in FASB ASC 815-10-15-74 will not be available and we will account for
the embedded conversion options in the Notes as derivative instrument
liabilities, if and when the shares to be issued on conversion are considered to
be readily convertible to cash.
Derivative
financial instruments are initially measured at their fair value. For derivative
financial instruments that are accounted for as liabilities, the derivative
instrument is initially recorded at its fair value and is then re-valued at each
reporting date, with changes in the fair value reported as charges or credits
to income. If and when the embedded conversion option in any of the Notes
first qualifies as a derivative instrument, the fair value at that time of the
embedded derivative instrument will be re-classified and separately recognized
and subsequently marked-to-market each reporting period, as long as the embedded
conversion option continues to qualify as a derivative instrument. If the
embedded conversion option ceases to be a derivative instrument, it will be
marked-to-market as of the date of re-classification but thereafter will no
longer be marked-to-market.
Warrants
Because
our functional currency is the Renminbi but the Warrants are denominated in U.S.
Dollars, the Warrants are not considered to be indexed only to our Common Stock.
Furthermore, prior to the June 30, 2010 Amendment described above, the criteria
that the instruments be indexed only to the Common Stock was also not met
because the exercise price of the Warrants would be reduced if we issued
securities at a lower exercise or conversion price. In accordance with ASC
815-10-S99-4, the Warrants (including the Placement Agent Warrants) are
accounted for at fair value, with changes in their fair value charged or
credited to income each period.
22
At
January 5, 2010, the Investor Warrants were valued at $5,824,538, as described
above. At December 31, 2010, the Investor Warrants were re-valued at $2,330,403
using a binomial model, based on the closing market price on that date of $1.71,
a term equal to the remaining life of the Warrants, an expected dividend yield
of 0%, a risk-free interest rate of 0.62% based on constant maturity rates
published by the U.S. Federal Reserve applicable to the remaining life of the
Warrants and estimated volatility of 60%, based on a review of the historical
volatility of companies considered by management to be comparable to our
company. The effect of the down-round anti-dilution protection was not
considered to be material and no adjustment was made for it in the estimated
fair value of the Investor Warrants.
The
Placement Agent Warrants were initially valued at $582,454, as described above.
The cost of these instruments, together with the cash fees paid to the placement
agents and the other fees and expenses paid by us, as described above, in the
aggregate amount of $2,152,454, have been deferred and are being amortized
on a straight-line basis over the two year period to maturity of the Notes.
At December 31, 2010, the Placement Agent Warrants were re-valued at $233,040,
based on the closing market price on that date of $1.71, a term equal to
the remaining life of the Warrants, an expected dividend yield of 0%, a
risk-free interest rate of 0.62% and estimated volatility of 60%. The effect of
the down-round anti-dilution protection was not considered to be material and no
adjustment was made for it in the estimated fair value of the
Placement Agent Warrants.
The
aggregate change in the value of the Investor and Placement Agent Warrants for
the three and six months ended December 31, 2010 of $2,949,039 and $2,918,485,
respectively, has been recorded as a gain on the consolidated statement of
income.
The
following table summarizes all of our
warrants outstanding as of December 31,
2010:
|
Warrant
Shares
|
Exercisable
Shares
|
Exercise Price per
Common Stock Range
|
||||||||||
|
Balance,
June 30, 2010
|
6,600,000
|
6,000,000
|
$
|
2.40
|
||||||||
|
Granted
or vested during the six months ended December 31,
2010
|
-
|
-
|
-
|
|||||||||
|
Exercised
during the six months ended December 31, 2010
|
-
|
-
|
-
|
|||||||||
|
Expired
during the six months ended December 31, 2010
|
-
|
-
|
-
|
|||||||||
|
Balance,
December 31, 2010 (unaudited)
|
6,600,000
|
6,000,000
|
$
|
2.40
|
||||||||
The
following table summarizes the weighted average remaining contractual life and
exercise price of our outstanding warrants.
|
Warrants Outstanding
|
|||||||||||||||
|
Number
|
|||||||||||||||
|
Outstanding
|
Weighted
|
Weighted Average
|
|||||||||||||
|
Number
|
Currently
|
Average
|
Exercise Price of
|
||||||||||||
|
Outstanding
|
Exercisable
|
Remaining
|
Warrants
|
||||||||||||
|
Exercise
|
at December
|
at
|
Contractual Life
|
currently
|
|||||||||||
|
Price
|
31, 2010
|
December
31, 2010
|
(Years)
|
exercisable
|
|||||||||||
| $ |
2.40
|
6,600,000
|
6,000,000
|
2.02
|
$
|
2.40
|
|||||||||
23
Convertible
Notes
The
Investor Warrants were initially recorded at their fair value of $5,824,538 and
the remainder of the $12,000,000 gross proceeds received from the Investors of
$6,175,462 was allocated to the Notes. Based on the proceeds allocated to the
Notes, the Notes are convertible into Common Stock at an effective conversion
price of approximately $1.03 per share. Because the effective conversion price
is less than the fair value of the Common Stock at the time the Notes were
issued, the Company recognized a beneficial conversion feature, which was
limited to the amount of proceeds allocated to the Notes of $6,175,462. The
Notes were initially recorded at a carrying value of zero and are being
amortized, together with interest accruing on the Notes, to their maturity value
over the period to maturity, at an effective interest rate of approximately 540%
per annum. Interest expense for the three and six months ended December 31,
2010 was $291,749 and $548,466, respectively. As of December 31, 2010, Notes
with an aggregate face amount of $1,450,000 and interest of $4,442 on the Notes
were converted into 727,221 shares of Common Stock.
The
convertible note liability is as follows at December 31, 2010 and June 30,
2010:
|
December
31, 2010
|
June 30, 2010
|
|||||||
|
(Unaudited)
|
||||||||
|
Convertible
notes payable, at face value
|
$
|
10,550,000
|
$
|
11,500,000
|
||||
|
Less:
unamortized beneficial conversion feature and warrants discount on
convertible notes
|
(10,336,062
|
)
|
(11,375,180
|
)
|
||||
|
Convertible
notes, net
|
$
|
213,938
|
$
|
124,820
|
||||
Escrowed
Shares
As of
January 5, 2010 and at December 31, 2010, our principal stockholder is obligated
to deliver 1,000,000 shares of Common Stock to the Investors if certain Events
of Default occur (as defined in the Notes). The fair value of this obligation is
not considered to be material as the probability of such events occurring is
currently considered to be minimal. Accordingly, at December 31, 2010 no
liability for this obligation has been recognized.
|
14.
|
DEFERRED
FEES ON CONVERTIBLE NOTES
|
We
incurred total placement fees of $2,152,454 in connection with our private
placement of Convertible Notes (see Note 13) that occurred on January 5, 2010.
The placement fees are being amortized on a straight line basis over the two
year expected life of the Convertible Notes, starting on the date of closing,
January 5, 2010.
|
As of
December 31,2010
(unaudited)
|
As of
June 30,2010
|
|||||||
|
Deferred
fees, beginning balance
|
$ | 1,562,617 | $ | 2,152,454 | ||||
|
Transferred
to equity on conversion
|
(102,041 | ) | (79,120 | ) | ||||
|
Amortization
of deferred fees
|
(504,024 | ) | (510,717 | ) | ||||
|
Deferred
fee, ending balance
|
$ | 956,552 | $ | 1,562,617 | ||||
24
|
15.
|
STOCK
OPTIONS
|
On
October 13, 2010, we granted stock options to two directors for the purchase of
26,000 shares of our Common Stock at an exercise price of $2.00 per share.
The options vest immediately on the grant date and expire five years from the
date of issuance.
These
options have been valued at $23,844. We use a binomial option pricing model to
calculate the grant date fair value of the options, with the following
assumptions: no dividend yield, expected volatility of 70%, risk free interest
rate of 0.3%, expected term of 2.5 years.
The
following table summarizes the weighted average remaining contractual life and
exercise price of our outstanding options as of December 31, 2010:
|
Options Outstanding
|
|||||||||||||||
|
Number
|
|||||||||||||||
|
Outstanding
|
Weighted
|
Weighted Average
|
|||||||||||||
|
Number
|
Currently
|
Average
|
Exercise Price of
|
||||||||||||
|
Outstanding
|
Exercisable
|
Remaining
|
Warrants
|
||||||||||||
|
Exercise
Price
|
at December
31, 2010
|
at
December 31, 2010
|
Contractual Life
(Years)
|
currently
exercisable
|
|||||||||||
| $ |
2.00
|
26,000
|
26,000
|
4.79
|
$
|
2.00
|
|||||||||
We
account for share-based payments in accordance with ASC 718. Accordingly, we
expense the fair value of awards granted to the directors. Total compensation
expense related to the stock options for the three months and six months ended
December 31, 2010 was $23,844 and was recorded as general and administrative
expense.
A summary
of our stock option activity as of December 31, 2010, and changes during six
months ended December 31, 2010 is presented in the following table:
|
Options
Shares
|
Vested and
Exercisable
Shares
|
Exercise Price per
Common Stock Range
|
||||||||||
|
Balance,
June 30, 2010
|
-
|
-
|
$
|
-
|
||||||||
|
Granted
or vested during the six months ended December 31,
2010
|
26,000
|
26,000
|
2.00
|
|||||||||
|
Exercised
during the six months ended December 31, 2010
|
-
|
-
|
-
|
|||||||||
|
Expired
during the six months ended December 31, 2010
|
-
|
-
|
-
|
|||||||||
|
Balance,
December 31, 2010 (unaudited)
|
26,000
|
26,000
|
$
|
2.00
|
||||||||
25
|
16.
|
SELLING,
GENERAL AND ADMINISTRATIVE EXPENSE
|
For the
three and six months ended December 31, 2010 and 2009, selling, general and
administrative expenses consisted of the following:
|
Three months
ended
|
Three months
ended
|
Six months
ended
|
Six months
ended
|
|||||||||||||
|
December 31,
2010
|
December 31,
2009
|
December 31,
2010
|
December 31,
2009
|
|||||||||||||
|
(unaudited)
|
(unaudited)
|
(unaudited)
|
(unaudited)
|
|||||||||||||
|
Travel
and accommodation
|
$ | 2,466,783 | $ | 1,841,831 | $ | 4,017,741 | $ | 3,056,177 | ||||||||
|
Advertising
and promotion
|
3,671,269 | 3,346,014 | 6,498,981 | 5,964,703 | ||||||||||||
|
Audit
fees
|
70,213 | - | 89,051 | - | ||||||||||||
|
Commission
|
1,404,465 | 1,276,259 | 1,472,970 | 2,403,953 | ||||||||||||
|
Conference
|
1,446,069 | 1,280,228 | 2,891,927 | 2,331,599 | ||||||||||||
|
Depreciation
|
10,048 | 9,101 | 20,006 | 18,476 | ||||||||||||
|
Staff
costs
|
558,061 | 305,460 | 1,139,573 | 963,137 | ||||||||||||
|
Research
and development costs
|
187,464 | - | 371,821 | 295,406 | ||||||||||||
|
Other
operating expenses
|
1,290,888 | 1,754,324 | 3,217,949 | 4,035,838 | ||||||||||||
|
Total
selling, general and administrative expenses
|
$ | 11,105,260 | $ | 9,813,217 | $ | 19,720,019 | $ | 19,069,289 | ||||||||
|
17.
|
INTEREST
EXPENSE
|
For the
three and six months ended December 31, 2010 and 2009, interest expense
consisted of the following:
|
Three months
ended
|
Three months
ended
|
Six months
ended
|
Six months
ended
|
|||||||||||||
|
December 31,
2010
|
December 31,
2009
|
December 31,
2010
|
December 31,
2009
|
|||||||||||||
|
(unaudited)
|
(unaudited)
|
(unaudited)
|
(unaudited)
|
|||||||||||||
|
Interest
on short-term bank borrowings and notes payable
|
$ | 77,887 | $ | 51,814 | $ | 167,786 | $ | 149,594 | ||||||||
|
Amortization
of beneficial conversion feature and warrants discount on convertible
notes converted
|
785,671 | - | 933,094 | - | ||||||||||||
|
Effective
interest charge on Convertible Notes
|
291,749 | - | 548,466 | - | ||||||||||||
|
Total
interest expenses
|
$ | 1,155,307 | $ | 51,814 | $ | 1,649,346 | $ | 149,594 | ||||||||
26
|
18.
|
INCOME
TAXES
|
For the
three and six months ended December 31, 2010 and 2009, income tax expense
consisted of the following:
|
Three months
ended
December 31,
2010
|
Three months
ended
December 31,
2009
|
Six months
ended
December 31,
2010
|
Six months
ended
December 31,
2009
|
|||||||||||||
|
(unaudited)
|
(unaudited)
|
(unaudited)
|
(unaudited)
|
|||||||||||||
|
Current
taxes
|
||||||||||||||||
|
United
States
|
$ | - | $ | - | $ | - | $ | - | ||||||||
|
PRC
|
1,444,003 | 1,057,890 | 2,625,686 | 1,613,261 | ||||||||||||
|
Deferred
taxes
|
||||||||||||||||
|
United
States
|
(237,546 | ) | - | (503,818 | ) | - | ||||||||||
|
PRC
|
- | (500 | ) | - | (500 | ) | ||||||||||
|
Change
in valuation allowance
|
237,546 | 500 | 503,818 | 500 | ||||||||||||
|
Total
income tax expenses
|
$ | 1,444,003 | $ | 1,057,890 | $ | 2,625,686 | $ | 1,613,261 | ||||||||
As of
December 31, 2010, we incurred $1,641,342 of net operating losses carry forwards
available for federal tax purposes that may be used to offset future taxable
income and will begin to expire in 2029, if unutilized. we provided for a full
valuation allowance against the deferred tax assets of $558,056 on the expected
future tax benefits from the net operating loss carry forwards as the management
believes it is more likely than not that these assets will not be realized in
the future.
PRC
Tax
PRC’s
legislative body, the National People’s Congress, adopted the unified Enterprise
Income Tax (“EIT”) Law on March 16, 2007. This new tax law replaces the existing
separate income tax laws for domestic enterprises and foreign-invested
enterprises and became effective on January 1, 2008. Under the new tax law, a
unified income tax rate is set at 25% for both domestic enterprises and
foreign-invested enterprises. However, there will be a transition period for
enterprises, whether foreign-invested or domestic, that are currently receiving
preferential tax treatments granted by relevant tax authorities. Enterprises
that are subject to an enterprise income tax rate lower than 25% may continue to
enjoy the lower rate and will transit into the new rate over a five year period
beginning on the effective date of the EIT Law. Enterprises that are currently
entitled to exemptions for a fixed term may continue to enjoy such treatment
until the exemption term expires. Preferential tax treatments may continue to be
granted to industries and projects that qualify for such preferential treatments
under the new law.
United
States Tax
We are
subject to income tax in the United States. No provision for income tax in the
United States has been made as we had no taxable income for the three and six
months ended December 31, 2010. The statutory tax rate is 34%.
The table
below summarizes the differences between the U.S. statutory federal rate and our
effective tax rate and as follows for the three and six months ended December
31, 2010 and 2009:
27
|
Three months
ended
December 31,
2010
|
Three months
ended
December 31,
2009
|
Six months
ended
December 31,
2010
|
Six months
ended
December 31,
2009
|
|||||||||||||
|
(unaudited)
|
(unaudited)
|
(unaudited)
|
(unaudited)
|
|||||||||||||
|
United
States Tax at statutory rate
|
$ | 2,714,865 | $ | 1,474,046 | $ | 4,140,879 | $ | 2,275,489 | ||||||||
|
Foreign
tax rate difference
|
(585,003 | ) | (454,239 | ) | (1,048,691 | ) | (636,357 | ) | ||||||||
|
Change
in valuation allowance
|
237,546 | 500 | 503,818 | 500 | ||||||||||||
|
Permanent
difference
|
(187,861 | ) | 37,583 | (295,287 | ) | (26,371 | ) | |||||||||
|
Other
reconciling items
|
(735,544 | ) | - | (675,033 | ) | - | ||||||||||
|
Income
tax expense
|
$ | 1,444,003 | $ | 1,057,890 | $ | 2,625,686 | $ | 1,613,261 | ||||||||
Our
deferred tax assets as of December 31, 2010 and June 30, 2010 are as
follows:
|
As of
|
As of
|
|||||||
|
December 31,
|
June 30,
|
|||||||
|
2010
|
2010
|
|||||||
|
(unaudited)
|
||||||||
|
Deferred
tax asset:
|
||||||||
|
Net
operating loss carry forward
|
$
|
558,056
|
$
|
308,406
|
||||
|
Stock
options and warrants
|
254,167
|
-
|
||||||
|
Total
gross deferred tax asset
|
812,224
|
308,406
|
||||||
|
Less:
valuation allowance
|
(812,224)
|
(308,406)
|
|
|||||
|
Net
deferred tax asset
|
$
|
-
|
$
|
-
|
||||
During
the three months ended December 31, 2010 and 2009, the valuation allowance
increased by approximately $237,546 and $500, respectively. During the six
months ended December 31, 2010 and 2009, the valuation allowance increased by
approximately $503,818 and $500, respectively.
VAT
Certain
of our revenues are subject to output VAT generally calculated at 6%, 13% and
17% of the selling price. Input credit relating to input VAT paid on purchases
can be used to offset the output VAT.
|
Three months
ended
December 31,
2010
|
Three months
ended
December 31,
2009
|
Six months
ended
December
31, 2010
|
Six months
ended
December
31, 2009
|
|||||||||||||
|
(unaudited)
|
(unaudited)
|
(unaudited)
|
(unaudited)
|
|||||||||||||
|
Net
value added tax expenses
|
$ | 3,024,821 | $ | 2,475,751 | $ | 5,261,236 | $ | 4,540,913 | ||||||||
28
|
19.
|
COMMITMENTS
AND CONTINGENCIES
|
As of
June 30, 2010, we had commitments to purchase land use right for future factory
expansion. The purchase price is approximately $14,746,400 (RMB 97,500,000). As
of December 31, 2010, we prepaid for approximately $12,426,268 (RMB 82,160,000),
which is included in Prepayment for Land Use Right on the consolidated balance
sheets, the remaining balance of $2,320,132 (RMB 15,340,000) as of December 31,
2010 will be paid by March 31, 2011.
As of May
2009, we entered into a contract with Yantai Tianzheng Medicine Research and
Development Co. to perform research and development on two new pharmaceutical
products, namely Fern Injection and Forsythia Capsule, on behalf of us. The
total contract price is approximately $2,268,700 (RMB 15,000,000). Yantai
Tianzheng Medicine Research and Development Co. is committed to complete all
research work require for the clinical trial within 3 years. As of
December 31, 2010, we have paid $1,255,300 (RMB 8,300,000) and the
remainder contract amount will be paid progressively in installments. The final
payment will be paid upon obtaining new drug certification from the related
government department.
On
December 9, 2010, we entered into a Transfer Agreement of Intangible Assets (the
“Transfer Agreement”) with Shandong Daxin Microbiology Pharmaceutical Industry
Co., Ltd. (“Daxin”), pursuant to which Daxin transferred to us all rights and
title in and to 14 Drug Approval Numbers for 14 traditional Chinese
medicines. The aggregate purchase price is $7,259,700 (RMB 48,000,000), of which
$2,974,566 (RMB 20,000,000) has been paid as of December 31, 2010 and the
remaining balance was paid before January 31, 2011.
There are
no other foreseeable material commitments
or contingencies as of December 31, 2010.
|
20.
|
SIGNIFICANT
CONCENTRATIONS
|
|
(a)
|
Customer Concentrations
|
We do not
have concentrations of business with any customer constituting greater than
10% of our gross sales for the three and six months ended December 31, 2010 and
2009.
We have
not experienced any significant difficulty in collecting its accounts receivable
in the past and is not aware of any financial difficulties being experienced by
its major customers.
|
(b)
|
Supplier Concentrations
|
We have
the following concentrations of business with each supplier constituting greater
than 10% of our purchases of raw materials or other
supplies:
29
|
Three
months
ended
|
Three
months
ended
|
Six
months
ended
|
Six
months
ended
|
|||||||||||||
|
December
31,
2010
|
December
31,
2009
|
December
31,
2010
|
December
31,
2009
|
|||||||||||||
|
(unaudited)
|
(unaudited)
|
(unaudited)
|
(unaudited)
|
|||||||||||||
|
Shandong
Yantai Medicine Procurement and Supply Station
|
19.0 | % | 15.2 | % | 18.5 | % | 14.8 | % | ||||||||
|
Anguo
Jinkangdi Chinese Herbal Medicine Co. Ltd
|
10.5 | % | * | 11.6 | % | * | ||||||||||
|
Anhui
DeChang Pharmaceutical Co. Ltd.
|
* | 10.8 | % | * | 12.0 | % | ||||||||||
|
Yantai
Tianyifeng Science and Technology Development Co., Ltd.
|
* | 10.9 | % | * | 10.4 | % | ||||||||||
|
* Constitutes
less than 10% of our purchase.
|
||||||||||||||||
|
21.
|
STATUTORY
RESERVES
|
According
to the laws and regulations in the PRC, we are required to provide for certain
statutory funds, namely, reserve fund by an appropriation from net profit after
taxes but before dividend distribution based on the local statutory financial
statements of the PRC company prepared in accordance with the accounting
principles and relevant financial regulations.
In the
PRC, we are required to allocate at least 10% of our net profit to the reserve
fund until the balance of such fund has reached 50% of its registered capital.
Appropriation of enterprise expansion fund are determined at the discretion of
it directors. We had satisfied statutory reserve requirement in the first
quarter of the fiscal year 2010.
The
reserve fund can only be used, upon approval by the relevant authority, to
offset accumulated losses or increase capital. The enterprise expansion fund can
only be used to increase capital upon approval by the relevant
authority.
|
22.
|
SUBSEQUENT
EVENTS
|
On
January 21, 2011, we closed a financing transaction under which we sold an
aggregate of 748,382 shares of Common Stock to a total of 42 individual
investors at $2.50 per share, for total gross proceeds of $1,870,955. The shares
were sold pursuant to separate subscription agreements between us and each
investor. All investors are domiciled in and citizens of the People's
Republic of China. As of December 31, 2010, the agreements for the
offering were in the process of being executed, a closing had not yet occurred
and shares of Common Stock had not been issued as a result. However,
certain funds had been received from prospective investors. As such, such
funds from investors were placed in restricted cash and recorded in other
payable as of December 31, 2010.
We have
performed an evaluation of subsequent events through the date of these financial
statements are issued.
30
Item
2. Management’s Discussion and Analysis of Financial Conditions of
Operations.
The
following discussion and analysis of financial condition and results of
operations relates to the operations and financial condition reported in our
unaudited condensed consolidated financial statements for the three and six
months ended December 31, 2010 and 2009, and should be read in conjunction with
such financial statements and related notes included in this report. Those
statements in the following discussion that are not historical in nature should
be considered to be forward looking statements that are inherently uncertain.
Actual results and the timing of the events may differ materially from those
contained in these forward looking statements due to a number of factors,
including those discussed in the “Cautionary Note on Forward Looking Statements”
set forth elsewhere in this Report.
Overview
We were
incorporated under the laws of the State of Nevada on January 9, 2008.
Since January 5, 2010, our business consists of the production, manufacturing
and distribution of herbal pharmaceuticals in the People’s Republic of China
(which we refer to as China or the PRC) which is based on Traditional Chinese
Medicine, or TCM. We are based in the city of Yantai, Shandong Province,
China.
Our
medicines address rheumatoid arthritis, viral infections, gynecological
diseases, cardio vascular issues and respiratory diseases. We obtained
Drug Approval Numbers in China for 29 varieties of TCM products in 2004 and an
additional 14 varieties of TCM products in 2010. We currently produce 15
varieties of such products in seven delivery systems: tablets, granules,
capsules, syrup, concentrated powder, tincture and medicinal wine. Of
these 15 products, 8 are prescription drugs and 7 are over-the-counter
products. Of our current products: (i) 5 have “exclusive” status, meaning
that we are the only company that manufactures these products in China; (ii) 2
have Certificates of Protected Variety of Traditional Chinese Medicine
(Grade Two) issued by the State Food and Drug Administration of China
(“SFDA”), which gives us exclusive or near exclusive rights to
manufacture and distribute these products, and (iii) 1 has received Chinese
patent protection with a duration of 20 years.
On
December 9, 2010, we entered into an Intangible Assets Transfer
Agreement with Shandong Daxin Microbiology Pharmaceutical Industry Co.,
Ltd. (“Daxin”), an unrelated party, pursuant to which Daxin transferred to us
all rights and title for 14 State Food and Drug Administration previously
approved traditional Chinese medicine formulas. The aggregate purchase price is
$7,259,700 (RMB 48,000,000), of which $2,974,566 (RMB 20,000,000) has been paid
as of December 31, 2010 and the remaining balance was paid before January 31,
2011. The 14 new formulas consist of two new product categories, powder
and pellet formulations, which are the most popular product formulations under
Chinese government’s Essential Drug List (EDL). Additionally, 4 of the 14
formulas are included in the EDL and an additional 5 medicines are included in
the National Drug Reimbursement List (NDRL). Inclusion on EDL or NDRL
allows for up to 100% insurance coverage by the Chinese government.
As Chinese government’s national health insurance reform starts to focus in
rural areas, drugs that are listed in EDL and EDRL have become increasing
critical for our future success. The purchase of 14 formulas expands our EDL
list from 6 to 10 and NDRL list from 12 to 17. As EDL or NDRL allows for
up to 100% insurance coverage by the Chinese government, we expect the future
demand for these drugs to increase significantly over the next few
years.
Prior to
January 5, 2010, we were a public “shell” company operating under the name “Link
Resources, Inc.” On January 5, 2010, we consummated a share exchange
transaction (the “Share Exchange”) pursuant to which we acquired Chance High,
the parent company of Yantai Bohai Pharmaceuticals Group Co. Ltd., our principal
operating subsidiary, which is a Chinese variable interest entity that we
(through a Chinese wholly-owned foreign enterprise subsidiary) control through
certain contractual arrangements. Our current organizational structure is
summarized below:
31
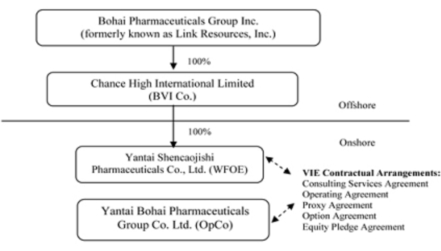
Use
of Non-GAAP Financial Measures
We make
reference to Non-GAAP financial measures in portions of this “Management’s
Discussion of Financial Condition and Results of Operations”. Management
believes that investors may find it useful to review our financial results that
exclude certain non-cash income and expense, namely changes in fair value of our
warrants, unamortized beneficial conversion features on convertible notes
converted, and option and stock-based compensation shown in the below chart, of
$2,082,024 income for the three months ended December 31, 2010 and $1,882,047
income for the six months ended December 31, 2010 due to the adoption of a
Financial Accounting Standards Board’s (“FASB”) ASC 815 accounting
standard as discussed in footnote 13 to the accompanying financial
statements.
Management
believes that these Non-GAAP financial measures are useful to investors in that
they provide supplemental information to possibly better understand the
underlying business trends and operating performance of our company. We
use these Non-GAAP financial measures to evaluate operating performance.
However, Non-GAAP financial measures should not be considered as an
alternative to net income or any other performance measures derived in
accordance with GAAP.
32
|
Three Months Ended
|
Six Months Ended
|
|||||||||||||||||||||||
|
December 31,
|
December 31,
|
|||||||||||||||||||||||
|
Increase
|
Increase
|
|||||||||||||||||||||||
|
2010
|
2009
|
(Decrease)
|
2010
|
2009
|
(Decrease)
|
|||||||||||||||||||
|
Net
Income available to Common shareholders -GAAP
|
$ | 6,540,895 | $ | 3,277,539 | $ | 3,263,356 | $ | 9,553,370 | $ | 5,079,355 | $ | 4,474,015 | ||||||||||||
|
Add
Back (Subtract):
|
||||||||||||||||||||||||
|
Change
in fair value of warrants
|
(2,949,039 | ) (a) | - | (2,949,039 | ) | (2,918,485 | ) (a) | - | (2,918,485 | ) | ||||||||||||||
|
Unamortized
beneficial conversion features on convertible notes
converted
|
785,671 | (a) | - | 785,671 | 933,094 | (a) | - | 933,094 | ||||||||||||||||
|
Change
in Option and Equity Based Compensation
|
81,344 | (b) | - | 81,344 | 103,344 | (b) | - | 103,344 | ||||||||||||||||
|
Adjusted
Net Income available to Common shareholders -non-GAAP
|
$ | 4,458,871 | $ | 3,277,539 | $ | 1,181,332 | $ | 7,671,323 | $ | 5,079,355 | $ | 2,591,968 | ||||||||||||
|
Basic
earning per share – GAAP
|
$ | 0.39 | $ | 0.25 | $ | 0.14 | $ | 0.57 | $ | 0.39 | $ | 0.18 | ||||||||||||
|
Add
back (Subtract):
|
||||||||||||||||||||||||
|
Change
in fair value of warrants
|
(0.17 | ) (a) | - | (0.17 | ) | (0.17 | ) (a) | - | (0.17 | ) | ||||||||||||||
|
Unamortized
beneficial conversion features on convertible notes
converted
|
0.05 | (a) | - | 0.05 | 0.06 | (a) | - | 0.06 | ||||||||||||||||
|
Change
in Option and Equity Based Compensation
|
0.00 | (b) | - | 0.00 | 0.00 | (b) | - | 0.00 | ||||||||||||||||
|
Adjusted
basic earning per share non-GAAP
|
$ | 0.27 | $ | 0.25 | $ | 0.02 | $ | 0.46 | $ | 0.39 | $ | 0.07 | ||||||||||||
|
Diluted
earning per share-GAAP
|
$ | 0.31 | $ | 0.25 | $ | 0.06 | $ | 0.45 | $ | 0.39 | $ | 0.06 | ||||||||||||
|
Add
back (Subtract):
|
||||||||||||||||||||||||
|
Change
in fair value of warrants
|
(0.13 | ) (a) | - | (0.13 | ) | (0.13 | ) (a) | - | (0.13 | ) | ||||||||||||||
|
Unamortized
beneficial conversion features on convertible notes
converted
|
0.04 | (a) | - | 0.04 | 0.04 | (a) | - | 0.04 | ||||||||||||||||
|
Change
in Option and Equity Based Compensation
|
0.00 | (b) | - | 0.00 | 0.01 | (b) | - | 0.01 | ||||||||||||||||
|
Adjusted
diluted earning per share non-GAAP
|
$ | 0.22 | $ | 0.25 | $ | (0.03 | ) | $ | 0.37 | $ | 0.39 | $ | (0.02 | ) | ||||||||||
|
Weighted
average number of shares
|
||||||||||||||||||||||||
|
Basic
|
16,925,928 | 13,162,500 | 16,716,691 | 13,162,500 | ||||||||||||||||||||
|
Diluted
|
22,266,662 | 13,162,500 | 22,258,835 | 13,162,500 | ||||||||||||||||||||
(a) We
adopted the provisions of a FASB accounting standard, ASC 815, which provides
standards with respect to determining whether an instrument (or embedded
feature) is indexed to an entity’s own stock (See note 13). As a result of
these measurements, we recognized non-cash gains of $2,949,039 and $2,918,485
for the six and six months ended December 31, 2010, respectively, from changes
in fair value for investor and agent warrants and non-cash charges of $785,671
and $933,094 for three and six months ended December 31, 2010, respectively, for
unamortized beneficial conversion features on convertible notes converted. There
were no such activities in 2009.
(b) We
record stock-based compensation expense pursuant to FASB’s accounting standard
regarding stock compensation which requires companies to measure compensation
cost for consultants and stock-based employee compensation plans at fair value
at the grant date and recognize the expense over the employee's requisite
service period. Under ASC Topic 718, our expected volatility
assumption is based on the historical volatility of our stock or the expected
volatility of similar entities. The expected life assumption is primarily based
on historical exercise patterns and employee post-vesting termination behavior.
The risk-free interest rate for the expected term of the option is based on the
U.S. Treasury yield curve in effect at the time of grant. For the three months
and six months ended December 31, 2010, we recognized $57,500 and $79,500 of
restricted stock as compensation expense. For the three months and six months
ended December 31, 2010, we recognized $23,844 as compensation expenses for
our stock option plan. There were no such activities in 2009.
33
Principal
Factors Affecting Our Financial Performance
We
believe that the following factors will continue to affect our financial
performance:
Sales
of Key Products
Our top
selling products as a percentage of total net revenue consist of the
following:
|
|
For the three months ended
|
For the six months ended
|
||||||||||||||
|
|
December 31
|
December 31
|
||||||||||||||
|
|
2010
|
2009
|
2010
|
2009
|
||||||||||||
|
Tongbi
Capsules
|
27.1 | % | 22.5 | % | 27.4 | % | 22.6 | % | ||||||||
|
Tongbi
Tablets
|
14.5 | % | 13.6 | % | 14.8 | % | 14.2 | % | ||||||||
|
Lung
Nourishing Syrup
|
25.7 | % | 26.0 | % | 26.6 | % | 25.2 | % | ||||||||
|
Others
|
32.7 | % | 37.9 | % | 31.2 | % | 38.0 | % | ||||||||
|
Total
|
100.0 | % | 100.0 | % | 100.0 | % | 100.0 | % | ||||||||
We expect
that a significant portion of our future revenue will continue to be derived
from sales of our top three products.
We held
the Certificates of Protected Variety of Traditional Chinese Medicine (Grade
Two) issued by the SFDA for Tongbi Capsules and Anti-flu
Granules which
gave exclusive or near-exclusive rights to manufacture and distribute these
two medicines. Tongbi Capsules’ certificates expired in September
2009 and we have filed an application for extending the protection period on
March 12, 2009. The protection status is still active during the renewal
processes. Lung Nourishing Syrup received a patent with duration of 20 years
from State Intellectual Property Office of the PRC and the patent will expire on
September 12, 2027.
Experienced
Management
Management’s
marketing strategies and business relationships gives us the ability to expand
our product market areas, which provides us with leverage to acquire less
sophisticated operators, increase production volumes, and implement quality
standards. Our future prospects depend substantially on the continued services
of our senior management team, especially our President, Chief Executive Officer
and Chairman of the Board, Mr. Qu.
Price Control
of Drugs by PRC Government
The State
Development and Reform Commission of the PRC, or SDRC, and the price
administration bureaus of the relevant provinces of the PRC in which the
pharmaceutical products are manufactured are responsible for the retail price
control over our pharmaceutical products. The SDRC sets the price ceilings
for certain pharmaceutical products in the PRC. All of our products except those
under the protection periods are subject to such price controls and could affect
our future revenue growth. However, due to the direct support of TCM
by Chinese government, China’s immense market, and our protected drugs, we are
optimistic of our continuous growth potential for TCM in
China.
Financial
Highlights
|
|
·
|
Net
revenues for the three months ended December 31, 2010 increased
32% to $22.2 million compared to the same period in 2009. Net
revenues for the six months ended December 31, 2010 increased
27.4% to $39.2 million compared to the same period in
2009.
|
34
|
|
o
|
Net
revenues for five new products that were introduced in April 2010
increased from $720,000 for the three months ended September 30, 2010 to
$1,271,000 for the three months ended December 31, 2010, an increase of
77%.
|
|
|
o
|
Increase
in net revenues was mostly derived from increase of sales from
our lead products, Lung Nourishing Syrup, Tongbi Capsules and Tongbi
Tablets, which together represented over 67% of our total net revenues for
the three months ended December 31,
2010.
|
|
|
o
|
62%
of net revenue was derived from sales of
prescription products and 38% was from
Over-the-Counter products for the three months ended December
31, 2010.
|
|
|
·
|
Net
income for the three months ended December 31, 2010 increased
100% to $6.5 million compared to the same period in
2009.
|
|
|
o
|
Net
income from operations increased 47% to $6.4
million.
|
|
|
o
|
Net
income margin increased to 30 % this quarter compared to 20% from the
same quarter last year.
|
|
|
o
|
Included
in net income was a non-cash gain of $2.9 million for changes in fair
value of warrants and non-cash charges for approximately $867,000 for
restricted stock and option based compensation as well as charges for
unamortized beneficial conversion for our convertible
notes.
|
|
|
·
|
Basic
earnings per share increased to $0.57 and diluted earnings per share
increased to $0.45 for the six months ended December 31,
2010.
|
|
|
o
|
Diluted
earnings per share increased 15% despite an increase in average shares
outstanding by 9 million shares for the six months ended December 31, 2010
compared to the same period in
2009.
|
|
|
o
|
Basic
earnings per share increased 46% for the six months ended December
31, 2010 compared to the same period in
2009.
|
|
|
·
|
Including
restricted cash, our total cash balance was $14.6 million and cash
flow from operating activities was $10.3 million for the six months
ended December 31, 2010.
|
|
|
o
|
Total
cash and cash equivalents decreased by $4.7 million for six months
ended December 31, 2010 compared to June 30,
2010.
|
|
|
o
|
Major
cash payments activities for the six months ended December 31, 2010
included $4.8 million made for deposits on the purchase of prepaid land
use rights from the Shandong provincial government for future
factory expansion, repayment of short term bank loan of $3.6
million to China Construction Bank, and
partial payments of $3 million to Shandong Daxin Microbiology
Pharmaceutical Industry Co. for the 14 SFDA approved
TCM.
|
35
Operating
Results
Comparison
of the three months ended December 31, 2010 and 2009
The
following table sets forth key components of our results of operations for the
three months ended December 31, 2010 and 2009, in US dollars:
|
For The Three Months Ended
|
||||||||||||||||
|
December 31,
|
||||||||||||||||
|
Percentage
|
||||||||||||||||
|
2010
|
2009
|
Differences
|
Increase
|
|||||||||||||
|
Net
revenues
|
$ | 22,204,348 | $ | 16,846,303 | $ | 5,358,045 | 31.8 | % | ||||||||
|
Cost
of revenue
|
(4,681,045 | ) | (2,662,427 | ) | (2,018,618 | ) | 75.8 | % | ||||||||
|
Gross
profit
|
17,523,303 | 14,183,876 | 3,339,427 | 23.5 | % | |||||||||||
|
Selling,
general, and administrative expenses
|
(11,105,260 | ) | (9,813,217 | ) | (1,292,043 | ) | 13.2 | % | ||||||||
|
Income
from operations
|
6,418,043 | 4,370,659 | 2,047,384 | 46.8 | % | |||||||||||
|
Total
other income (expenses)
|
1,566,855 | (35,230 | ) | 1,602,085 | N/A | |||||||||||
|
Income
before provision for income taxes
|
7,984,898 | 4,335,429 | 3,649,469 | 84.2 | % | |||||||||||
|
Provision
for income taxes
|
(1,444,003 | ) | (1,057,890 | ) | (386,113 | ) | 36.5 | % | ||||||||
|
Net
income
|
$ | 6,540,895 | $ | 3,277,539 | $ | 3,263,356 | 99.6 | % | ||||||||
The
following table sets forth key components as a percentage of net revenue for the
three months ended December 31, 2010 and 2009:
|
For The Three Months Ended
|
||||||||
|
December 31,
|
||||||||
|
2010
|
2009
|
|||||||
|
Net
revenues
|
100.0 | % | 100.0 | % | ||||
|
Cost
of sales
|
(21.1 | )% | (15.8 | )% | ||||
|
Gross
profit
|
78.9 | % | 84.2 | % | ||||
|
Selling,
general, and administrative expenses
|
(50.0 | )% | (58.3 | )% | ||||
|
Income
from operations
|
28.9 | % | 25.9 | % | ||||
|
Total
other income(expenses)
|
7.1 | % | (0.2 | )% | ||||
|
Income
before provision for income taxes
|
36.0 | % | 25.7 | % | ||||
|
Provision
for income taxes
|
(6.5 | )% | (6.2 | )% | ||||
|
Net
income
|
29.5 | % | 19.5 | % | ||||
36
Net
Revenues
Net
revenues are comprised of sales of 15 traditional Chinese medicines in China.
Net revenues for the three months ended December 31, 2010 increased by
$5,385,045 or 31.8% to $22,204,348 as compared to $16,846,303 for the three
months ended December 31, 2009. This increase was primarily due to
increased revenues from our three lead products, Lung
Nourishing Syrup, Tongbi Capsules and Tongbi Tablets, which together
accounted for over 67% of our total net revenues. All of our
lead products are listed for coverage and reimbursement under national
medical insurance program starting in December 2009. The increase was also
due to sales from five new products we initiated in the quarter ended June
30, 2010. Although the new product sales only represented less than 6%
of total net revenues in the quarter ended December 31, 2010, the net
revenues for the five new products in the quarter ended December 31, 2010
increased by 77% compared to the quarter ended September 30, 2010. The
sale of our prescription drug products for the three months ended December
31, 2010 represented 61% of total net revenue compared to 59% from the same
period in last year. The increase in prescription drug sales was due
to increases in sales from Tongbi Capsules and Tongbi Tablets.
We
anticipate our overall net revenues will continue to increase due to a national
medical and health plan initiated by the Chinese government
in 2009, which plan will eventually cover individual health
insurance for over 90% of China’s population by 2011 and
includes traditional Chinese medicines for coverage and reimbursement from
hospitals and medical centers all over China.
Cost
of Revenues
Cost of
revenues is comprised of raw material costs, labor cost, overhead costs
associated with the manufacturing processes and related expenses which are
directly attributable to the Company’s revenues. Our cost of
revenues for the three months ended December 31, 2010 was $4,681,045 as
compared to $2,662,427 for the three months ended December 31, 2009,
representing an increase of $2,018,618, or 75.8%. The increase in cost
of revenues was mainly attributable to the increase in total cost of raw
material as a result of increase of overall sales and five new products we
introduced this year as well as an increase in cost of raw material for two
other products, Danqi Tablet and Anti-Flu Granules, in the
quarter ended December 31, 2010 compared to the same quarter last
year.
Gross
Profit
Gross
profit represents the difference between net revenue and cost of revenues. We
achieved gross profit of $17,523,303 for the three months ended December 31,
2010, compared to $14,183,876 for the same fiscal quarter in 2009, representing
an increase of $3,339,427, or 23.5%, over the same quarter of fiscal year
2009. Our overall gross profit margins as a percentage of revenue
decreased by approximately 5.3% this fiscal quarter compared to the same quarter
last year. The decrease of gross profit margin was principally due to lower
gross profit margins from our five new products resulting from higher
manufacturing costs and lower unit sales price when introducing the 5
new products to the market. The decrease of gross margin was also due to
cost increases on raw material for two of our products, Danqi
Tablet s and Anti-Flu Granules.
Selling,
General and Administrative Expenses
Our
selling, general and administrative expenses increased by $1,292,043 to
$11,105,260, for the three months ended December 31, 2010 compared to $9,813,217
for the same fiscal quarter end in 2009. This increase was mainly
attributable to an increase in advertising and promotional expenses of
approximately $325,000, travel and accommodation expenses of $625,000, and
Staff expenses of $253,000 in the quarter ended December 31, 2010 compared
to the same fiscal quarter last year. The overall increase
in selling, general, and administrative expenses was related to services
supporting overall increase on sale activities and new product promotions.
The percentage of selling, general, and administrative expenses to net revenues
was 50% and 58% for the three months ended December 31, 2010 and 2009,
respectively, representing a decrease of 8% as a percentage of net
revenues.
37
Total
Other Income (Expenses)
Total
other income (expenses) is comprised of interest income and expense, changes in
fair value of derivative instruments and other non-operating income (expense).
Total other income were $1,566,855 for the three months ended December
31, 2010 compared to total other expenses of $35,230 in the quarter ended
December 31, 2009, an increase of other income of $1,602,085. The increase
of other income was principally due to amortization of deferred fees of
$244,059, effective interest charges of $291,749, and unamortized BCF on warrant
discount of $785,671 offset by a gain on changes in fair value of warrant
of $2,949,039 for convertible notes in connection with our private
placement on January 5, 2010. There were no such activities for the same
period in 2009.
Provision
for Income Tax
Our
provisions for income taxes for the three months ended December 31, 2010 and
2009 were $1,444,003 and $1,057,890, an increase of $386,113 or
37 % from this quarter over the same quarter in last year. The
increase in income tax was principally due to an increase in taxable
income under the PRC law (see footnote 18).
Net
Income
We had a
net income of $6,540,895 for the three months ended December 31, 2010, as
compared to net income of $3,277,539 for the three months ended December 31,
2009, an increase in net income of $3,263,356, or 99.6 %. This
translates to basic net income per common share of $0.39 and $0.25, and diluted
net income per common share of $0.31 and $0.25, for the three months ended
December 31, 2010 and 2009, respectively. The increase in net income was
primarily attributable to increase in total gross profit of
$3,339,427 and total other income of $1,602,085 offset by increase in
selling, general and administrative expenses of $1,292,043 and tax
provision of $386,113 this fiscal quarter compared to the same quarter in prior
year.
Other
income this quarter comprised of non-cash charges for unamortized BCF on warrant
discount of $785,671 and non-cash credits for changes in fair value of warrants
for $2,949,039 for convertible notes in connection with our private placement on
January 5, 2010.
38
The
following table sets forth key components of our results of operations for the
six months ended December 31, 2010 and 2009, in US dollars:
|
For The six Months Ended
|
||||||||||||||||
|
December 31,
|
||||||||||||||||
|
Percentage
|
||||||||||||||||
|
2010
|
2009
|
Differences
|
Increase
|
|||||||||||||
|
Net
revenues
|
$ | 39,233,996 | $ | 30,800,317 | $ | 8,433,679 | 27.4 | % | ||||||||
|
Cost
of revenues
|
(8,128,311 | ) | (4,879,940 | ) | (3,248,371 | ) | 66.6 | % | ||||||||
|
Gross
profit
|
31,105,685 | 25,920,377 | 5,185,308 | 20.0 | % | |||||||||||
|
Selling,
general, and administrative expenses
|
(19,720,019 | ) | (19,069,289 | ) | (650,730 | ) | 3.4 | % | ||||||||
|
Income
from operations
|
11,385,666 | 6,851,088 | 4,534,578 | 66.2 | % | |||||||||||
|
Total
other income (expenses)
|
793,390 | (158,472 | ) | 951,862 | N/A | |||||||||||
|
Income
before provision for income taxes
|
12,179,056 | 6,692,616 | 5,486,440 | 82.0 | % | |||||||||||
|
Provision
for income taxes
|
(2,625,686 | ) | (1,613,261 | ) | (1,012,425 | ) | 62.8 | % | ||||||||
|
Net
income
|
$ | 9,553,370 | $ | 5,079,355 | $ | 4,474,015 | 88.1 | % | ||||||||
The
following table sets forth key components as a percentage of net revenue for the
six months ended December 31, 2010 and 2009:
|
For The six Months Ended
|
||||||||
|
December 31,
|
||||||||
|
2010
|
2009
|
|||||||
|
Net
revenues
|
100.0 | % | 100.0 | % | ||||
|
Cost
of sales
|
(20.7 | )% | (15.8 | )% | ||||
|
Gross
profit
|
79.3 | % | 84.2 | % | ||||
|
Selling,
general, and administrative expenses
|
(50.3 | )% | (62.0 | )% | ||||
|
Income
from operations
|
29.0 | % | 22.2 | % | ||||
|
Total
other income(expenses)
|
2.0 | % | (0.5 | )% | ||||
|
Income
before provision for income taxes
|
31.0 | % | 21.7 | % | ||||
|
Provision
for income taxes
|
(6.7 | )% | (5.2 | )% | ||||
|
Net
income
|
24.3 | % | 16.5 | % | ||||
39
Net
Revenues
Net
revenues are comprised of sales of 15 traditional Chinese medicines in China.
Net revenues for the six months ended December 31, 2010 increased by
approximately $8,433,679 or 27.4% to $39,233,996 as compared to $30,800,317 for
the six months ended December 31, 2009. This increase was primarily due to
increased revenues from our three lead products, Lung Nourishing Syrup, Tongbi
Capsules and Tongbi Tablets, which together accounted for over 69% of our total
net revenues for the six months ended December 31, 2010. All of our lead
products are listed for coverage and reimbursement under national medical
insurance program starting in December 2009. The increase was also due to sales
from five new products we initiated in the quarter ended June 30, 2010. Although
the new product sales only represented less than 6% of total net revenues for
the three months ended December 31, 2010, the net revenues for the five new
products for the three months ended December 31, 2010 increased by 77% compared
to the three months ended September 30, 2010. The sale of our prescription drug
products for the six months ended December 31, 2010 represented 61% of total net
revenue compared to 59% from the same period in last year. The increase in
prescription sales was due to increases in sales from Tongbi Capsules and Tongbi
Tablets.
We
anticipate our overall net revenue will continue to increase due to a national
medical and health plan initiated by the Chinese government in 2009, which
plan will eventually cover individual health insurance for over 90% of
China’s population by 2011 and includes traditional Chinese medicines for
coverage and reimbursement from hospitals and medical centers all over
China.
Cost
of Revenues
Cost of
revenues is comprised of raw material costs, labor cost, overhead costs
associated with the manufacturing processes and related expenses which are
directly attributable to the Company’s revenues. Our cost of
revenues for the six months ended December 31, 2010 was $8,128,311 as
compared to $4,879,940 for the six months ended December 31, 2009, representing
an increase of $3,248,371, or 66.6%. The increase in cost of
revenues was mainly attributable to the increase in total cost of raw
material as a result of increase of overall sales and five new products we
introduced this year. The increase was also due to an increase in cost of
raw material for two other products, Danqi Tablet and Anti-Flu
Granules, for the six months ended December 31, 2010 compared to the
same quarter last year.
Gross
Profit
Gross
profit represents the difference between net revenues and cost of
revenues. We achieved gross profit of $31,105,685 for the six months ended
December 31, 2010, compared to $25,920,377 for the same fiscal quarter in 2009,
representing an increase of $5,185,308, or 20.0%, over the same period of
fiscal year 2009. Our overall gross profit margins as a percentage of
revenue decreased by approximately 4.9% this fiscal year to date compared to the
same period last year. The decrease of gross profit margin was principally due
to lower gross profit margins from our five new products resulting from higher
manufacturing costs and lower unit sales price when introducing the 5
new products to the market. The decrease of gross margin was also due to
cost increases on raw material for two of our products, Danqi
Tablet s and Anti-Flu Granules.
Selling,
General and Administrative Expenses
Our
selling, general and administrative expenses increased by $650,730 to
$19,720,019, for the six months ended December 31, 2010 compared to $19,069,289
for the same fiscal period end in 2009. This increase was mainly
attributable to an increase in advertising and promotional expenses
of approximately $962,000, travel and accommodation expenses
of $534,000, and conference expenses for $560,000 offset by decrease on
commission expenses of $931,000 and other operating expenses of $818,000 for the
six months ended December 31, 2010 compared to the same fiscal period last year.
The overall increase in selling, general, and administrative expenses
was related to services supporting overall increase in sale activities and
new product promotions. The percentage of selling, general, and
administrative expenses to net revenues was 50% and 62% for the six months ended
December 31, 2010 and 2009, respectively, representing a decrease of 12% as a
percentage of net revenues.
40
Total
Other Income (Expenses)
Total
other income (expenses) are comprised of interest income and expense, changes in
fair value of derivative instruments and other non-operating income (expense).
Total other income were $793,390 for the six month period ended
December 31, 2010 compared to total other expenses of $158,472 for the same
period ended December 31, 2009, an increase of other income of $951,862.
The increase of other income was principally due to amortization of deferred
fees of $504,024, effective interest charges of $548,466, and unamortized BCF on
warrant discount of $933,094 offset by a gain from changes in fair value of
warrants of $2,918,486 for convertible notes in connection with our private
placement on January 5, 2010. There were no such activities for the same
period in 2009.
Provision
for Income Taxes
Our
provisions for income taxes for the six months ended December 31, 2010 and 2009
were $2,625,686 and $1,613,261, an increase of $1,012,425 or 62.8 %
from the six months ended December 31, 2010 over the same period in the
prior year. The increase in income taxes was primarily due
to an increase in taxable income under the PRC law (see footnote
18).
Net
Income
We had
net income of $9,553,370 for the six months ended December 31, 2010, as
compared to net income of $5,079,355 for the six months ended December 31, 2009,
an increase of $4,474,015, or 88.1 %. This translates to basic net
income per common share of $0.57 and $0.39, and diluted net income per common
share of $0.45 and $0.39, for the six months ended December 31, 2010 and 2009,
respectively. The increase in net income was primarily attributable to
increase in gross profit of $5,185,308 and total other income of
$951,862 offset by increase in selling, general and administrative expenses of
$650,730 and tax provision of $1,012,425 this fiscal year to date compared
to the same period in prior year.
Net
income for the six months ended on December 31, 2010 also comprised of non-cash
charges for unamortized BCF on warrant discount of $933,094 and a gain on
changes in fair value of warrants for $2,918,486 for convertible notes in
connection with our private placement on January 5, 2010.
Liquidity
and Capital Resources
Liquidity
is the ability of a company to generate adequate amounts of cash to meet its
needs for cash. As of December 31, 2010, we had cash and cash equivalents
of $12,422,418 and restricted cash of $2,151,068, substantially almost all of
which is located in financial institutions in China. The following table
provides detailed information about our net cash flow for financial statement
periods presented in this report:
41
Summary of Cash Flow Statements
|
For the six months ended
|
||||||||
|
December 31
|
||||||||
|
2010
|
2009
|
|||||||
|
Net cash provided by operating activities
|
$ | 6,142,276 | $ | 6,648,287 | ||||
|
Net
cash (used in) investing activities
|
(7,762,917 | ) | (235,506 | ) | ||||
|
Net
cash (used in) financing activities
|
(3,516,681 | ) | (1,062,165 | ) | ||||
|
Effect
of foreign currency translation on cash and cash
equivalents
|
410,659 | 48,126 | ||||||
|
Net
(decrease) increase in cash and cash equivalent
|
$ | (4,726,664 | ) | $ | 5,398,742 | |||
On
January 5, 2010, pursuant to a Securities Purchase Agreement with 128 accredited
investors, we sold 6,000,000 units for aggregate gross proceeds of $12,000,000,
each unit consisting of an 8% senior convertible promissory note in the
principal amount of $2 , or the Notes, and one common stock purchase
warrant , or the Warrants. The Notes bear interest at 8%
per annum, payable quarterly in arrears on the last day of each of
our fiscal quarter s. No principal payments are required until
maturity of the Notes on January 5, 2012. Each Note, plus all accrued but unpaid
interest thereon, is convertible, in whole but not in part, at any time at
the option of the holder, into shares of the Company ’ s common stock,
par value $0.001 per share, at a conversion price of $2.00 per share, subject to
adjustment as set forth in the Note.
Effective
as of June 30, 2010, we entered into an Amendment and Agreement with the
Investors, pursuant to which we and the Investors agreed to make certain
amendments to the Notes and the Warrants. Pursuant to the Amendment, the
anti-dilution protection provisions i n the Notes and the Warrants
were eliminated and a provision specifically precluding net cash settlement by
the Company of the Notes and the Warrants was added. In return, and
subject to certain non-financing exceptions, we agreed not to issue any new
equity securities at a price per share below $2.20 until the earlier of (i)
January 5, 2013 or (ii) the date on which, collectively with any prior
conversions or exercises of Notes and Warrants, 75% of the principal face value
of the Notes in the aggregate ha s been converted into shares of
Common Stock and Warrants representing, in the aggregate, 75% of the aggregate
shares of Common Stock underlying the Warrants have been exercised.
Comparison
of Six Months Ended December 31, 2010 and 2009
Net
Cash Provided by Operating Activities
Net cash
provided by operating activities totaled $6,142,276 for the six months ended
December 31, 2010 as to net cash provided by operating activities of $6,648,287
for the six months ended December 31, 2009. The decrease in net cash provided by
operating activities was primarily due to increases in net income and other
payable balances offset by increase in accounts receivable, other receivables,
and inventory balances. We expect our cash flow from operating activities to
maintain at positive flow due to strong support of TCM products from the Chinese
government attributable to a national medical and health plan initiated by the
Chinese government in 2009, which will eventually cover individual health
insurance for over 90% of China’s population by 2011 and includes traditional
Chinese medicines for coverage and reimbursement from hospitals and medical
centers all over China.
42
Net
Cash Used In Investing Activities
Net cash
used in investing activities was $7,762,917 for the six months ended
December 31, 2010 and $235,506 for the six months ended December 31, 2009.
The increase in cash used in investing activities was due to our cash
payment of approximately $4.7 million for the purchase of leased land use rights
from the Shandong provincial government in January 2010 and cash payment of
intangible assets for approximately $3.0 million (RMB 20,000.000) for 14 SFDA
approved formulas. The aggregate purchase price is approximately
$14,556,400 (RMB 97,500,000). We have prepaid approximately $5,082,614
(RMB 32,160,000) during the six months ended December 31, 2010. As of
December 31, 2010, we had prepaid for approximately $12,426,268 (RMB
82,160,000), which is included in Prepayment for Land Use Right on the
consolidated balance sheets, the remaining balance of $2,320,132 (RMB
15,340,000) as of December 31, 2010 will be paid by March 31, 2011. The total
purchase cost for the 14 SFDA approved formulas is $7,259,700 or RMB 48,000,000.
See footnote 19.
Net
Cash Used in Financing Activities
Net cash
used by financing activities totaled $3,516,681 for the six months ended
December 31, 2010 as compared to net cash used in financing activities of
$1,062,165 for the same period in 2009. The reason for the increase in cash used
in financing activities was due to a decrease in proceeds from borrowings for
the six months ended December 31, 2010 compared to the same period in
2009.
Cash Position
As of
December 31, 2010, we had cash of $12,422,418 as compared to $17,149,082 as of
June 30, 2010, a decrease of $4,726,664. This decrease was due primarily
to increase in cash from operating activities of approximately $3.7 million
offset by cash payment of approximately $5.0 million for the purchase of leased
land use rights from the Shandong provincial government and cash payment of $4.5
million for short term bank loan.
We
believe that we can meet our liquidity and capital requirements for our
ongoing operations from our currently available working capital and maintain our
operations at our current levels.
Critical
Accounting Policies and Estimates
As
discussed in Part II, Item 7, Management’s Discussion and Analysis of Financial
Condition and Results of Operations, of our Annual Report on Form 10-K for the
fiscal year ended June 30, 2010, we consider our use of estimate, account
receivables, revenue recognition, inventories, property plant and equipment, and
income taxes to be the most critical in understanding the judgments that are
involved in preparing our consolidated financial statements. There have
been no significant changes to these estimates in the three and six months ended
December 31, 2010.
Recent
Accounting Pronouncements Adopted
Recent
Accounting Pronouncements Not Yet Adopted
See Note
3 to condensed consolidated financial statements included in Item 1, Financial
Information, of this Quarterly Report on Form 10-Q.
43
The
following table summarizes our contractual obligations as of December 31, 2010,
and the effect these obligations are expected to have on our liquidity and cash
flows in future periods.
|
Payments Due by Period
|
||||||||||||||||||||
|
Total
|
Less than 1 year
|
1-3 Years
|
4-5 years
|
5 Years+
|
||||||||||||||||
|
Contractual
Obligations:
|
||||||||||||||||||||
|
Purchase
of land use rights
|
$ | 2,320,132 | $ | 2,320,132 | $ | - | $ | - | $ | - | ||||||||||
|
Bank
loans
|
899,906 | 899,906 | - | - | - | |||||||||||||||
|
Research
and development
|
1,013,400 | 1,013,400 | - | - | - | |||||||||||||||
|
Convertible
notes
|
10,550,000 | - | 10,550,000 | - | - | |||||||||||||||
|
Purchase
of intangible assets (Drug Approval Numbers for Chinese
medicines)
|
4,234,800 | 4,234,800 | - | - | - | |||||||||||||||
|
Total
Contractual Obligations:
|
$ | 19,018,238 | $ | 8,468,238 | $ | 10,550,000 | $ | - | $ | - | ||||||||||
Other than discussed above, there are
no other foreseeable material commitments
or contingencies as of December 31, 2010.
We did not engage in any “off-balance
sheet arrangements” (as that term is defined in Item 303(a)(4)(ii) of
Regulation S-K) during the six months ended December 31, 2010. We have not
entered into any financial guarantees or other commitments to guarantee the
payment obligations of any third parties. We have not entered into any
derivative contracts that are indexed to our shares and classified as
stockholder ’ s equity or that are not reflected in our condensed
consolidated financial statements. Furthermore, we do not have any retained or
contingent interest in assets transferred to an unconsolidated
entity that serves as credit, liquidity or market risk support to such entity.
We do not have any variable interest in any unconsolidated entity that provides
financing, liquidity, market risk, or credit support to us or engages in
leasing, hedging, or research and development services with us.
|
Item
3.
|
Quantitative
and Qualitative Disclosures about Market
Risk
|
Not
applicable
|
Item
4T.
|
Controls
and Procedures
|
Evaluation
of Disclosure Controls and Procedures
As of
December 31, 2010, the quarterly period covered by this report, our President
and Chief Executive Officer and our Chief Financial Officer (the “Certifying
Officers”), conducted evaluations of the Company’s disclosure controls and
procedures. As defined under Sections 13a–15(e) and 15d–15(e) of the
Securities Exchange Act of 1934, as amended (the “Exchange Act”), the term
“disclosure controls and procedures” means controls and other procedures of an
issuer that are designed to ensure that information required to be disclosed by
the issuer in the reports that it files or submits under the Exchange Act is
recorded, processed, summarized and reported, within the time periods specified
in the SEC’s rules and forms. Disclosure controls and procedures include
without limitation, controls and procedures designed to ensure that information
required to be disclosed by an issuer in the reports that it files or submits
under the Exchange Act is accumulated and communicated to the issuer’s
management, including the Certifying Officers, to allow timely decisions
regarding required disclosures.
44
Based on
this evaluation, the Certifying Officers have concluded that our disclosure
controls and procedures were, due to certain significant deficiencies, not
effective to ensure that material information is recorded, processed, summarized
and reported by our management on a timely basis in order to comply with our
disclosure obligations under the Exchange Act and the rules and regulations
promulgated thereunder.
A
significant deficiency is a deficiency, or a combination of deficiencies, in
internal control over financial reporting that is less severe than a material
weakness(within the meaning of PCAOB Auditing Standard No. 5) yet important
enough to merit attention by those responsible for oversight of a company’s
financial reporting.
The
significant deficiencies identified by the Certifying Officers continue to be as
described in our Annual Report on Form 10-K for the fiscal year ending June 30,
2010, which was filed with the SEC on September 29, 2010. As a result, the
Certifying Officers and our board of directors are continuing to asses on our
internal control over financial reporting and our disclosure controls and
procedures in an attempt to address such significant deficiencies.
Changes
in Internal Control over Financial Reporting
Subject
to the foregoing disclosure, there were no changes in our internal control over
financial reporting during the three months ended December 31, 2010 that
materially affected, or are reasonably likely to materially affect, our internal
control over financial reporting.
Limitations
on the Effectiveness of Internal Controls
Readers
are cautioned that our management does not expect that our disclosure controls
and procedures or our internal control over financial reporting will necessarily
prevent all fraud and material error. An internal control system, no matter how
well conceived and operated, can provide only reasonable, not absolute,
assurance that the objectives of the control system are met. Because of the
inherent limitations in all control systems, no evaluation of controls can
provide absolute assurance that all control issues and instances of fraud, if
any, within the Company have been detected. The design of any system of controls
also is based in part upon certain assumptions about the likelihood of
future events, and there can be no assurance that any control design will
succeed in achieving its stated goals under all potential future conditions.
Over time, control may become inadequate because of changes in conditions, or
the degree of compliance with the policies or procedures may
deteriorate.
45
|
Item
1.
|
Legal
Proceedings
|
From time
to time, we may become involved in various lawsuits and legal proceedings, which
arise in the ordinary course of business. However, litigation is subject to
inherent uncertainties, and an adverse result in these or other matters may
arise from time to time that may harm business. We are currently not aware of
any such legal proceedings or claims that will have, individually or in the
aggregate, a material adverse affect on our business, financial condition or
operating results.
|
Item
2.
|
Unregistered
Sales of Equity Securities and Use of
Proceeds
|
On
January 21, 2011, we closed a financing transaction under which we sold an
aggregate of 748,382 shares (the “Shares”) of Common Stock to a total of 42
individual investors (the “Investors”) at $2.50 per share, for total gross
proceeds of $1,870,955. The Shares were sold pursuant to separate
subscription agreements between us and each Investor, dated as of January 21,
2011, the date on which the Investors’ subscriptions were accepted by the
Company. All of the Investors are domiciled in and citizens of the
People’s Republic of China. The issuance of the Shares was made in
reliance on the exemption from registration provided by Regulation S of the
Securities Act of 1933, as amended, as an offshore transaction involving
non-U.S. persons. The proceeds of this financing will be used for general
working capital. As of December 31, 2010, the agreements for the
offering were in the process of being executed, a closing had not yet occurred
and Shares had not been issued as a result. However, certain funds
had been received from prospective Investors. As such, such funds
from Investors were placed in restricted cash and recorded in other payable as
of December 31, 2010.
On
November 10, 2010, we issued 25,000 shares of restricted Common Stock to a third
party in return for service, and the restricted stock vested
immediately. The issuance of such shares was made in reliance on the
exemption from registration under Securities Act of 1933, as
amended.
|
Item
4.
|
Removed
and Reserved
|
|
Item
5.
|
Other
Information
|
|
Item
6.
|
Exhibits
|
(a) Exhibits
|
Exhibit
Number
|
Description
of Exhibit
|
|
|
31.1*
|
Certification
of Principal Executive Officer pursuant to Rule 13a-14 and Rule 15d-14(a),
promulgated under the Securities and Exchange Act of 1934, as
amended.
|
|
|
31.2*
|
Certification
of Principal Financial Officer pursuant to Rule 13a-14 and Rule 15d 14(a),
promulgated under the Securities and Exchange Act of 1934, as
amended.
|
|
|
32.1*
|
Certification
pursuant to 18 U.S.C. Section 1350, as adopted pursuant to Section 906 of
the Sarbanes-Oxley Act of 2002 (Chief Executive
Officer).
|
|
|
32.2*
|
Certification
pursuant to 18 U.S.C. Section 1350, as adopted pursuant to Section 906 of
the Sarbanes-Oxley Act of 2002 (Chief Financial
Officer).
|
* Filed
herewith
46
SIGNATURES
In
accordance with the requirements of the Exchange Act, the registrant caused this
report to be signed on its behalf by the undersigned, thereunto duly
authorized.
|
Bohai
Pharmaceuticals Group, Inc.
|
||
|
February
14, 2011
|
By:
|
/s/
Hongwei Qu
|
|
Hongwei
Qu
Chief
Executive Officer
(Principal
Executive Officer)
|
||
|
February
14, 2011
|
By:
|
/s/ Gene
Hsiao
|
|
Gene
Hsiao
Chief
Financial Officer
(Principal
Accounting
Officer)
|
||
47