Attached files
| file | filename |
|---|---|
| 8-K - 8-K - AIkido Pharma Inc. | a11-5715_18k.htm |
Exhibit 99.1
|
|
Spherix Incorporated (Nasdaq: SPEX) February 2011 |
|
|
Forward-Looking Statements This presentation contains forward-looking statements made pursuant to provisions of Section 21E of the Securities Exchange Act of 1934. Investors are cautioned that such statements, including statements relating to planned clinical study design, regulatory and business strategies, plans and objectives of management and growth opportunities for existing or proposed products, constitute forward-looking statements which involve risks and uncertainties that could cause actual results to differ materially from those anticipated by the forward-looking statements. The risks and uncertainties include, without limitation, risks that product candidates may fail in the clinic or may not be successfully marketed or manufactured, we may lack financial resources to complete development of D-tagatose, the FDA may interpret the results of studies differently than us, competing products may be more successful, demand for new pharmaceutical products may decrease, the biopharmaceutical industry may experience negative market trends, our continuing efforts to develop D-tagatose may be unsuccessful, our common stock could be delisted from the Nasdaq Capital Market, and other risks and challenges detailed in our filings with the U.S. Securities and Exchange Commission. You are cautioned not to place undue reliance on any forward-looking statements that speak only as of the date of this presentation. We undertake no obligation to publicly release the results of any revisions to these forward-looking statements that may be made to reflect events or circumstances that occur after the date of this presentation or to reflect the occurrence of unanticipated events. |
|
|
Company Description Core expertise in scientific and technical aspects of drug and food development Operates two subsidiaries Biospherics: Pharmaceutical development of D-tagatose and pipeline products Dyslipidemias Atherosclerosis Metabolic Syndrome and Diabetes Spherix Consulting: Scientific consulting on food and drug approvals for clients worldwide |
|
|
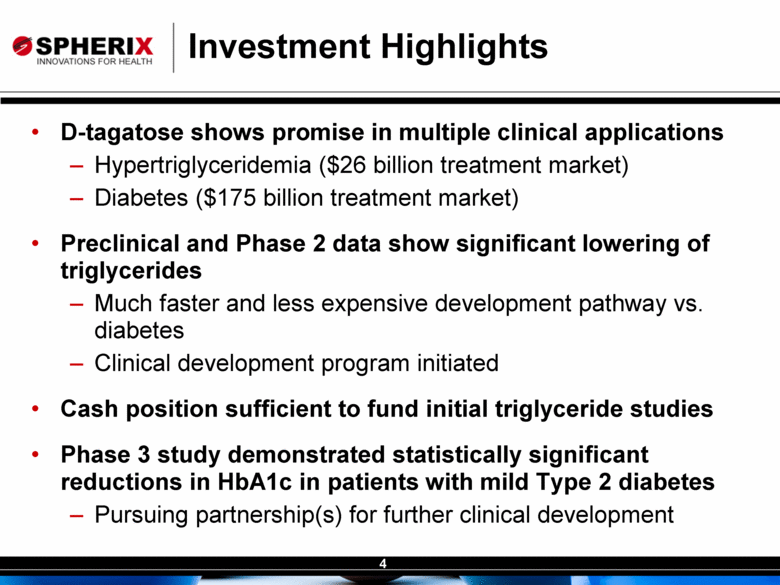
Investment Highlights D-tagatose shows promise in multiple clinical applications Hypertriglyceridemia ($26 billion treatment market) Diabetes ($175 billion treatment market) Preclinical and Phase 2 data show significant lowering of triglycerides Much faster and less expensive development pathway vs. diabetes Clinical development program initiated Cash position sufficient to fund initial triglyceride studies Phase 3 study demonstrated statistically significant reductions in HbA1c in patients with mild Type 2 diabetes Pursuing partnership(s) for further clinical development |
|
|
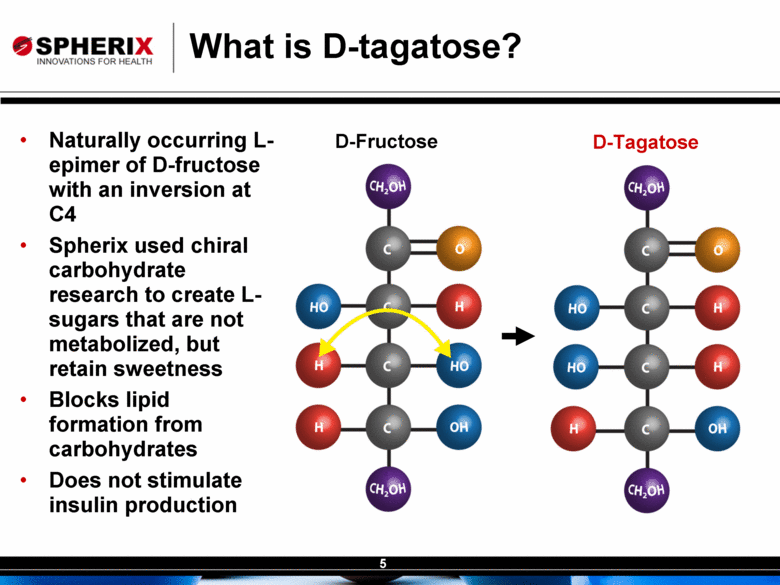
What is D-tagatose? D-Tagatose D-Fructose Naturally occurring L-epimer of D-fructose with an inversion at C4 Spherix used chiral carbohydrate research to create L-sugars that are not metabolized, but retain sweetness Blocks lipid formation from carbohydrates Does not stimulate insulin production |
|
|
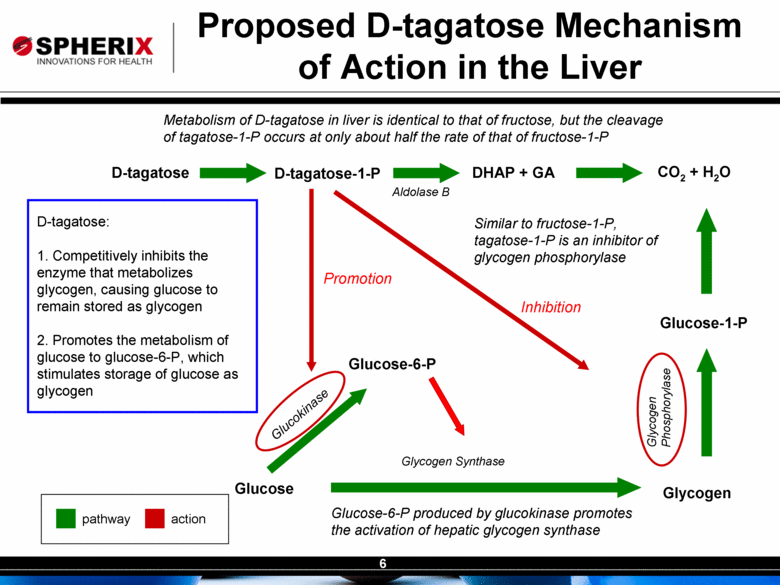
Proposed D-tagatose Mechanism of Action in the Liver Metabolism of D-tagatose in liver is identical to that of fructose, but the cleavage of tagatose-1-P occurs at only about half the rate of that of fructose-1-P Similar to fructose-1-P, tagatose-1-P is an inhibitor of glycogen phosphorylase Glucose Glucose-6-P Glycogen Glucokinase Glycogen Synthase Glucose-6-P produced by glucokinase promotes the activation of hepatic glycogen synthase CO2 + H2O Glucose-1-P Glycogen Phosphorylase D-tagatose D-tagatose-1-P DHAP + GA Aldolase B pathway action D-tagatose: 1. Competitively inhibits the enzyme that metabolizes glycogen, causing glucose to remain stored as glycogen 2. Promotes the metabolism of glucose to glucose-6-P, which stimulates storage of glucose as glycogen Promotion Inhibition |
|
|
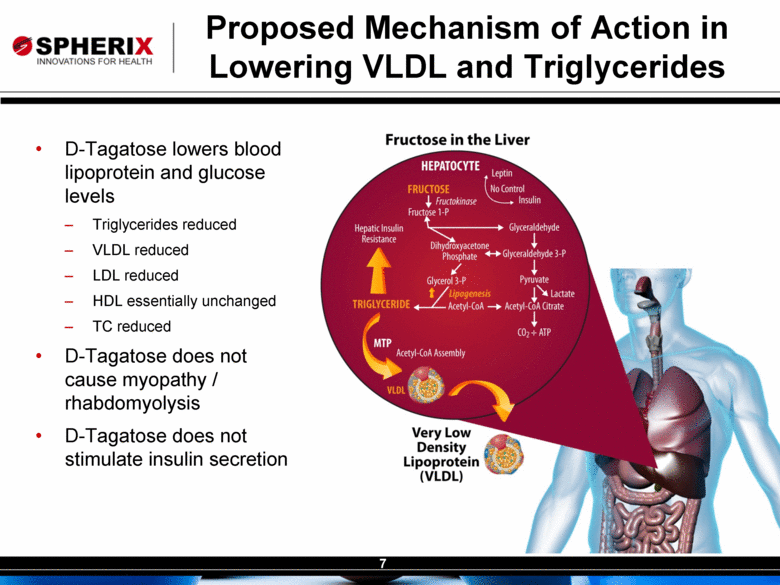
Proposed Mechanism of Action in Lowering VLDL and Triglycerides D-Tagatose lowers blood lipoprotein and glucose levels Triglycerides reduced VLDL reduced LDL reduced HDL essentially unchanged TC reduced D-Tagatose does not cause myopathy / rhabdomyolysis D-Tagatose does not stimulate insulin secretion |
|
|
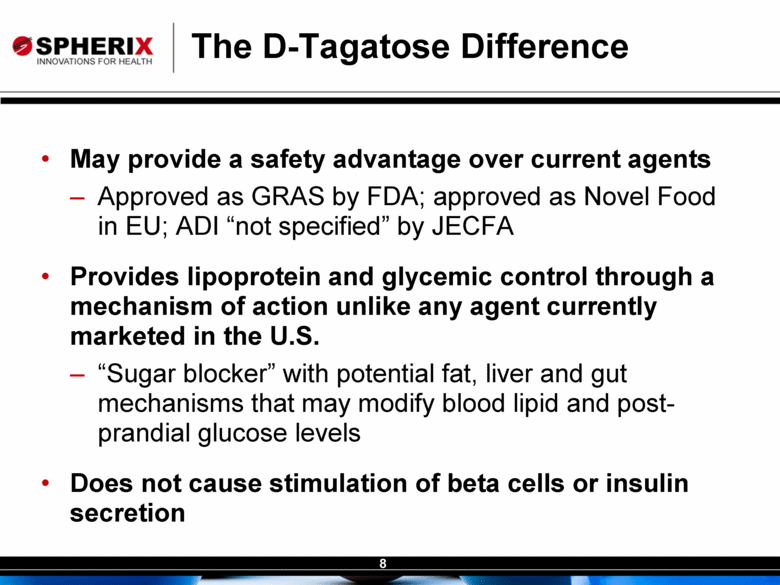
The D-Tagatose Difference May provide a safety advantage over current agents Approved as GRAS by FDA; approved as Novel Food in EU; ADI “not specified” by JECFA Provides lipoprotein and glycemic control through a mechanism of action unlike any agent currently marketed in the U.S. “Sugar blocker” with potential fat, liver and gut mechanisms that may modify blood lipid and post-prandial glucose levels Does not cause stimulation of beta cells or insulin secretion |
|
|
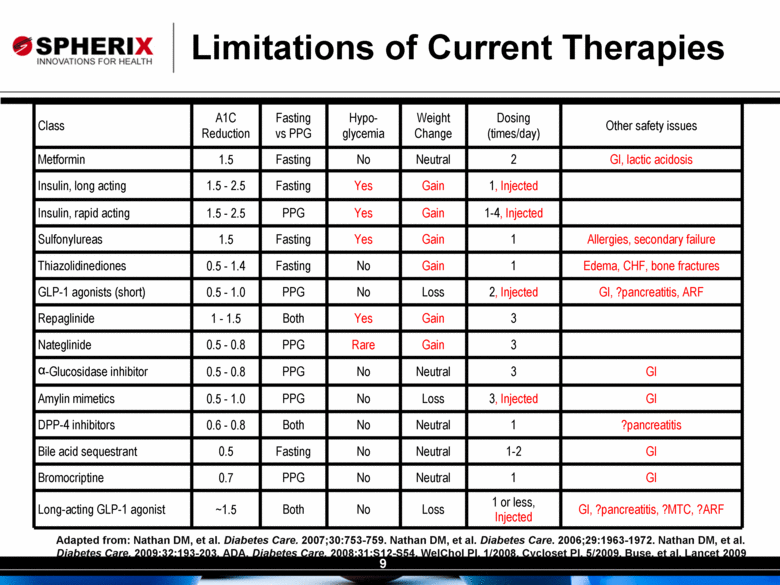
Class A1C Reduction Fasting vs PPG Hypo- glycemia Weight Change Dosing (times/day) Other safety issues Metformin 1.5 Fasting No Neutral 2 GI, lactic acidosis Insulin, long acting 1.5 - 2.5 Fasting Yes Gain 1, Injected Insulin, rapid acting 1.5 - 2.5 PPG Yes Gain 1-4, Injected Sulfonylureas 1.5 Fasting Yes Gain 1 Allergies, secondary failure Thiazolidinediones 0.5 - 1.4 Fasting No Gain 1 Edema, CHF, bone fractures GLP-1 agonists (short) 0.5 - 1.0 PPG No Loss 2, Injected GI, ?pancreatitis, ARF Repaglinide 1 - 1.5 Both Yes Gain 3 Nateglinide 0.5 - 0.8 PPG Rare Gain 3 Glucosidase inhibitor 0.5 - 0.8 PPG No Neutral 3 GI Amylin mimetics 0.5 - 1.0 PPG No Loss 3, Injected GI DPP-4 inhibitors 0.6 - 0.8 Both No Neutral 1 ?pancreatitis Bile acid sequestrant 0.5 Fasting No Neutral 1-2 GI Bromocriptine 0.7 PPG No Neutral 1 GI Long-acting GLP-1 agonist ~1.5 Both No Loss 1 or less, Injected GI, ?pancreatitis, ?MTC, ?ARF Adapted from: Nathan DM, et al. Diabetes Care. 2007;30:753-759. Nathan DM, et al. Diabetes Care. 2006;29:1963-1972. Nathan DM, et al. Diabetes Care. 2009;32:193-203. ADA. Diabetes Care. 2008;31:S12-S54. WelChol PI. 1/2008. Cycloset PI. 5/2009. Buse, et al. Lancet 2009 Limitations of Current Therapies |
|
|
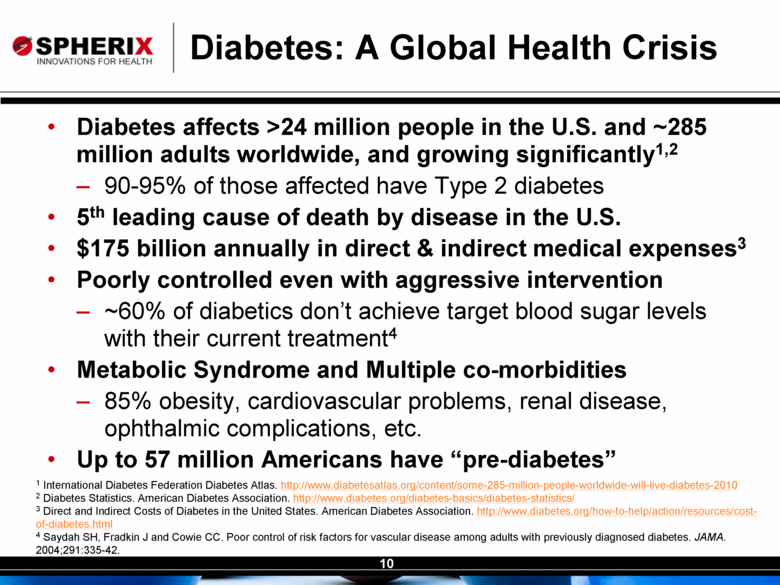
Diabetes: A Global Health Crisis Diabetes affects >24 million people in the U.S. and ~285 million adults worldwide, and growing significantly1,2 90-95% of those affected have Type 2 diabetes 5th leading cause of death by disease in the U.S. $175 billion annually in direct & indirect medical expenses3 Poorly controlled even with aggressive intervention ~60% of diabetics don’t achieve target blood sugar levels with their current treatment4 Metabolic Syndrome and Multiple co-morbidities 85% obesity, cardiovascular problems, renal disease, ophthalmic complications, etc. Up to 57 million Americans have “pre-diabetes” 1 International Diabetes Federation Diabetes Atlas. http://www.diabetesatlas.org/content/some-285-million-people-worldwide-will-live-diabetes-2010 2 Diabetes Statistics. American Diabetes Association. http://www.diabetes.org/diabetes-basics/diabetes-statistics/ 3 Direct and Indirect Costs of Diabetes in the United States. American Diabetes Association. http://www.diabetes.org/how-to-help/action/resources/cost-of-diabetes.html 4 Saydah SH, Fradkin J and Cowie CC. Poor control of risk factors for vascular disease among adults with previously diagnosed diabetes. JAMA. 2004;291:335-42. |
|
|
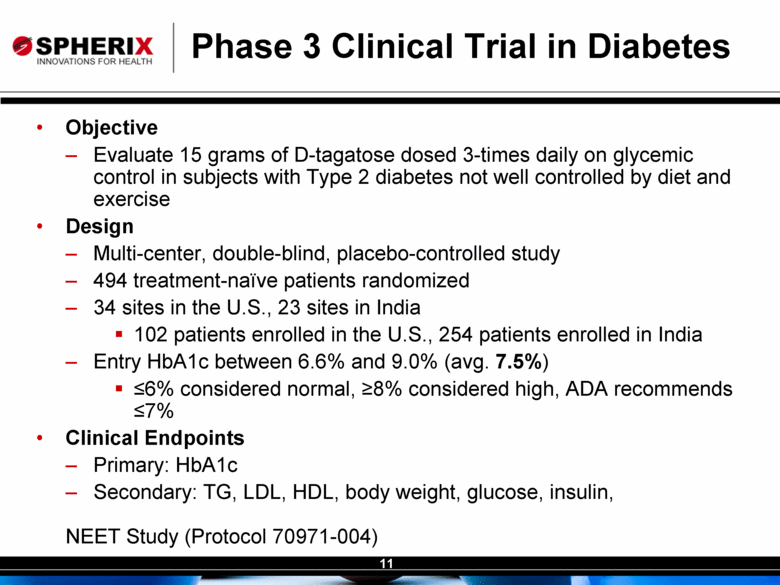
Phase 3 Clinical Trial in Diabetes Objective Evaluate 15 grams of D-tagatose dosed 3-times daily on glycemic control in subjects with Type 2 diabetes not well controlled by diet and exercise Design Multi-center, double-blind, placebo-controlled study 494 treatment-naïve patients randomized 34 sites in the U.S., 23 sites in India 102 patients enrolled in the U.S., 254 patients enrolled in India Entry HbA1c between 6.6% and 9.0% (avg. 7.5%) <6% considered normal, >8% considered high, ADA recommends <7% Clinical Endpoints Primary: HbA1c Secondary: TG, LDL, HDL, body weight, glucose, insulin, NEET Study (Protocol 70971-004) |
|
|
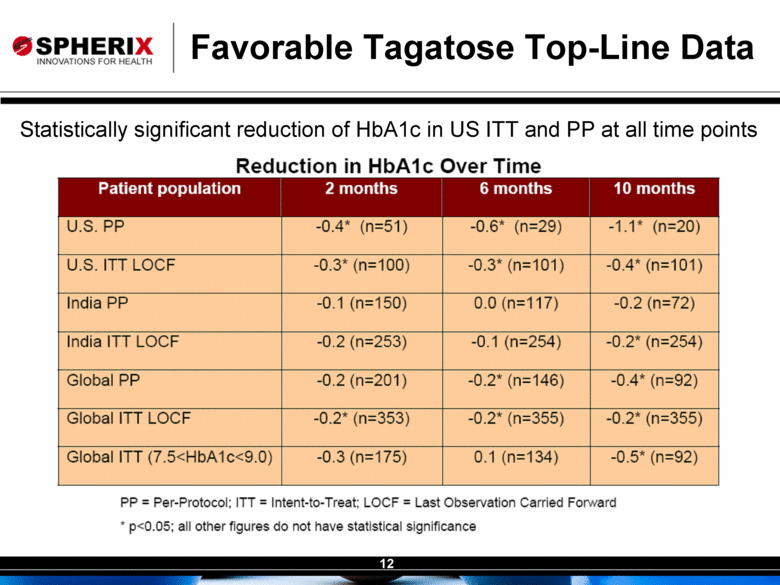
Favorable Tagatose Top-Line Data Statistically significant reduction of HbA1c in US ITT and PP at all time points Reduction in HbA1c Over Time Patient population 2 months 6 months 10 months U.S. PP -0.4* (n=51) -0.6* (n=29) -1.1* (n=20) U.S. ITT LOCF -0.3* (n=100) -0.3* (n=101) 0.4* (n=101) India PP -0.1 (n=150) 0.0 (n=117) -0.2 (n=72) India ITT LOCF -0.2 (n=253) -0.1 (n=254) -0.2* (n=254) Global PP -0.2 (n=201) -0.2* (n=146) -0.4* (n=92) Global ITT LOCF -0.2* (n=353) -0.2* (n=355) -0.2* (n=355) Global ITT (7.5<HbA1c<9.0) -0.3 (n=175) 0.1 (n=134) -0.5* (n=92) PP = Per-Protocol; ITT = Intent-to-Treat; LOCF = Last Observation Carried Forward * p<0.05; all other figures do not have statistical significance |
|
|
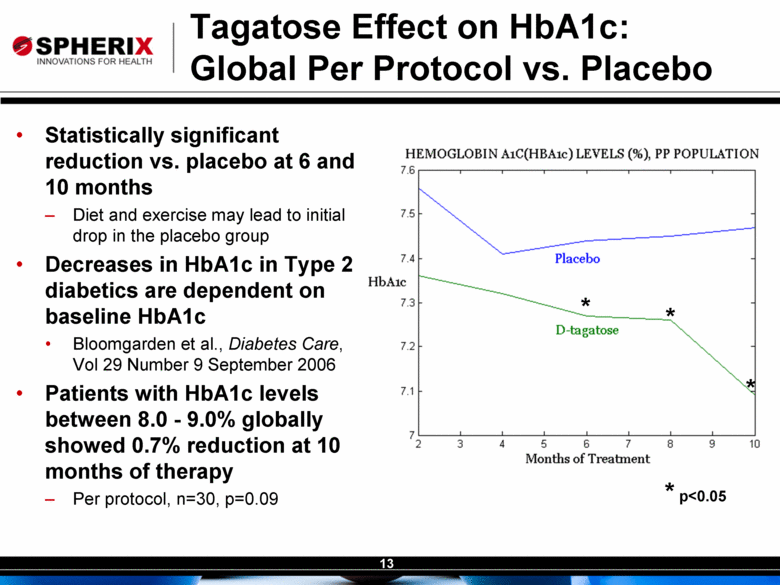
Tagatose Effect on HbA1c: Global Per Protocol vs. Placebo Statistically significant reduction vs. placebo at 6 and 10 months Diet and exercise may lead to initial drop in the placebo group Decreases in HbA1c in Type 2 diabetics are dependent on baseline HbA1c Bloomgarden et al., Diabetes Care, Vol 29 Number 9 September 2006 Patients with HbA1c levels between 8.0 - 9.0% globally showed 0.7% reduction at 10 months of therapy Per protocol, n=30, p=0.09 * * * p<0.05 * |
|
|
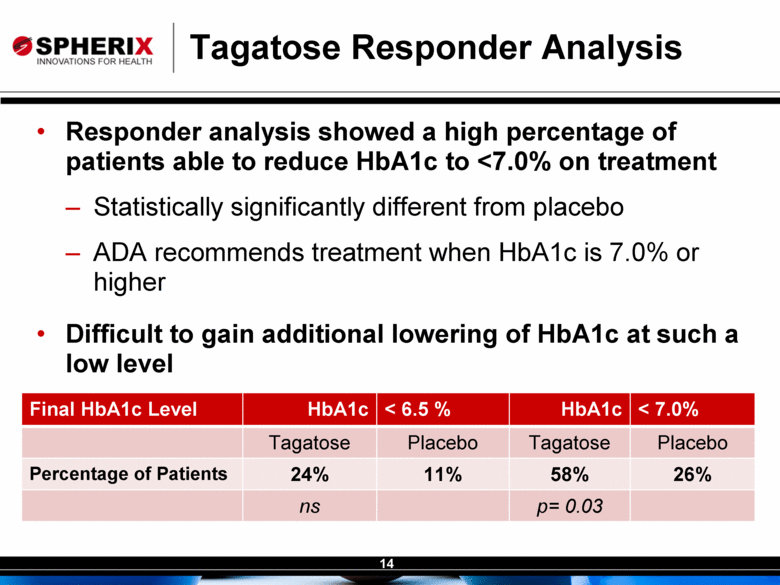
Tagatose Responder Analysis Responder analysis showed a high percentage of patients able to reduce HbA1c to <7.0% on treatment Statistically significantly different from placebo ADA recommends treatment when HbA1c is 7.0% or higher Difficult to gain additional lowering of HbA1c at such a low level Final HbA1c Level HbA1c < 6.5 % HbA1c < 7.0% Tagatose Placebo Tagatose Placebo Percentage of Patients 24% 11% 58% 26% ns p= 0.03 |
|
|
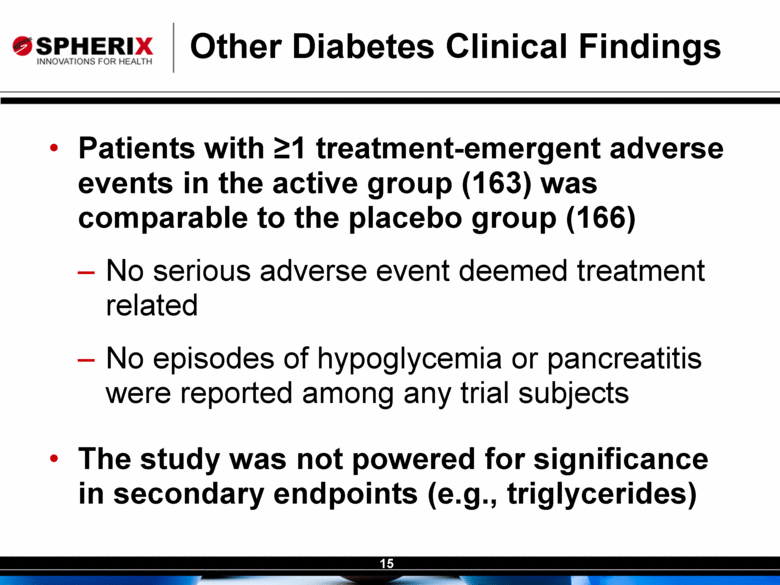
Other Diabetes Clinical Findings Patients with >1 treatment-emergent adverse events in the active group (163) was comparable to the placebo group (166) No serious adverse event deemed treatment related No episodes of hypoglycemia or pancreatitis were reported among any trial subjects The study was not powered for significance in secondary endpoints (e.g., triglycerides) |
|
|
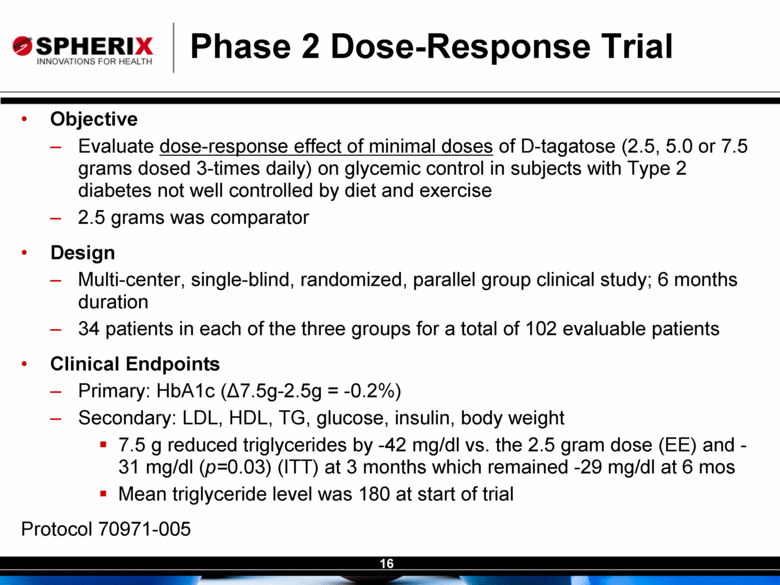
Phase 2 Dose-Response Trial Objective Evaluate dose-response effect of minimal doses of D-tagatose (2.5, 5.0 or 7.5 grams dosed 3-times daily) on glycemic control in subjects with Type 2 diabetes not well controlled by diet and exercise 2.5 grams was comparator Design Multi-center, single-blind, randomized, parallel group clinical study; 6 months duration 34 patients in each of the three groups for a total of 102 evaluable patients Clinical Endpoints Primary: HbA1c (<7.5g-2.5g = -0.2%) Secondary: LDL, HDL, TG, glucose, insulin, body weight 7.5 g reduced triglycerides by -42 mg/dl vs. the 2.5 gram dose (EE) and -31 mg/dl (p=0.03) (ITT) at 3 months which remained -29 mg/dl at 6 mos Mean triglyceride level was 180 at start of trial Protocol 70971-005 |
|
|
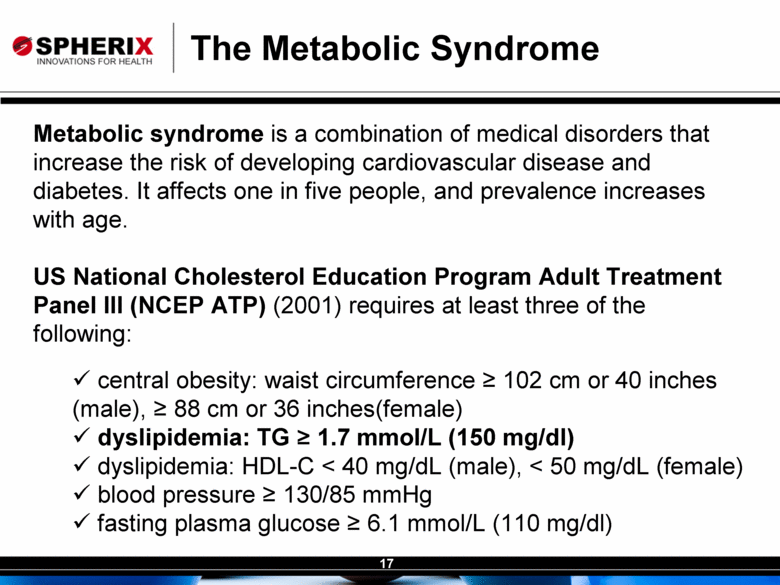
The Metabolic Syndrome Metabolic syndrome is a combination of medical disorders that increase the risk of developing cardiovascular disease and diabetes. It affects one in five people, and prevalence increases with age. US National Cholesterol Education Program Adult Treatment Panel III (NCEP ATP) (2001) requires at least three of the following: central obesity: waist circumference > 102 cm or 40 inches (male), > 88 cm or 36 inches(female) dyslipidemia: TG > 1.7 mmol/L (150 mg/dl) dyslipidemia: HDL-C < 40 mg/dL (male), < 50 mg/dL (female) blood pressure > 130/85 mmHg fasting plasma glucose > 6.1 mmol/L (110 mg/dl) |
|
|
Hypertriglyceridemia In the U.S. alone, more than 100 million people have elevated triglycerides, defined as more than 150 mg/dl Approximately 10 million are poorly served by current drug regimens The U.S. market for triglyceride-lowering drugs is in excess of $4 billion The path to commercialization is shorter than for an oral antidiabetic drug |
|
|
By the end of the six-month trial, the 7.5 g dose reduced serum triglycerides vs. the 2.5 g dose by -42 mg/dl from a mean of 180 mg/dl in the Evaluable Efficacy (EE) population (-23%) The reduction in serum triglycerides became statistically significant in the Intent-To-Treat (ITT) population at three months of treatment (-31 mg/dl, p=0.03) and the reduction essentially held steady at the six-month end-of-study visit (-29 mg/dl) Phase 2 Dose Response Triglyceride Results |
|
|
Unlike other drugs, D-tagatose lowered triglycerides without elevating LDL D-tagatose in the 7.5 g dose reduced LDL vs. the 2.5 g dose by -11 mg/dl by the third month of treatment The reduction essentially held steady at the six-month end-of-study visit (-10 mg/dl). HDL was unchanged, increasing only between 0.3 and 1.4 mg/dl over the entire course of the study vs. comparator Analysis of patient subgroups in the U.S. and India with elevated body mass and/or HbA1c is in progress Phase 2 Dose Response Triglyceride Results |
|
|
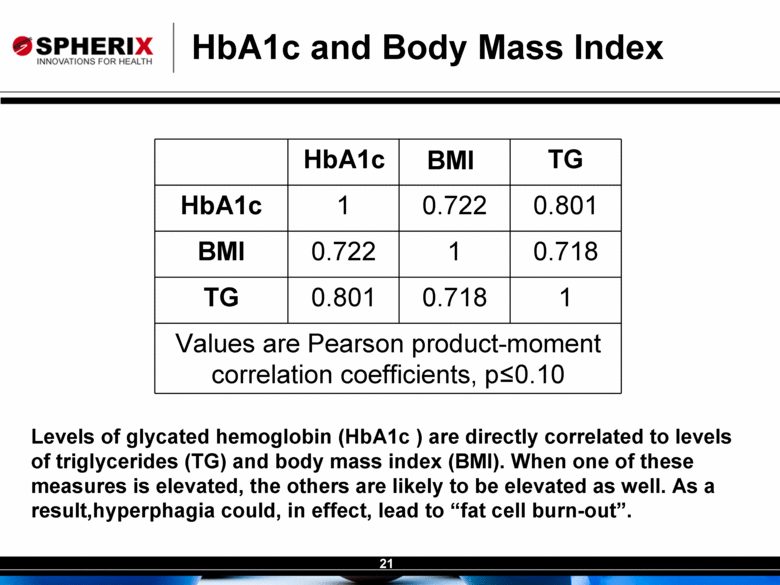
HbA1c and Body Mass Index HbA1c BMI TG HbA1c 1 0.722 0.801 BMI 0.722 1 0.718 TG 0.801 0.718 1 Values are Pearson product-moment correlation coefficients, p<0.10 Levels of glycated hemoglobin (HbA1c ) are directly correlated to levels of triglycerides (TG) and body mass index (BMI). When one of these measures is elevated, the others are likely to be elevated as well. As a result,hyperphagia could, in effect, lead to “fat cell burn-out”. |
|
|
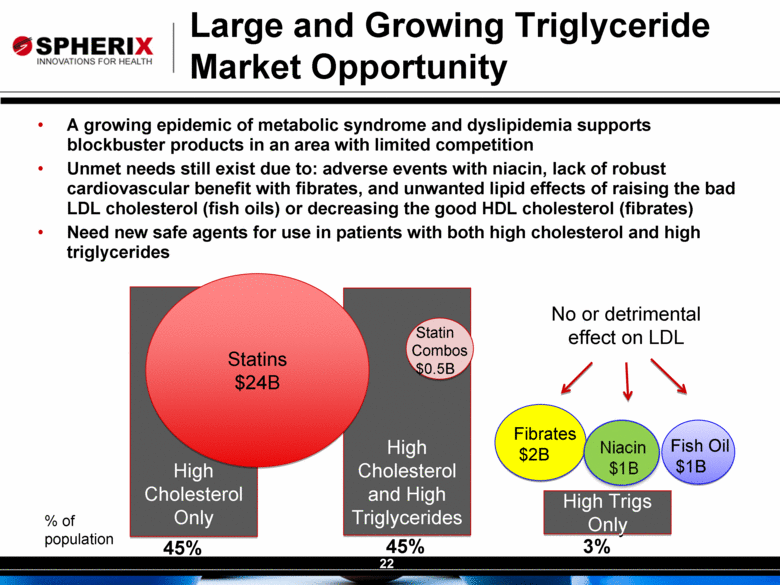
Large and Growing Triglyceride Market Opportunity A growing epidemic of metabolic syndrome and dyslipidemia supports blockbuster products in an area with limited competition Unmet needs still exist due to: adverse events with niacin, lack of robust cardiovascular benefit with fibrates, and unwanted lipid effects of raising the bad LDL cholesterol (fish oils) or decreasing the good HDL cholesterol (fibrates) Need new safe agents for use in patients with both high cholesterol and high triglycerides High Cholesterol Only High Cholesterol and High Triglycerides High Trigs Only Statins $24B Fibrates $2B Fish Oil $1B 45% 45% 3% Statin Combos $0.5B No or detrimental effect on LDL % of population |
|
|
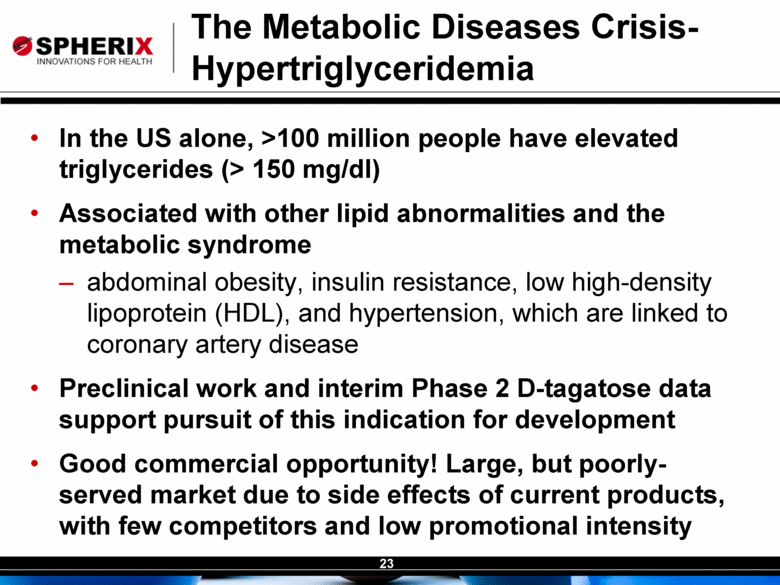
The Metabolic Diseases Crisis- Hypertriglyceridemia In the US alone, >100 million people have elevated triglycerides (> 150 mg/dl) Associated with other lipid abnormalities and the metabolic syndrome abdominal obesity, insulin resistance, low high-density lipoprotein (HDL), and hypertension, which are linked to coronary artery disease Preclinical work and interim Phase 2 D-tagatose data support pursuit of this indication for development Good commercial opportunity! Large, but poorly-served market due to side effects of current products, with few competitors and low promotional intensity |
|
|
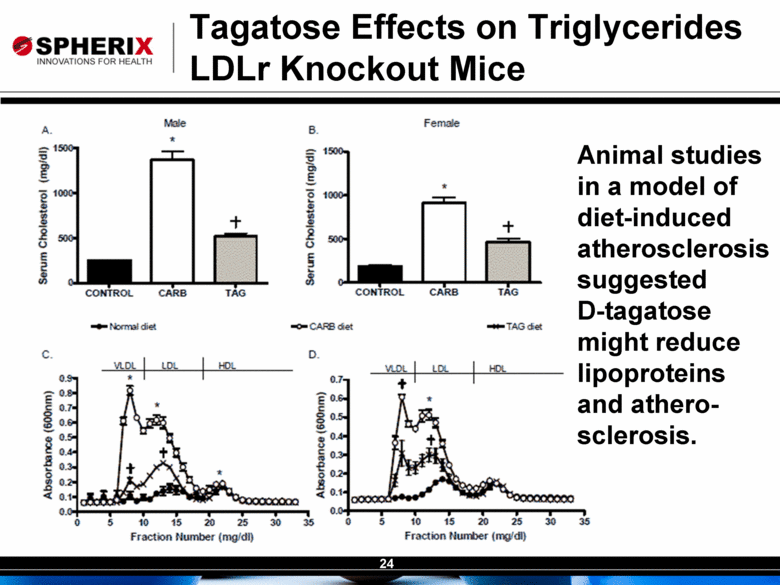
Tagatose Effects on Triglycerides LDLr Knockout Mice Animal studies in a model of diet-induced atherosclerosis suggested D-tagatose might reduce lipoproteins and athero-sclerosis. |
|
|
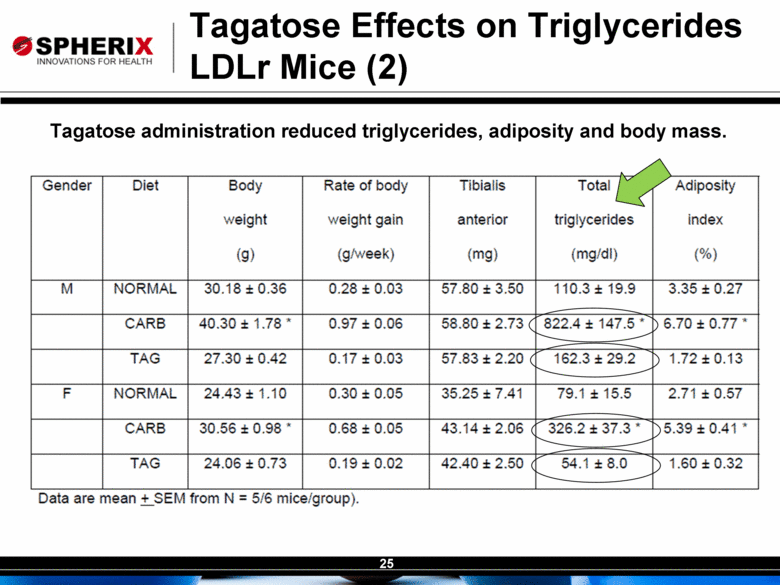
Tagatose Effects on Triglycerides LDLr Mice (2) Tagatose administration reduced triglycerides, adiposity and body mass. Gender Diet Body weight (g) Rate of Body weight gain (g/week) Tibialis anterior (mg) (mg/dl Total triglycerides (mg/dl) Adiposity index (%) NORMAL 30.18 ±0.36 0.28 ± 0.03 57.80 ± 3.50 110.3 ± 1S.3 3.35 ± 0.27 CARB 40.30 ± 1.78' 0.97 ± 0.06 58.80 ± 2.73 ( 822.4 ± 147.5 ' 6.70 ± 0.77 ' T-G 27.30 ± 0.42 0.17 ±0.03 57.83 ± 2.20 ( 162.3 ±29.2 > 1.72 ±0.13 F NORMAL 24.431 1.10 0.30 ±0 05 35.25 ±7.41 79.1 ±15.5 2.71 ±0.57 CARB 30.56 = 0.95 ' 0.66 = 0.05 43.14±2.06 325.2 = 37.3 " )5.39±0.41 TAG 24.06 = 0.73 o -S:0.o: 42.43 ± 2.50 ' 54.1 ±8.0 } -.86 = 0.32 Data are mean ± SEM from N = 5/6 mice/group] |
|
|
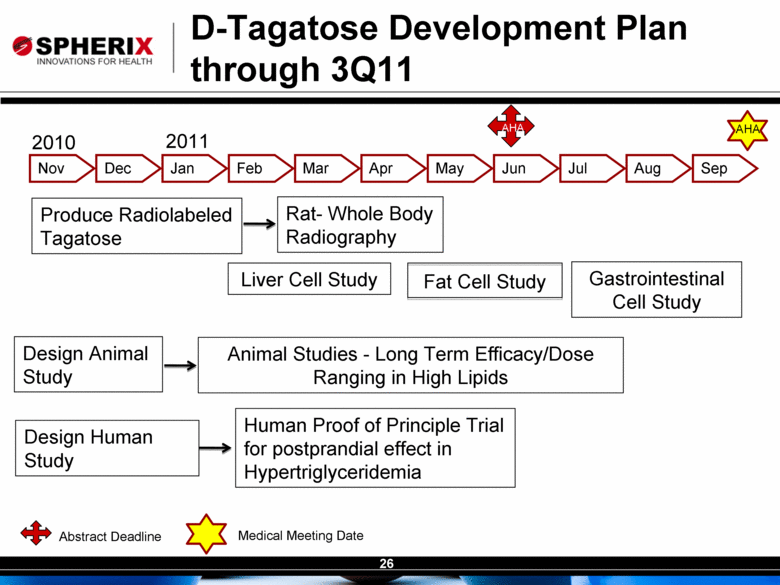
D-Tagatose Development Plan through 3Q11 Rat- Whole Body Radiography Liver Cell Study Human Proof of Principle Trial for postprandial effect in Hypertriglyceridemia Gastrointestinal Cell Study Produce Radiolabeled Tagatose AHA 2010 2011 Abstract Deadline Medical Meeting Date Design Human Study Animal Studies - Long Term Efficacy/Dose Ranging in High Lipids Aug Jul Jun May Apr Mar Feb Jan Dec Nov AHA Design Animal Study Fat Cell Study sep |
|
|
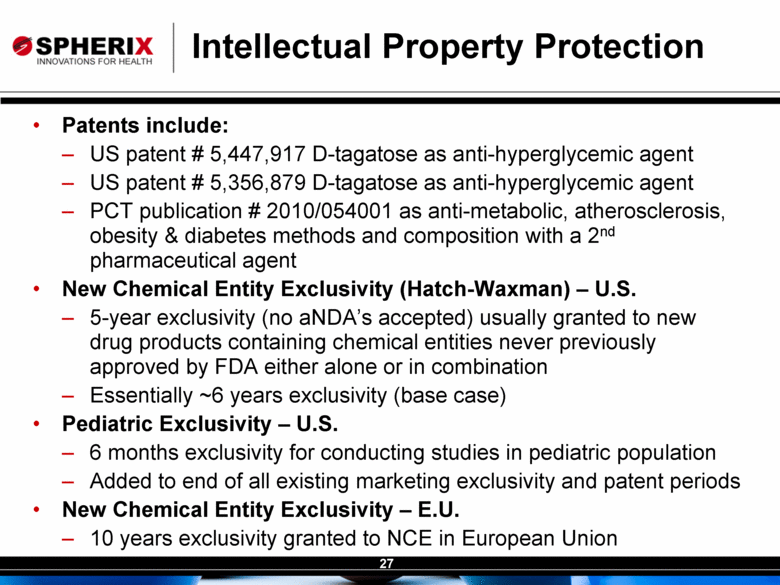
Intellectual Property Protection Patents include: US patent # 5,447,917 D-tagatose as anti-hyperglycemic agent US patent # 5,356,879 D-tagatose as anti-hyperglycemic agent PCT publication # 2010/054001 as anti-metabolic, atherosclerosis, obesity & diabetes methods and composition with a 2nd pharmaceutical agent New Chemical Entity Exclusivity (Hatch-Waxman) – U.S. 5-year exclusivity (no aNDA’s accepted) usually granted to new drug products containing chemical entities never previously approved by FDA either alone or in combination Essentially ~6 years exclusivity (base case) Pediatric Exclusivity – U.S. 6 months exclusivity for conducting studies in pediatric population Added to end of all existing marketing exclusivity and patent periods New Chemical Entity Exclusivity – E.U. 10 years exclusivity granted to NCE in European Union |
|
|
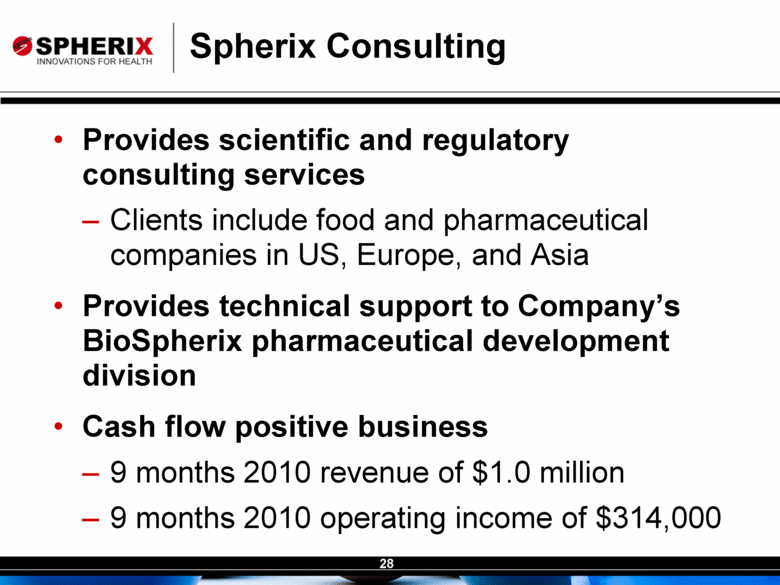
Spherix Consulting Provides scientific and regulatory consulting services Clients include food and pharmaceutical companies in US, Europe, and Asia Provides technical support to Company’s BioSpherix pharmaceutical development division Cash flow positive business 9 months 2010 revenue of $1.0 million 9 months 2010 operating income of $314,000 |
|
|
Experienced Leadership Claire L. Kruger, Ph.D., Chief Executive Officer Toxicologist with 20 years of consulting experience; primary area of expertise is in pharmaceuticals, consumer products and foods, where she provides scientific, regulatory, and strategic support to clients in both the US and international regulatory arenas Robert A. Lodder, Ph.D., President Founder of InfraReDx, Inc. and Prescient Medical, Inc., Professor of Pharmaceutical Sciences at the College of Pharmacy, University of Kentucky Medical Center. An inventor with over a dozen patents. Robert L. Clayton, Chief Financial Officer 16 years of experience in finance and accounting, including 5 years in public accounting; previously served as Director of Finance and Controller for Spherix Katherine M. Brailer, Corporate Secretary and Director of Administrative Services 25 years of experience in all aspects of administrative services, including 10 years as an Officer of Spherix |
|
|
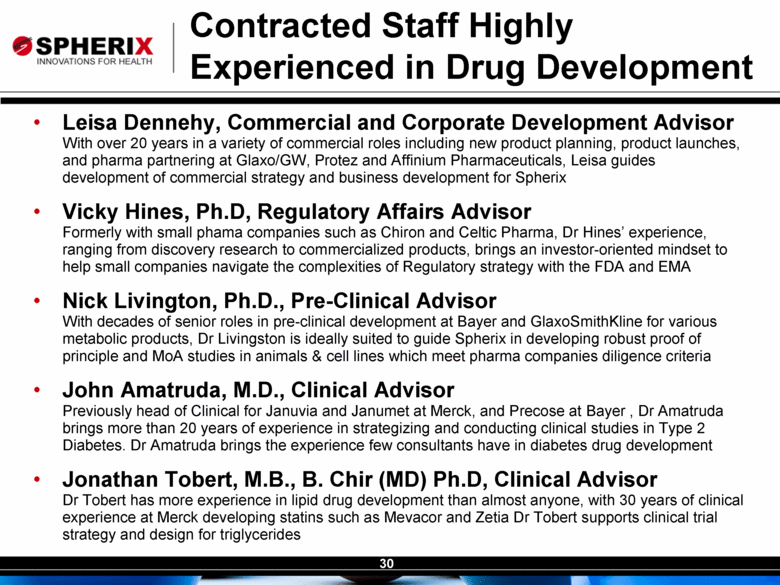
Contracted Staff Highly Experienced in Drug Development Leisa Dennehy, Commercial and Corporate Development Advisor With over 20 years in a variety of commercial roles including new product planning, product launches, and pharma partnering at Glaxo/GW, Protez and Affinium Pharmaceuticals, Leisa guides development of commercial strategy and business development for Spherix Vicky Hines, Ph.D, Regulatory Affairs Advisor Formerly with small phama companies such as Chiron and Celtic Pharma, Dr Hines’ experience, ranging from discovery research to commercialized products, brings an investor-oriented mindset to help small companies navigate the complexities of Regulatory strategy with the FDA and EMA Nick Livington, Ph.D., Pre-Clinical Advisor With decades of senior roles in pre-clinical development at Bayer and GlaxoSmithKline for various metabolic products, Dr Livingston is ideally suited to guide Spherix in developing robust proof of principle and MoA studies in animals & cell lines which meet pharma companies diligence criteria John Amatruda, M.D., Clinical Advisor Previously head of Clinical for Januvia and Janumet at Merck, and Precose at Bayer , Dr Amatruda brings more than 20 years of experience in strategizing and conducting clinical studies in Type 2 Diabetes. Dr Amatruda brings the experience few consultants have in diabetes drug development Jonathan Tobert, M.B., B. Chir (MD) Ph.D, Clinical Advisor Dr Tobert has more experience in lipid drug development than almost anyone, with 30 years of clinical experience at Merck developing statins such as Mevacor and Zetia Dr Tobert supports clinical trial strategy and design for triglycerides |
|
|
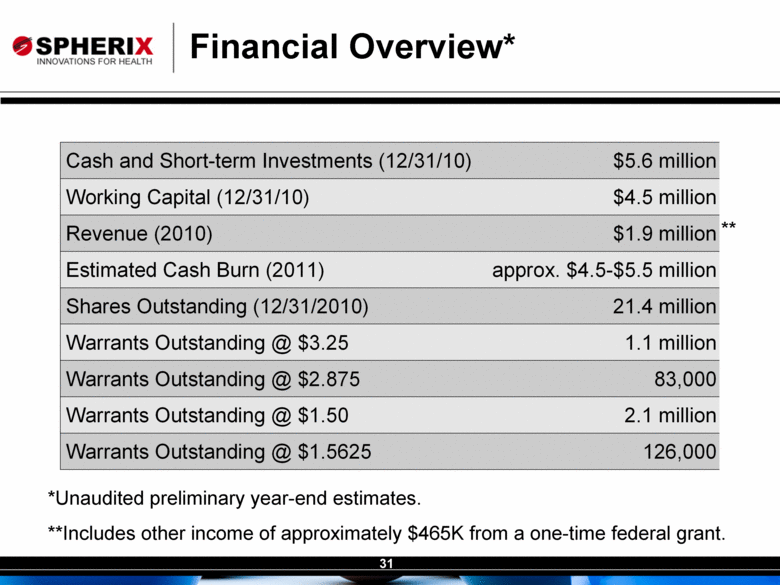
Financial Overview* *Unaudited preliminary year-end estimates. **Includes other income of approximately $465K from a one-time federal grant. ** Cash and Short-term Investments (12/31/10) $5.6 million Working Capital (12/31/10) $4.5 million Revenue (2010) $1.9 million Estimated Cash Burn (2011) approx. $4.5-$5.5 million Shares Outstanding (12/31/2010) 21.4 million Warrants Outstanding @ $3.25 1.1 million Warrants Outstanding @ $2.875 83,000 Warrants Outstanding @ $1.50 2.1 million Warrants Outstanding @ $1.5625 126,000 |
|
|
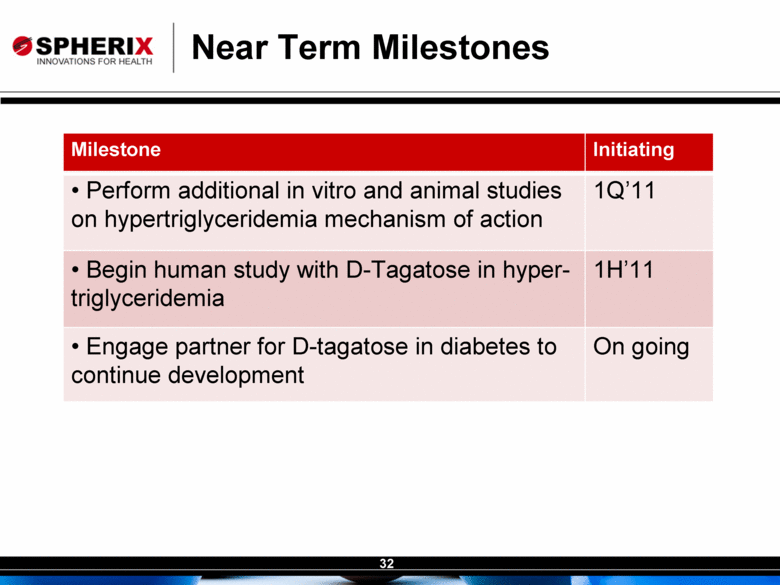
Near Term Milestones Milestone Initiating Perform additional in vitro and animal studies on hypertriglyceridemia mechanism of action 1Q’11 Begin human study with D-Tagatose in hyper-triglyceridemia 1H’11 Engage partner for D-tagatose in diabetes to continue development On going |
|
|
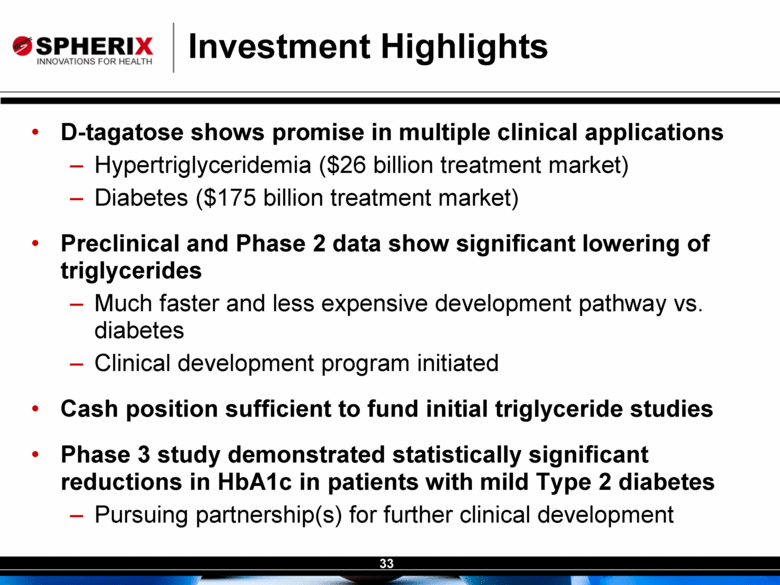
Investment Highlights D-tagatose shows promise in multiple clinical applications Hypertriglyceridemia ($26 billion treatment market) Diabetes ($175 billion treatment market) Preclinical and Phase 2 data show significant lowering of triglycerides Much faster and less expensive development pathway vs. diabetes Clinical development program initiated Cash position sufficient to fund initial triglyceride studies Phase 3 study demonstrated statistically significant reductions in HbA1c in patients with mild Type 2 diabetes Pursuing partnership(s) for further clinical development |

