Attached files
| file | filename |
|---|---|
| 8-K - 8-K - Bridge Capital Holdings | v210660_8k.htm |

FIG Partners’ 2nd Annual West Coast
Bank CEO Forum
Bank CEO Forum
Daniel P. Myers
President
Chief Executive
Officer
February 10,
2011
Thomas A. Sa
Executive Vice President
Chief Financial Officer and Chief
Strategy Officer

2
2
Forward Looking
Statements
Certain matters discussed herein
constitute forward-looking statements within the
meaning of the Private Securities Litigation Reform Act of 1995, and are subject to
the safe harbors created by that Act. Forward-looking statements describe future
plans, strategies, and expectations, and are based on currently available
information, expectations, assumptions, projections, and management's judgment
about the Bank, the banking industry and general economic conditions. These
forward looking statements are subject to certain risks and uncertainties that could
cause the actual results, performance or achievements to differ materially from
those expressed, suggested or implied by the forward looking statements. These
risks and uncertainties include, but are not limited to: (1) competitive pressures in
the banking industry; (2) changes in interest rate environment; (3) general
economic conditions, nationally, regionally, and in operating markets; (4) changes
in the regulatory environment; (5) changes in business conditions and inflation; (6)
changes in securities markets; (7) future credit loss experience; (8) the ability to
satisfy requirements related to the Sarbanes-Oxley Act and other regulation on
internal control; (9) civil disturbances or terrorist threats or acts, or apprehension
about the possible future occurrences of acts of this type; and (10) the involvement
of the United States in war or other hostilities. The reader should refer to the more
complete discussion of such risks in Bridge Capital Holdings reports on Forms 10-
K and 10-Q on file with the SEC.
3
3
3
3
Why Are We
Different?
Business banking focus
True business line diversification
commercial/industrial technology structured
finance
SBA cash
management international trade services CRE/construction
management international trade services CRE/construction
Early & proactive risk
recognition and management
Positioned to prosper as economic
recovery takes hold
Solid core business
franchise
A business banking franchise that is
the
Professional Business Bank of
Choice
for small and middle market
companies, and emerging technology businesses,
in the markets we serve
in the markets we serve

4
4
4
4
Bridge Bank
Franchise
Funding-driven approach to building
the business
Experienced board and management
Disciplined execution of our
business plan
No subprime, GSE, CDO, SIV exposure
Reduced exposure to construction and
land
Full range of corporate banking
products delivered through
experienced advisors
experienced advisors
Unique & effective use of
banking technology
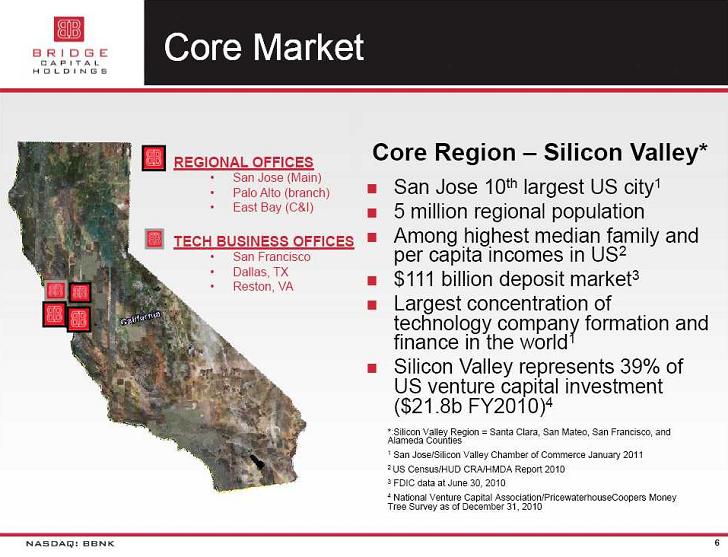
Attractive Silicon Valley market and
other expansion
opportunities
opportunities
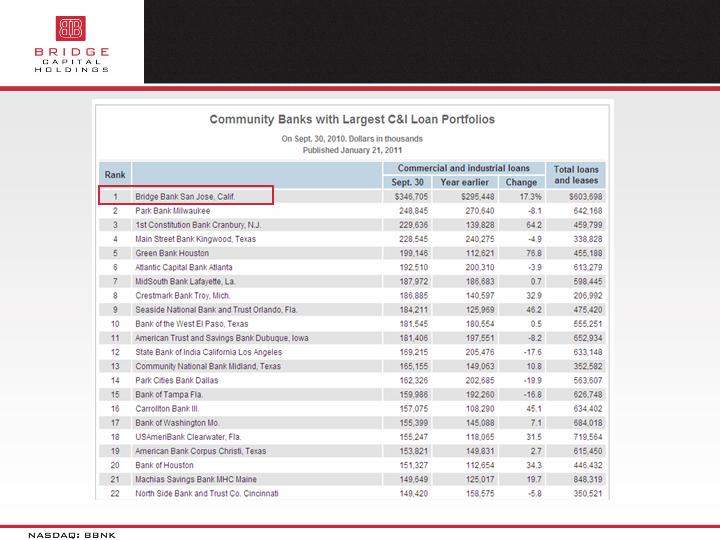
Ranked No. 1 for largest non-real
estate C&I portfolio1
1 American Banker Magazine, American
Bankers Association, Published January 21, 2011; Independent banks with less
than $1 billion of assets.


7
7
7
% Deposits
Santa Clara,
San Mateo,
Alameda
Counties
Market
Opportunity
Silicon Valley Region Deposits:
$110.7 Billion
7
Adjusted to reflect roll-ups of WAMU
to Chase, Wachovia to WFB, UCBH to East West and Merrill to BofA
Source: FDIC; as of June 30,
2010

8
8
8
8
The
Environment
SIGNS OF STABILITY:
Residential Real Estate
Technology Sector
Loan Demand
AREAS OF CONCERN:
Unemployment
Commercial Real Estate
Venture Capital Funding Levels
Government / Regulation
Deleveraging

10
10
10
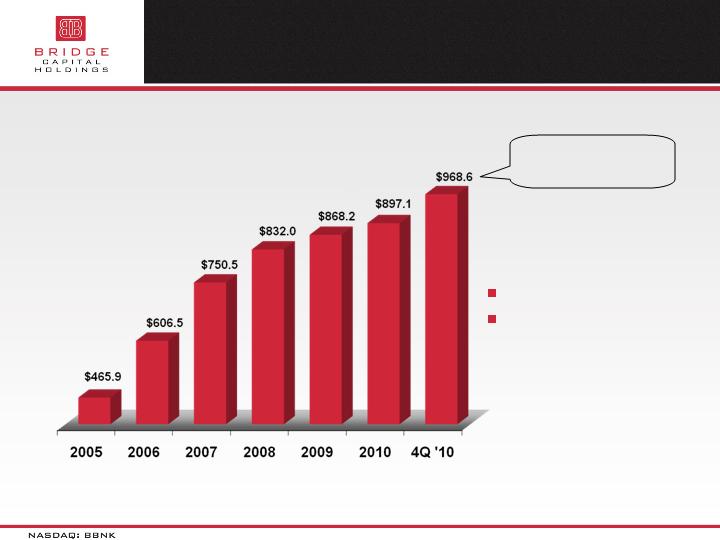
Average Total Assets
($M)
Expanding Market
Presence
Core deposit driven
Purely organic
growth
$1b total
assets
EOP Q4’10

11
11
11
Focus on Core
Funding Sources
11
$ millions
(EOP)
Deposit Mix
95% core deposits
Cost of funds
40 bps FY ’10
31 bps Q4 ‘10

12
12
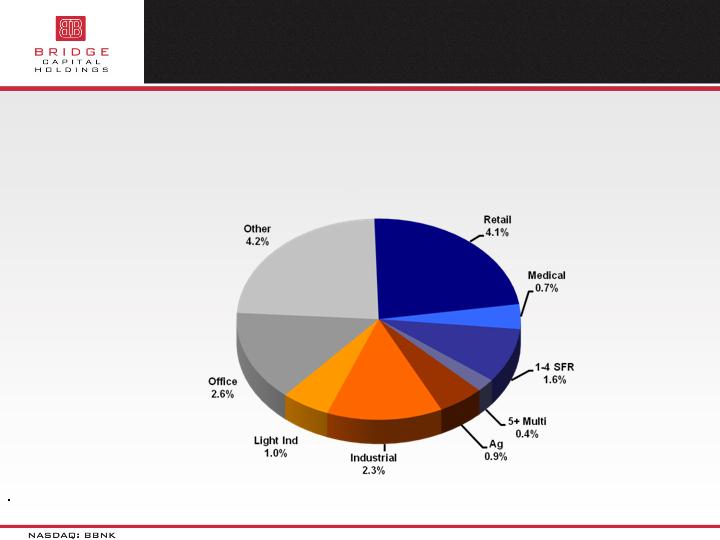
Diversification of
Lending Activity
12
Loan Mix as of December 31,
2010
60%
non-real estate
$652 Million
@ 12-31-10
Peer Average*
Non-Real Estate % of Total Loans –
22%*
*US Public Banks $500M-$1.5B TA; SNL
as of September 30, 2010

13
Loan Portfolio
Diversification
13
BBNK RE = 40% (60%
Non-RE)
Peer* RE = 78% (22%
Non-RE)
*US Public Banks $500M-$1.5B TA; SNL
as of September 30, 2010
December 31, 2010
14
14
14
Ranked #1 for Largest
C&I Portfolio
(Non-Real
Estate)
Source: American Banker
magazine, American Bankers Association, Independent banks with less than $1
billion of assets.

Land &
Construction Outstanding as a
% of Bank Regulatory Capital In ($MM’s)
% of Bank Regulatory Capital In ($MM’s)
56.6%
Jun-09
$94.0
$79.7
80.9%
Mar-09
$117.2
$97.8
100.4%
Dec-08
$49.0
$39.4
39.2%
Jun-10
$47.5
38.9%
Mar-10
$37.3
Dec-09
$33.4
$46.6
38.6%
$34.3
$20.6
181.5%
Sep-09
$66.4
Dec-10
$49.8
$40.7
39.6%
Sep-10
$128.1
$105.3
110.1%
Sep-08
$142.1
$101.0
Jun-08
$161.2
$102.3
$12.8
28.0%
$52.9
Construction
Land
% of Regulatory Capital
Regulatory
Threshold
Threshold
100%
15

Total CRE
Outstanding as a % of Bank
Regulatory Capital In ($MM’s)
Regulatory Capital In ($MM’s)
Dec-10
Sep-10
$120.8
$39.4
96.8%
Jun-10
$118.1
$37.3
96.6%
Mar-10
$115.3
$34.3
95.6%
Dec-09
$120.7
$20.6
101.2%
Sep-09
$131.7
$52.9
112.3%
Jun-09
$165.0
$79.7
142.1%
Mar-09
$185.1
$97.8
158.5%
Dec-08
$202.4
$105.3
173.9%
Sep-08
$211.8
$101.0
$41.1
Jun-08
$239.1
$102.3
269.3%
97.4%
$9.1
$40.7
$122.4
CRE Investment & Unsecured Loans
to Developers
Construction
Land
% of Regulatory Capital
Regulatory
Threshold
Threshold
300%
16

17
17
Land &
Construction Breakdown
(8%)
(8%)
Total Loan
Portfolio
Construction
(6.1%)
Land
(1.4%)
17
All percentages stated as percent of
total loan portfolio
Const Reduced 64%*
Land Reduced 86%*
* = Amount of Commitments Reduced
from June 30, 2008 to December 31, 2010
18
CRE Breakdown
(18%)
41% = Owner Occupied
59% = Investor
18
Current @ origination
LTV = 46%* 50%**
DSC = 1.39x* 1.49x**
CAP = 7.4%* 6.6**
= LTV, DSR, CAP = CRE portfolio
weighted averages for Q4 2010
** = LTV, DSR, CAP = CRE portfolio
weighted averages at loan origination

19
19
19
High Quality
Business
Peer*
Average
3.75%
= *US Public Banks $500M-$1.5B TA;
SNL as of December 31, 2010
Net Interest
Margin

20
Credit Quality
Trends
20
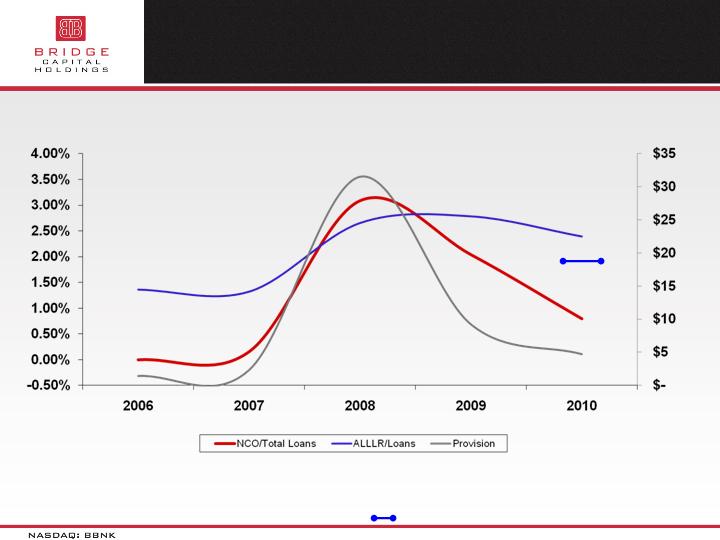
21
PEER*
(ALLL/Loans)
Reserves Remain High
While
Credit Losses
Moderate
= SNL Data: US Public Banks Total
Assets $0.5B to $1.5M as of December 31, 2010
1.98%

22
22
Operating
Leverage
$MM

23
*
BBNK
Revenue/Employee
146% of Peer*
Group Avg
Revenue/Employee
146% of Peer*
Group Avg
*= Average Rev/Empl of US Public
Banks $500M-$1.5B TA; SNL as of as of September 30, 2010
Revenue
Per
Employee
($000)
Per
Employee
($000)
Effective Revenue
Generation
302.2
207.6
$100
$150
$200
$250
$300
$350
2003
2004
2005
2006
2007
2008
2009
2010
BBNK
Peer

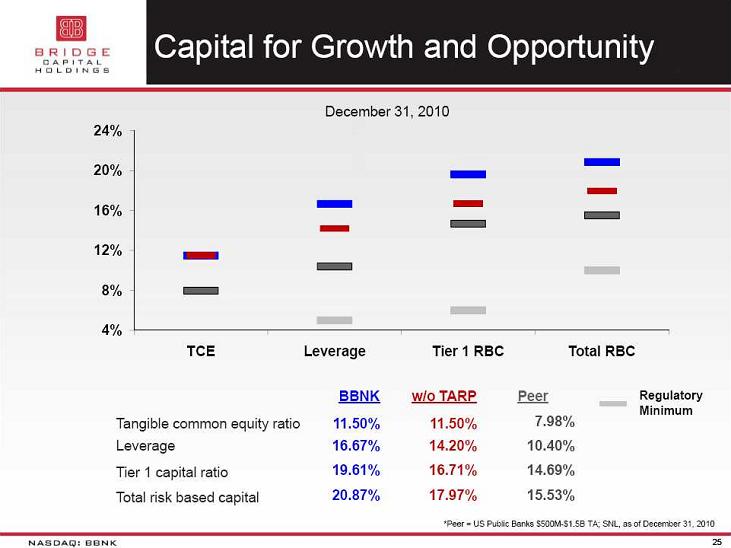
24
BBNK Capital
Structure
24

26
26
26
26
2010
Summary
Operating profit of $2.6 million
54% growth from 2009 to 2010
Surpassed $1.0 billion in total
assets
Substantially improved TCE ratio
$3M savings per year from
preferred-to-common conversion
Secured $30M private placement
Continued strong growth in core
deposits
Improving credit quality
NCOs reduced 56% from prior year
NPA’s including TDR’s reduced by 31%
NIM expanded to 4.99% from 4.58% in
2009
Robust new business activity
$474 million in new credit
commitments
360+ new client
relationships

27
27
27
Net Income &
EPS
$1.27
$1.57
($000, except per diluted share
amounts)
$0.85
$0.46
$0.24
Excludes Recognition of Deferred Tax
Asset of $1.9M in FY 2003
($1.15)
($0.42)
$0.06
Preferred
Dividends
Dividends
‘09 $4,203
‘10 $1,955

28
Potential Tailwinds
Ahead…
Utilization rates on LOC at low ebb
Have continued to add new
commitments
Utilization currently in the range
of 35-40%
As economy improves rate could move
up to 45%+
Natural asset-sensitivity
Positioned for rising rate
environment
Ready funding source for increased
loan demand
Lower levels of credit stress
Potential recoveries
Normalizing of credit costs
Continued organic growth
Loan balance increased 13% in 2010
28

29
29
29
29
Investment
Summary
Improving fundamentals provide
strong foundation for
increasing profitability
increasing profitability
Growing core deposit franchise
Increasing loan demand
Improved operating leverage
Expanding net interest margin
Improving credit quality with
manageable exposure to
CRE
CRE
Strong capital position provides
opportunity to pursue
attractive growth opportunities in our markets
attractive growth opportunities in our markets
Increasing presence in market with
attractive long-
term growth potential
term growth potential

30
30
Thank You / Q &
A