Attached files
| file | filename |
|---|---|
| 8-K - FORM 8-K - SIGMA ALDRICH CORP | d8k.htm |
| EX-99.1 - PRESS RELEASE - SIGMA ALDRICH CORP | dex991.htm |
 Sigma-Aldrich Corporation
Q4 2010 Earnings Review & 2011 Outlook
•
Enabling Science to Improve the Quality of Life
Exhibit 99.2 |
 2
2
Cautionary Statements
Our presentation today will include forward looking statements relating to the
Company’s future performance, goals, strategic actions and
initiatives
and
similar
intentions
and
beliefs,
including
expectations,
goals,
beliefs,
intentions
and
the
like
regarding
future
sales,
earnings,
free cash flow, share repurchases, acquisitions and other matters. These statements
are based on assumptions regarding Company operations, investments and
acquisitions and conditions in the markets the Company serves. We believe that these expectations are
reasonable
and
well-founded.
The
forward-looking
statements
in
this
presentation
are
subject
to
risks
and
uncertainties
including,
among
others, certain economic, political and technological factors. Actual results could
differ materially from those stated or implied during this review or
contained in other Company communications due to, but not limited to, such factors as (1) global economic conditions, (2)
changes in pricing and the competitive environment and the global demand for our
products, (3) fluctuations in foreign currency exchange rates, (4) changes
in research funding and the success of research and development activities, (5) failure of planned sales initiatives in our
Research and SAFC businesses, (6) dependence on uninterrupted manufacturing
operations, (7) failure to achieve planned cost reductions in global supply
chain initiatives and restructuring actions, (8) changes in the regulatory environment in which the Company operates, (9)
changes in worldwide tax rates or tax benefits from domestic and
international operations, including the matter described in Note 3–Income
Taxes–
to the Consolidated Financial Statements in the Company’s Form 10-Q
report for the quarter ended September 30, 2010, (10) exposure to
litigation, including product liability claims, (11) the ability to maintain
adequate quality standards, (12) reliance on third party package delivery
services, (13) an unanticipated increase in interest rates, (14) other changes in the business environment in which the
Company operates, and (15) the outcome of the outstanding matters described in Note
14-Contingent Liabilities and Commitments to the Consolidated Financial
Statements-in the Company’s Form 10-Q report for the quarter ended September 30, 2010. A further discussion of
risk factors can be found in Item 1A of part 2 of the Company’s Form 10-K
report for the year ended December 31, 2009 and the Company’s Form
8-K filed on October 25, 2010. The Company does not undertake any obligation to publicly update the matters covered in
this presentation.
With over 60% of sales denominated in currencies other than the U.S. dollar,
management uses currency-adjusted growth, and believes it is
useful
to
investors,
to
judge
the
Company’s
controllable,
local
currency
performance.
Organic
sales
growth
data
presented
in
this
review
is proforma
data and excludes currency impacts. The Company calculates the impact of changes
in foreign currency exchange rates by multiplying
current
period
activity
by
the
difference
between
current
period
exchange
rates
and
prior
period
exchange
rates.
The
result
is
the defined impact of changes in foreign currency exchange rates. While we are able
to report historical currency impacts after the fact, we are unable to
estimate changes that may occur later in 2011 to applicable exchange rates. Any significant changes in currency exchange
rates would likely have a significant impact on our reported growth rates due to
the volume of our sales denominated in foreign currencies. Management also
uses adjusted net income and EPS, adjusted operating income and operating income margins (excluding restructuring
and
impairment
costs)
and
free
cash
flow,
non-GAAP
measures,
to
judge
its
performance
and
ability
to
pursue
opportunities
that
enhance
shareholder value. Due to the uncertain timing of the future restructuring and
other extraordinary special changes, we are unable to include a 2011 diluted
GAAP EPS forecast or reconcile to our 2011 diluted adjusted EPS forecast or provide a reconciliation to corresponding
GAAP measures . Management believes this non-GAAP information is useful to
investors as well. Reconciliations of GAAP to non-GAAP
information
are
included
in
the
Company’s
February
9,
2011
earnings
release
posted
on
its
website,
www.sigma-aldrich.com,
and
in
the
Appendix –
Reconciliation of GAAP to non-GAAP Financial Measures beginning on Slide
17. |
 3
Rakesh
Sachdev
President and CEO |
 4
Strategic Priorities
•
Enhance Growth in our Core Research and SAFC Business
•
Focus on higher growth markets of:
–
Analytical Chemistry
–
Biology
–
Chemistry/Materials Science
•
Capitalize on our unique manufacturing capabilities and cGMP facilities in
SAFC •
Drive Operational Excellence
•
Continue to build upon the success of our global supply chain initiatives
•
Streamline manufacturing and distribution footprint
•
Expand global sourcing
•
Leverage Strong Cash Flow
•
Actively pursue “bolt-on”
acquisitions |
 5
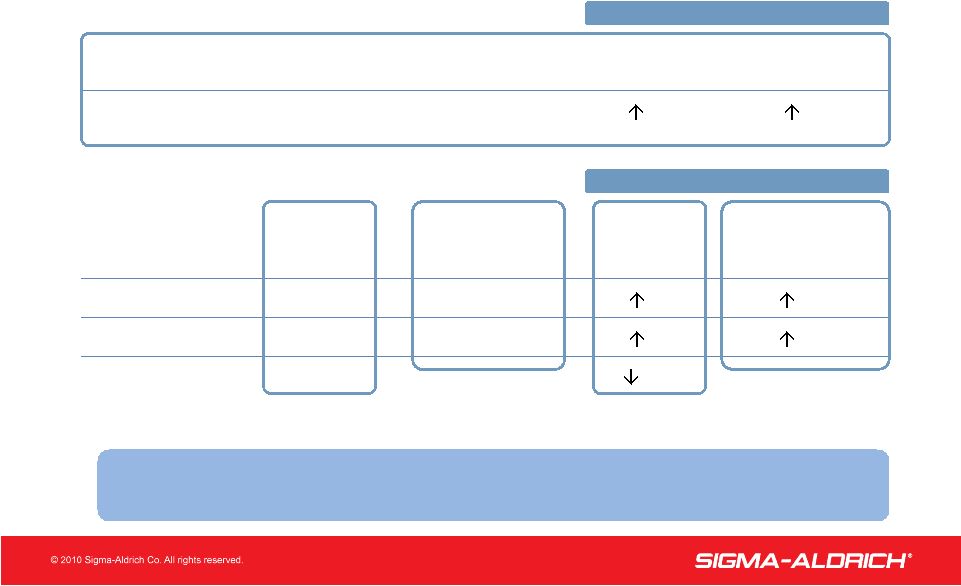
Fourth Quarter 2010
Financial Results
($ in millions, except per share amounts)
5
YEAR-OVER-YEAR
Q4 performance reflects sales growth for both
research and SAFC businesses
*Includes currency impact: Net Income –
$(2); Diluted EPS -
$(0.02)
As
Reported*
Q4 2010
Excluding
Restructuring &
Impairment Costs
As
Reported
Excluding
Restructuring &
Impairment Costs
Net Income
$94
$102
1%
3%
Diluted EPS
$0.76
$0.83
1%
4%
Free Cash Flow
$92
25%
Q4 2010
As
Reported
Excluding
Currency Impact
Sales
$582
2%
3%
YEAR-OVER-YEAR |
 6
Full Year
2010
Financial Results
($ in millions, except per share amounts)
6
*Includes currency benefit: Net Income -
$15; Diluted EPS -
$0.12
YEAR-OVER-YEAR
As
Reported*
YTD 2010
Excluding
Restructuring &
Impairment Costs
As
Reported
Excluding
Restructuring &
Impairment Costs
Net Income
$384
$408
11%
16%
Diluted EPS
$3.12
$3.31
11%
16%
Free Cash Flow
$424
7%
2010
Year-to-Date
As
Reported
Excluding
Currency Impact
Sales
$2,271
6%
5%
YEAR-OVER-YEAR
Achieved new performance record in 2010 |
                   7
7
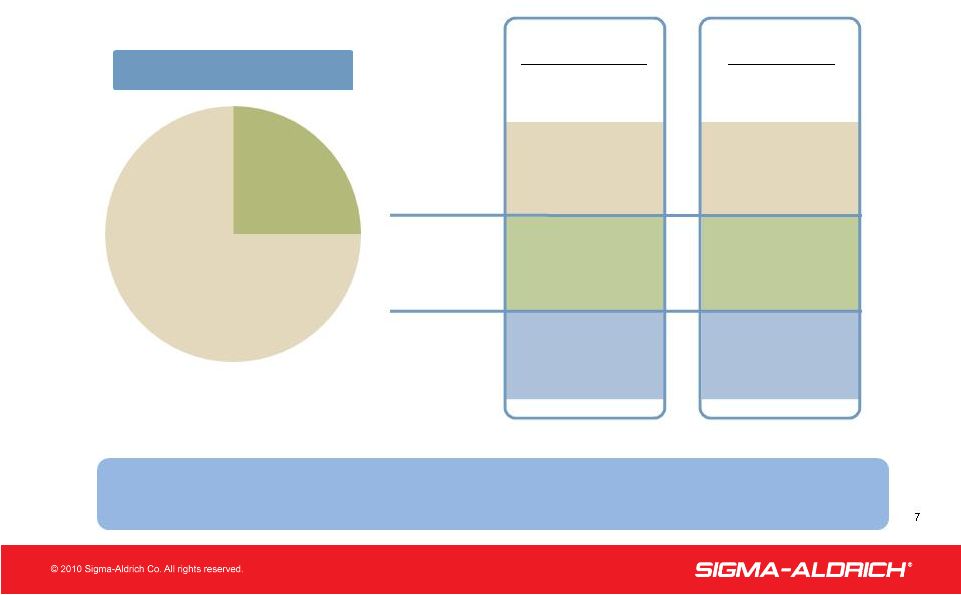
2010 Sales Growth
RESEARCH
72%
28%
SAFC
Sales Mix (YTD)
Total
Company
SAFC
Research
3%
4%
3%
4%
9%
5%
Full Year 2010/
Full Year 2009
Q4 2010/Q4 2009
Demand for research products continued to show growth.
SAFC sales set new quarterly high |
 8
2010
operating
margins
reflect
impact
of
restructuring
costs
and
impairment
charge
8
Margin Analysis
PERCENTAGE OF SALES
22.3%
1.4
0.2
(1.3)
22.3%
2010: Operating Margin
S,G&A, R&D Expenses
Price
Volume/Mix/Productivity/Currency Impact
YTD
23.3%
1.9
0.2
(0.2)
24.3%
2009: Operating Margin
Q4
Restructuring Costs
(0.3)
(0.6)
Impairment Charge
-
(0.3) |
 9
9
Free Cash Flow
(in millions)
2010
$ 384
93
17
29
523
(99)
$ 424
Net Income
Free Cash Flow
Net Cash Provided by Operating Activities
Less Capital Expenditures
Other
Changes in Performance Working Capital*
Depreciation & Amortization
2009
$347
92
57
20
516
(120)
$396
*Accounts
Receivable
+
Inventory
–
Accounts
Payable
YEAR ENDED DECEMBER 31
Free cash flow remains strong |
 10
10
Fourth Quarter 2010 Highlights
Continued focus on long-term growth opportunities
•
End Markets
–
Improved Growth in Chemical Related Industrial Customers and Academic Customer
Sectors partially offset by challenges in Pharmaceutical sector
•
Life Science
–
Partnered with Autism Speaks to create genetically engineered knockout rats to
identify approaches for Autism treatment
–
Expanded availability of ZFN (Zinc Finger Nuclease) Technology based technology
for biopharmceutical
use
–
Successfully
“Knocked-in”
foreign
genes
in
rats
using
ZFN
Technology
–
Received
silver
medal
from
“The
Scientist”
for
genetically
modified
cell
lines
–
Added 1,700 new antibodies to increase offering to 40,000
•
Hitech
–
Added Nanosys
created silicon nanowires
to research product offering
–
Expanded capability in better high purity metals, metal salts, alloys and ceramics
for electronic applications
Highlights |
 11
11
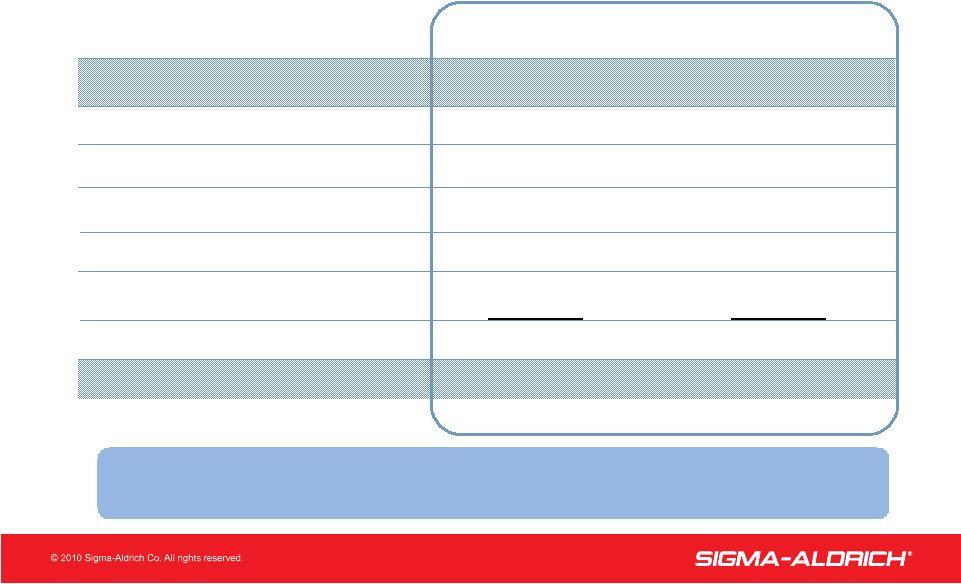
Q4 & YTD Sales Performance
Initiatives collectively on track with expectations
*Varies for individual product lines
See page 19 reconciling organic growth to reported growth
Q4
YTD
Innovation
Organic
Organic
•
Analytical, Biology, Materials Science Sales Growth
(2)-6%*
2-10%*
Geographic Growth
•
North America
4%
5%
•
Europe
(3)%
1%
•
Asia Pacific/Latin America
16%
15%
•
Focus Markets –
India, China, Brazil
23%
25%
SAFC Sales
•
Build on momentum in key product segments
4%
9%
eCommerce Sales
% of Research Sales
% of Research Sales
•
Research Sales via eCommerce channels
49%
48% |
 12
0.64
0.58
0.52
0.46
0.42
0
0.1
0.2
0.3
0.4
0.5
0.6
2006
2007
2008
2009
2010
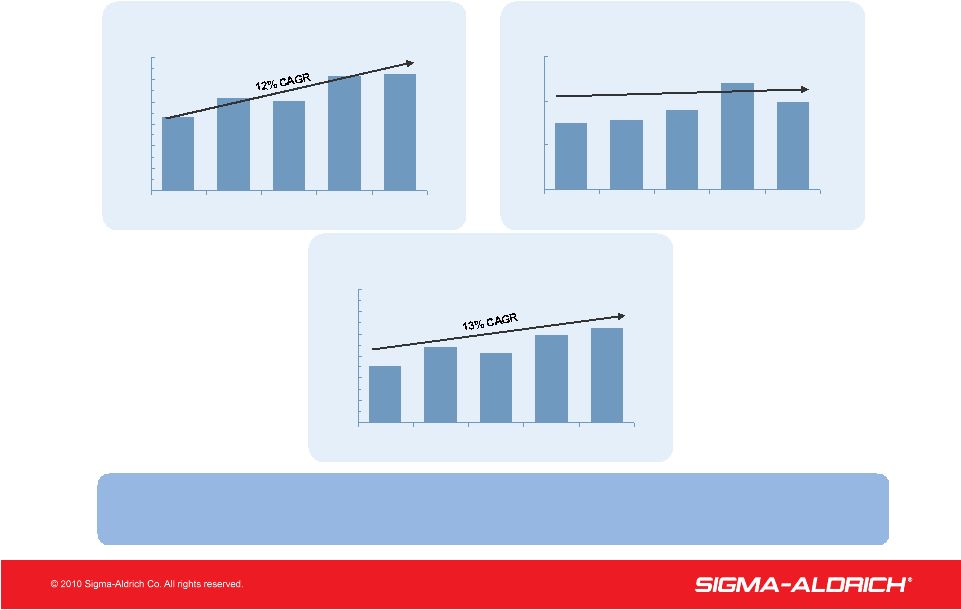
Profitable Growth
•
Demonstrated historical performance
•
Robust business model
DILUTED EARNINGS PER SHARE ($)
3.12
2.80
2.65
2.34
2.05
0.5
1.5
2.5
3.5
2006
2007
2008
2009
2010
ANNUAL DIVIDEND PER SHARE ($)
2,271
2,148
2,201
2,039
1,798
0
500
1,000
1,500
2,000
2,500
2006
2007
2008
2009
2010
REPORTED SALES $ IN MILLIONS
Continued a 36 year track record of annual increases in EPS and dividends
|
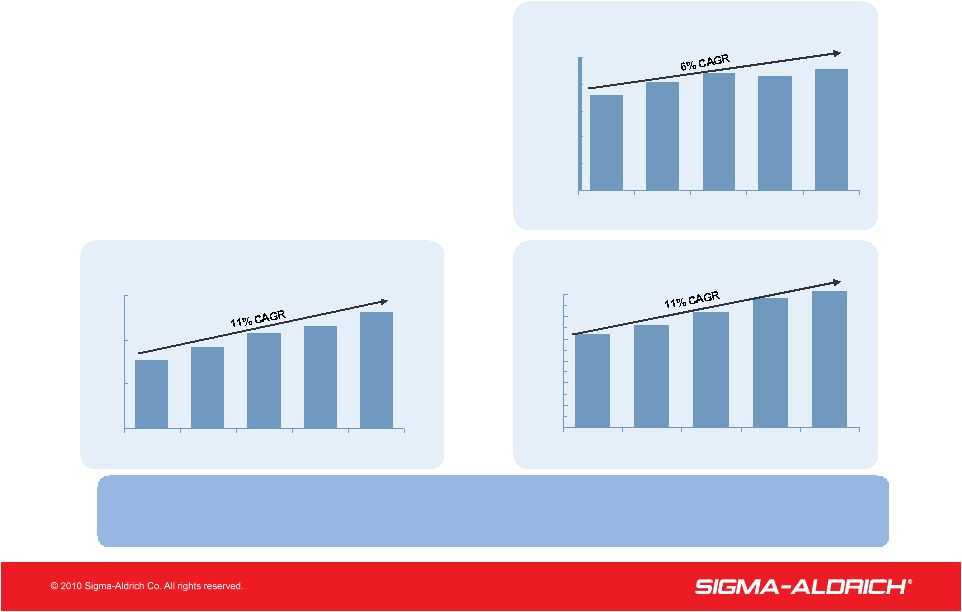
 13
OPERATING CASH FLOW ($M)
523
516
404
417
330
0
100
200
300
400
500
600
2006
2007
2008
2009
2010
CAPITAL EXPENDITURES ($M)
99
120
90
78
75
0
50
100
150
2006
2007
2008
2009
2010
7% CAGR
Strong Cash Flow
Able to fund short and long term growth
FREE CASH FLOW ($M)
424
396
314
339
255
0
100
200
300
400
500
600
2006
2007
2008
2009
2010
Free cash flow is defined as cash flow from
operating activities less capital expenditures |
 14
14
2011 Guidance
Organic Revenue Growth
Diluted Adjusted EPS*
Free Cash Flow
Mid-single digits
$3.45 to $3.60
>$375M
*Excludes any restructuring and other extraordinary special charges
|
 15
2011
Outlook
–
Highlights
•
Sales
•
Research Products
•
Expanded Analytical Chemistry Portfolio
(Cerilliant and Research Technology Corporation)
•
More Biomolecules
(Antibodies, Proteins and Peptides)
•
Broader Zinc Finger offering
•
Expanded offering of genetically
modified cell lines
•
New capacity
–
India –
Packaging and distribution
–
China –
Quality Control and packaging
•
SAFC
•
New marketing campaign
•
Continued
strength
in
Hitech
sales
•
New Hitech manufacturing capacity in Taiwan
•
Improved sales to pharmaceutical customers
•
Performance
•
Stable operating margins
•
Strong free cash flow
•
Increased dividend |
 16
16
QUESTIONS?
Sigma-Aldrich Corporation
Q4 2010 Earnings Review |
 17
Appendix
Reconciliation of GAAP to Non-GAAP
Financial Measures |
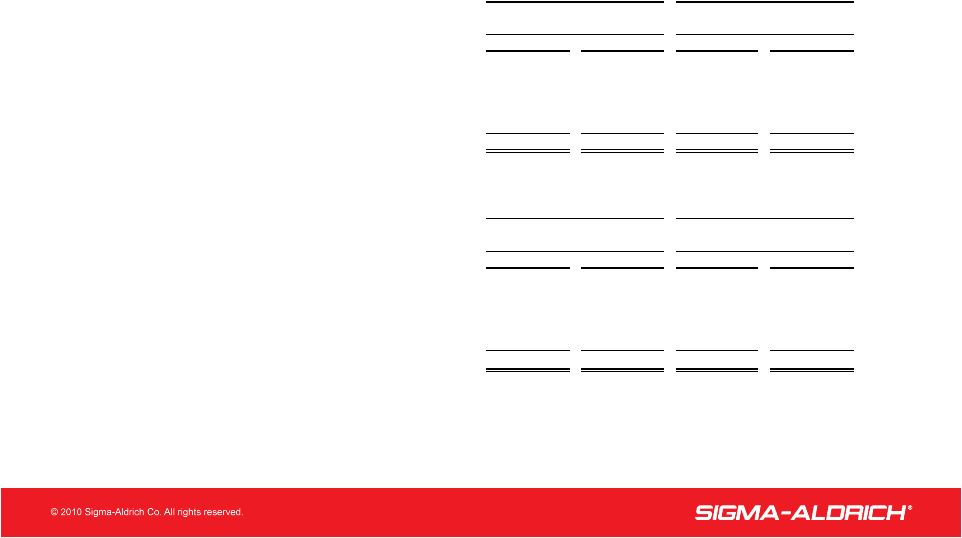 18
Reconciliation of Reported Net Income to
Adjusted Net Income
2010
2009
2010
2009
Reported net income
94
$
93
$
0.76
$
0.75
$
Restructuring costs
8
6
0.07
0.05
Impairment charge
-
-
-
-
Adjusted net income
102
$
99
$
0.83
$
0.80
$
2010
2009
2010
2009
Reported net income
384
$
347
$
3.12
$
2.80
$
Restructuring costs
17
6
0.14
0.05
Impairment charge
7
-
0.05
-
Adjusted net income
408
$
353
$
3.31
$
2.85
$
Net Income
Diluted Earnings
December 31,
December 31,
(in millions)
Per Share
Three Months Ended
Three Months Ended
Net Income
Diluted Earnings
(in millions)
Per Share
Twelve Months Ended
Twelve Months Ended
December 31,
December 31, |
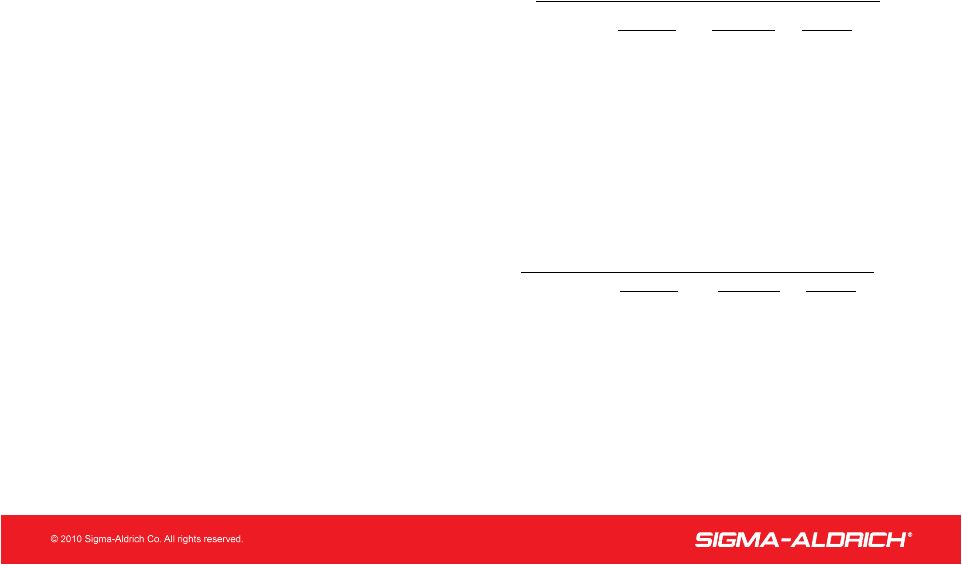 19
Reconciliation of Reported Sales Growth to
Adjusted (Organic) Sales Goal
Three Months Ended December 31, 2010
Reported
FX Impact
Organic
•
Analytical, Biology, Materials Science Sales Growth
(2)-6%*
(1)-0%*
(1)-6%*
Geographic Growth
•
North America
4%
–
4%
•
Europe
(9%)
(6%)
(3%)
•
Asia Pacific/Latin America
21%
5%
16%
•
Focus Markets –
India, China, Brazil
27%
4%
23%
Twelve Months Ended December 31, 2010
Reported
FX Impact
Organic
•
Analytical, Biology, Materials Science Sales Growth
2-12%*
0–2%*
2-10%*
Geographic Growth
•
North America
6%
1%
5%
•
Europe
(2)%
(3%)
1%
•
Asia Pacific/Latin America
23%
8%
15%
•
Focus Markets –
India, China, Brazil
31%
6%
25%
*Varies for individual product areas |
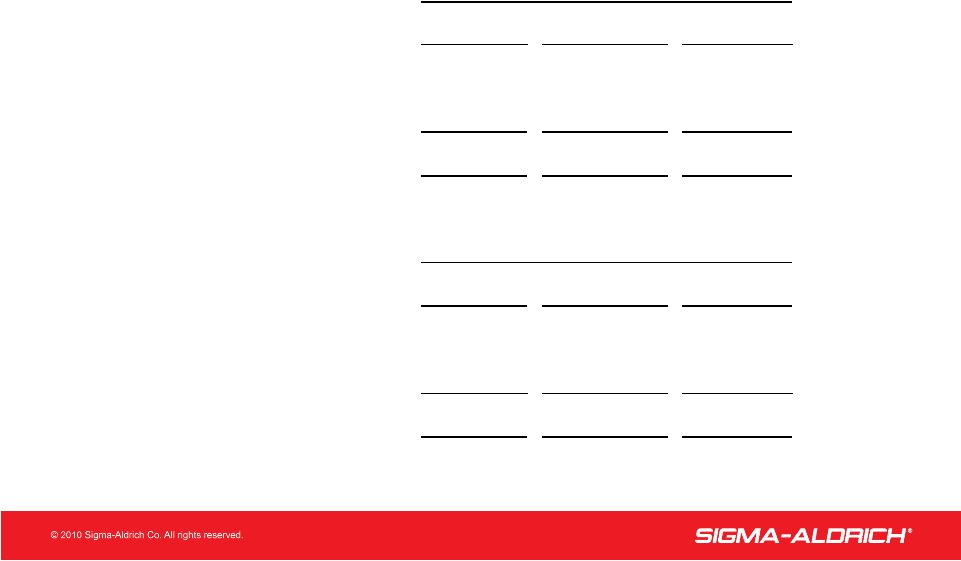 20
Reconciliation of Reported Sales Growth to Adjusted (Organic)
Sales Growth
Currency
Adjusted
Reported
Impact
(Organic)
Research Essentials
2%
(2%)
4%
Research Specialties
3%
(2%)
5%
Research Biotech
(2%)
-
(2%)
Research Chemicals
2%
(1%)
3%
SAFC
2%
(2%)
4%
Total Customer Sales
2%
(1%)
3%
Currency
Adjusted
Reported
Impact
(Organic)
Research Essentials
2%
-
2%
Research Specialties
6%
-
6%
Research Biotech
3%
1%
2%
Research Chemicals
4%
-
4%
SAFC
9%
-
9%
Total Customer Sales
6%
1%
5%
Three Months
Ended December 31, 2010
Twelve Months
Ended December 31, 2010 |
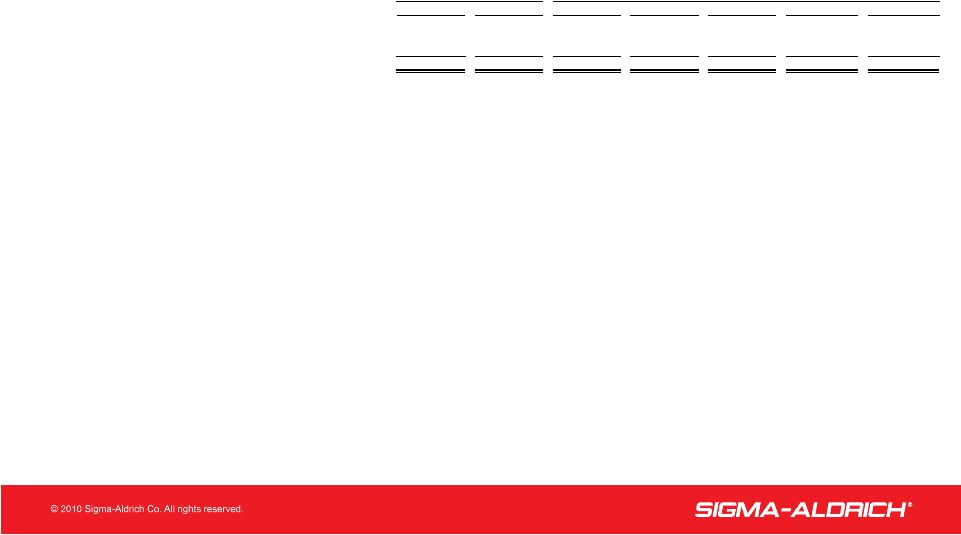 21
Reconciliation of Operating Cash Flow to Free Cash Flow
2010
2009
2010
2009
2008
2007
2006
Net cash provided by operating activities
126
$
154
$
523
$
516
$
404
$
417
$
330
$
Less: Capital expenditures
(34)
(32)
(99)
(120)
(90)
(78)
(75)
Free cash flow
92
$
122
$
424
$
396
$
314
$
339
$
255
$
December 31,
Twelve Months Ended
Three Months Ended
December 31,
In millions |