Attached files
| file | filename |
|---|---|
| 8-K - FORM 8-K - Patriot Coal CORP | d8k.htm |
 FINANCIAL
COMMUNITY PRESENTATION
February 9 & 10, 2011
Exhibit 99.1 |
 2
Some of the following information contains forward-looking statements within the meaning
of Section 27A of the Securities Act of 1933 and Section 21E of the Securities Exchange
Act of 1934, as amended, and is intended to come within the safe-harbor protection
provided by those sections. Forward-Looking Statements
Certain statements in this presentation are forward-looking as defined in the Private
Securities Litigation
Reform
Act
of
1995.
These
statements
involve
certain
risks
and
uncertainties
that
may
be
beyond our control and may cause our actual future results to differ materially from
expectations. We do not undertake to update our forward-looking
statements. Factors that could affect our results include, but are not limited
to: price volatility and demand, particularly in higher margin products; geologic,
equipment and operational risks associated with mining; changes in general economic
conditions, including coal and power market conditions; coal mining laws and regulations; the
availability and costs of competing energy resources; legislative and regulatory
developments; risks associated with environmental laws and compliance, including
selenium-related matters; developments in greenhouse gas emission regulation and
treatment; labor availability and relations; the outcome of pending or future
litigation; changes in the costs to provide healthcare to eligible active employees and
certain retirees under postretirement benefit obligations; changes in contribution
requirements to multi-employer retiree healthcare and pension funds; reductions of
purchases or deferral of shipments by major customers; availability and costs of
credit; customer performance and credit risks; inflationary trends; worldwide economic
and political conditions; downturns in consumer and company spending; supplier
and
contract
miner
performance
and
the
availability
and
cost
of
key
equipment
and
commodities; availability and costs of transportation; the Company’s ability to replace
coal reserves; the
outcome
of
commercial
negotiations
involving
sales
contracts
or
other
transactions;
our
ability
to
respond
to
changing
customer
preferences;
failure
to
comply
with
debt
covenants;
the
effects
of
mergers, acquisitions and divestitures; and weather patterns affecting energy demand.
The Company undertakes no obligation (and expressly disclaims any such obligation) to
publicly update or revise any forward-looking statement, whether as a result of new
information, future events or otherwise. For additional information concerning
factors that could cause actual results to materially differ from those projected
herein, please refer to the Company’s Form 10-K and Form 10-Q reports.
Patriot Coal Statement on Forward-Looking Information |
 3
The Dynamic Global Coal Markets |
 4
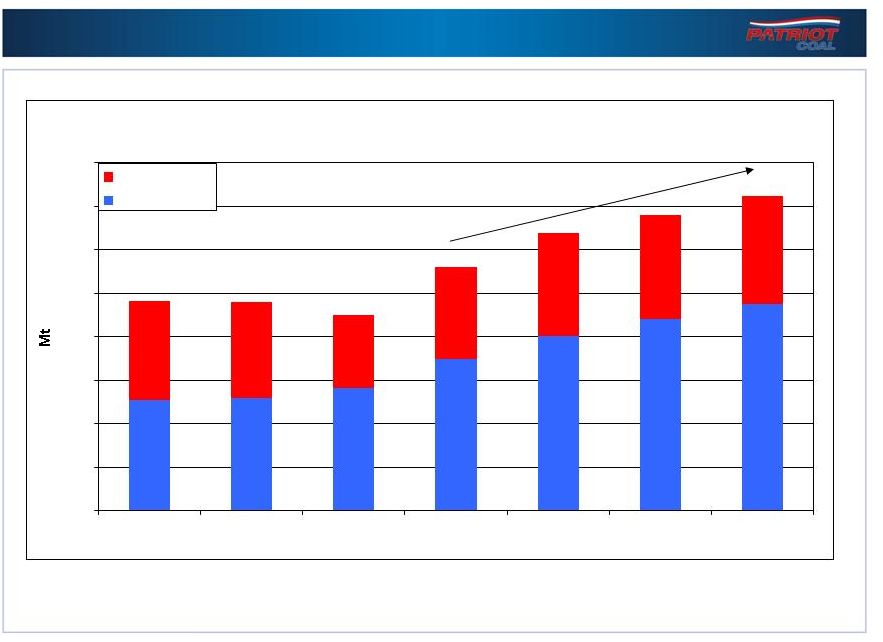
Global seaborne met demand is expected to continue to increase
0
50
100
150
200
250
300
350
400
2007
2008
2009
2010E
2011F
2012F
2013F
World (ex Asia)
Asia
Source: McCloskey
Expanding Seaborne Met Demand |
 5
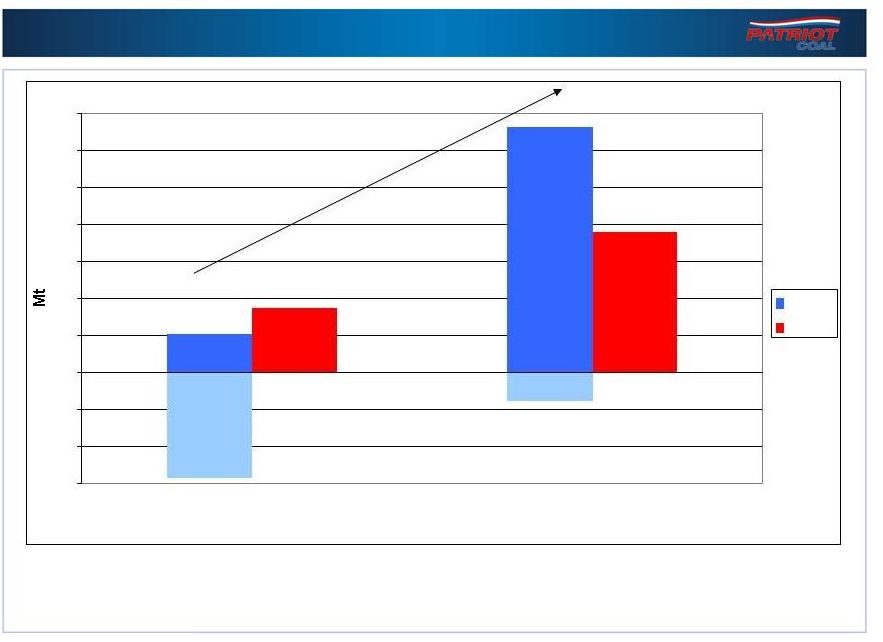
Exports are negative
Drivers of Global Coal Demand
Global met & thermal coal demand driven by China & India
-75
-50
-25
0
25
50
75
100
125
150
175
China
India
2005
Note: Imports are positive
2010 |
 6
Russia, Vietnam
Indonesia, S. Africa,
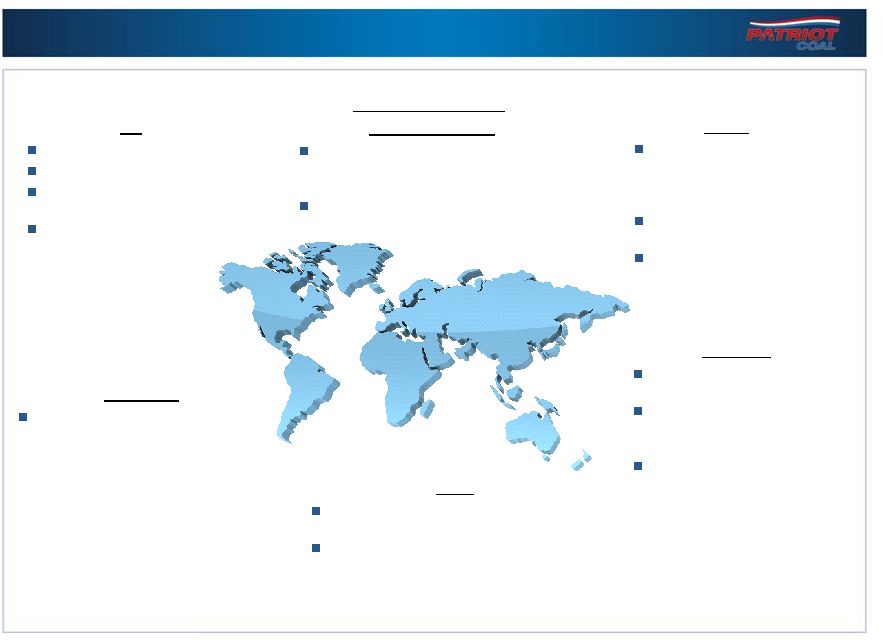
Why Global Coal Supply is Constrained
Global supply constraints are tightening markets
Australia
Infrastructure constraints limit
long
-term supply increase
Record rainfall threatens to
reduce production by 15 -
20Mt in 2011
Infrastructure needed to
supply global demand
China
Constrained rail & truck
infrastructure makes
shipping within China
difficult
Indigenous met coal is
lower quality
Formerly a net exporter,
currently a net importer
India
Plentiful indigenous coal reserves, but
lower quality
Poor transportation infrastructure
Indonesia, S. Africa,
Russia, Vietnam
Dom
estic
demand increases are
absorbing coal production historically
exported
Declining exports
US
Depleting eastern reserves
Difficult permitting
Stricter implementation of
safety rules
Supply increases will be
difficult
Colombia
Heavy La Nina rains are limiting
production and exports
Australia
Infrastructure constraints limit
Record rainfall threatens to
reduce production by 15
20Mt in 2011
Infrastructure needed to
supply global demand
China
Constrained rail & truck
infrastructure makes
shipping within China
difficult
Indigenous met coal is
lower quality
Formerly a net exporter,
currently a net importer
India
Plentiful indigenous coal reserves, but
lower quality
Poor transportation infrastructure
Dom
estic
demand increases are
absorbing coal production historically
exported
Declining exports
US
Depleting eastern reserves
Difficult permitting
Stricter implementation of
safety rules
Supply increases will be
difficult
Colombia
Heavy La Nina rains are limiting
production and exports |
 7
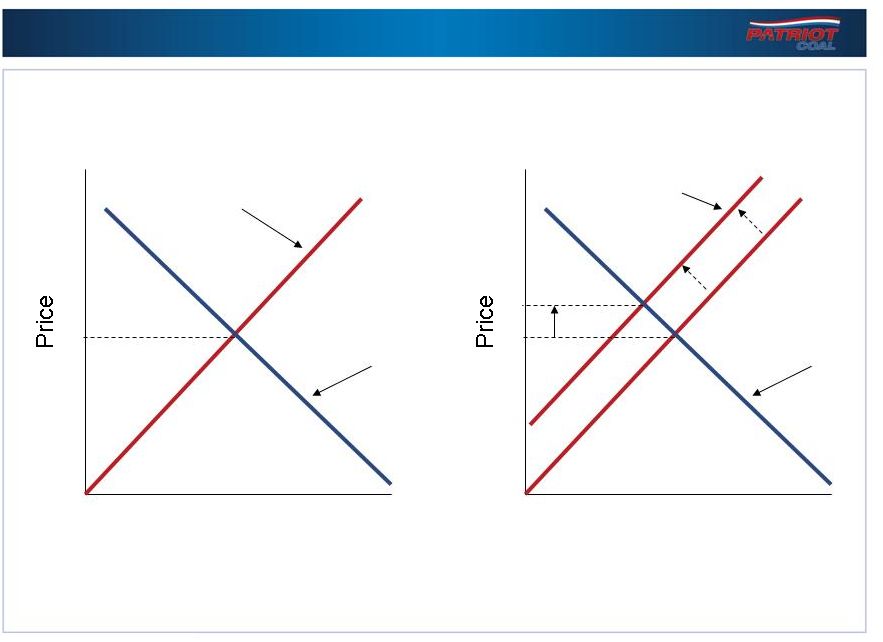
Typical Determination of Price
Quantity
Supply
Demand
Quantity
Supply
Demand
Price increases as supply contracts |
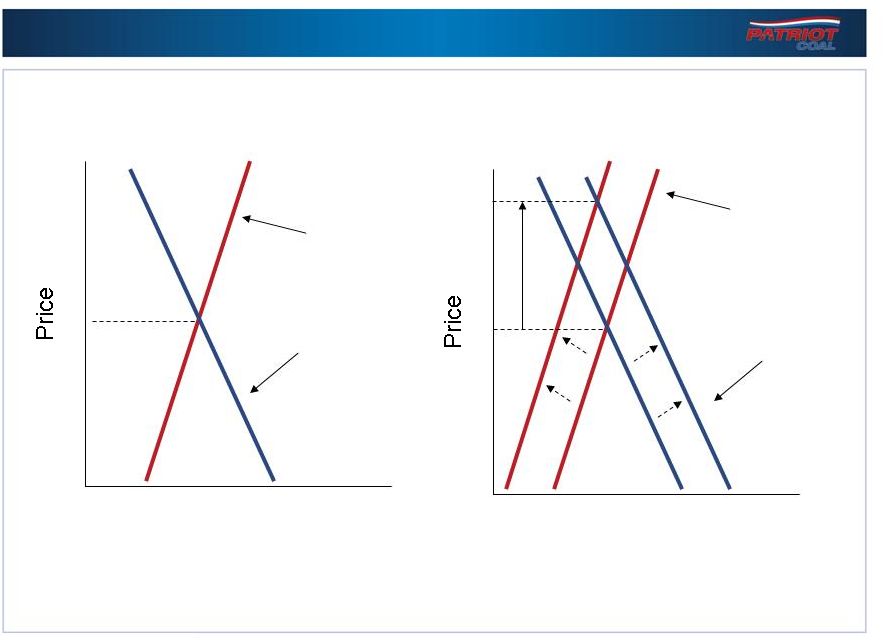 8
Coal Market Determination of Price
Prices are rapidly rising due to the steep supply & demand curves
Quantity
Supply
Demand
Quantity
Supply
Demand |
 9
How Markets React to Higher Price
Thermal & met markets are co-dependent
–
Near-
to intermediate-term, coal production is a closed
system
Both metallurgical and thermal prices are rising
–
Met prices are rising very rapidly
Coal producer reactions
–
More thermal coal crosses over to met
–
Longer-term, more met mines will be opened or re-opened to
increase supply
Customer reactions
–
Use lower quality met coal
–
Re-direct higher quality met coal to higher priced steel
–
Increase use of electric arc furnaces for steel production
•
Uses scrap steel instead of met coal |
 10
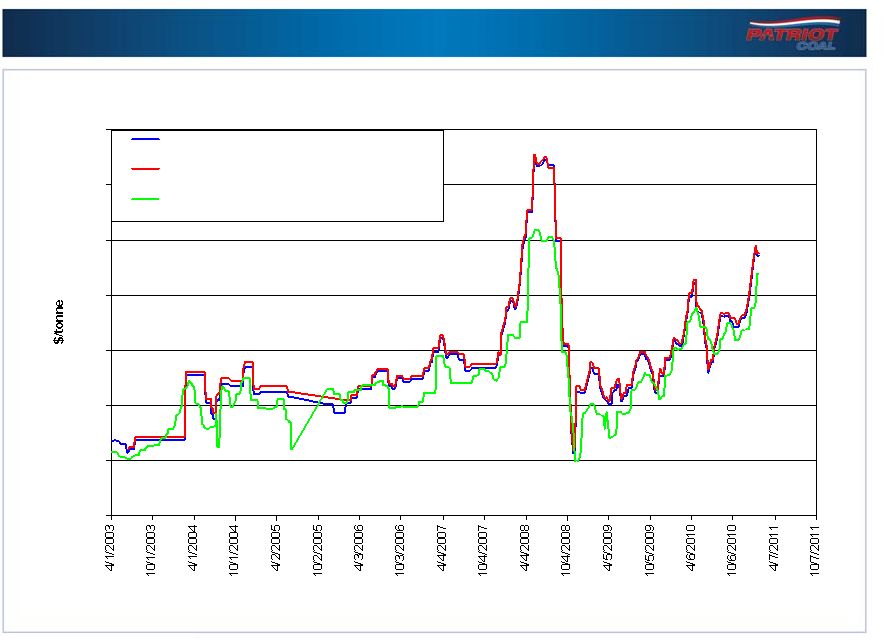
Scrap Steel Price Dynamics
Scrap steel prices have been steadily rising
0
100
200
300
400
500
600
700
No1 Heavy Melting Export Index, fob East Coast
Shredded Steel Scrap, fob East Coast
No1 Heavy Melting US Index, fob Pittsburgh,
Philadelphia, Chicago
Updated:
1/27/201 |
 11
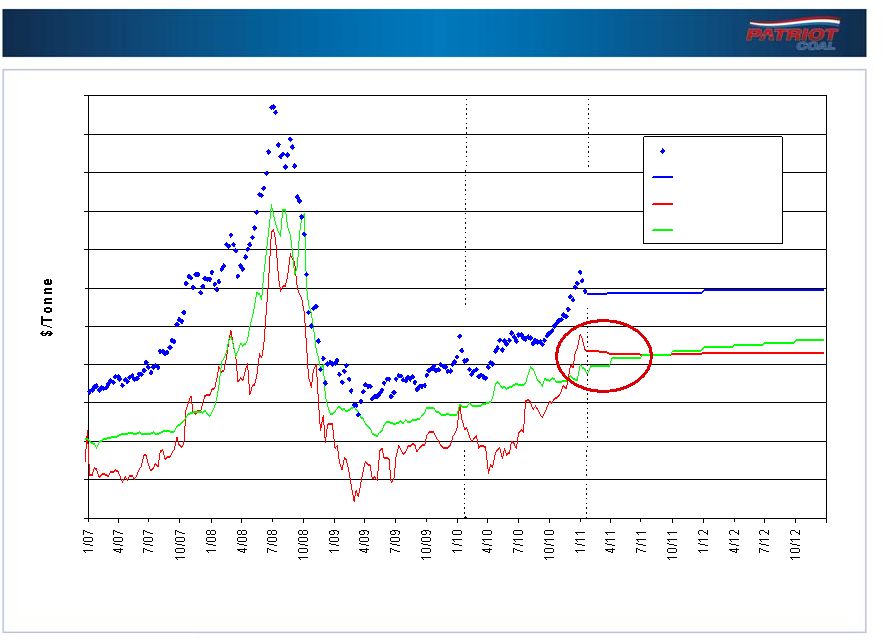
Higher European Thermal Import Prices
Higher global thermal prices provide opportunity for U.S. exports
0
20
40
60
80
100
120
140
160
180
200
220
API2 Prompt Quarter
API2 Forward, 1/31/11
CAPP Netback
CAPP Prompt & Forward
Updated:
02/02/11
Source: McCloskey
0
20
40
60
80
100
120
140
160
180
200
220
API2 Prompt Quarter
API2 Forward, 1/31/11
CAPP Netback
CAPP Prompt & Forward
Updated:
02/02/11
Source: McCloskey |
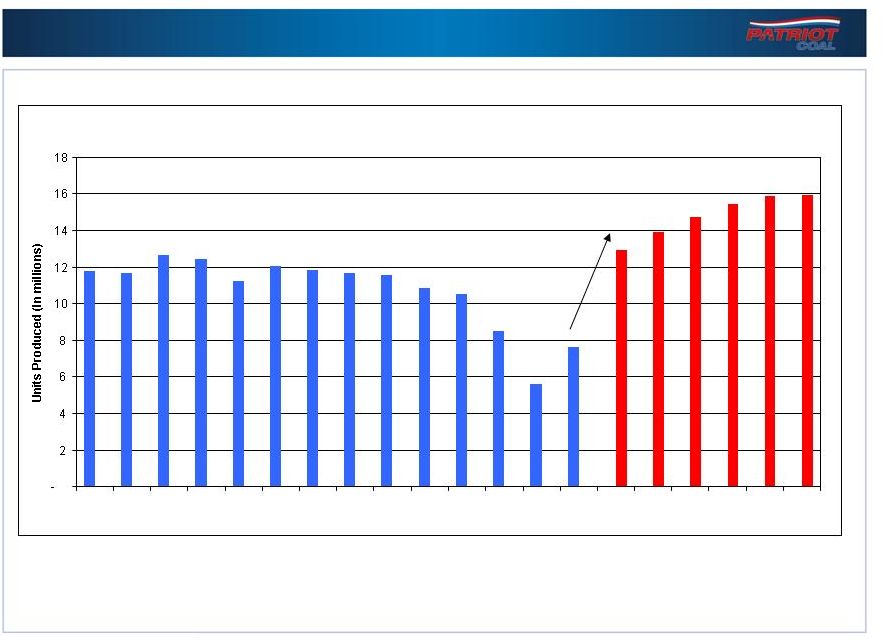 12
Higher U.S. industrial production will create more coal demand
-
2
4
6
8
10
12
14
16
18
97
98
99
00
01
02
03
04
05
06
07
08
09
10
11E
12E
13E
14E
15E
16E
Note: Data provided by CSM Worldwide
Rebounding U.S. Automobile Production |
 13
How PCX Will Participate in
Strong Coal Markets |
 14
Bolt-on
Acquisitions
Increased
Market Cap
Organic
Growth
Expanding
Revenues
& Cash Flow
Transformational
M&A
Patriot’s Growth Cycle
PCX
Foundation of
Strength &
Potential |
 15
PCX –
Strength & Potential
1.8 billion tons of proven and probable
reserves
Multiple basins, mining operations & shipping
options
Leading producer of metallurgical coal
Highest Btu basins –
CAPP, NAPP, ILB
Strong safety culture
Significant leverage to rising prices
Meaningful EBITDA upside in 2012 & 2013
from expiration of legacy contracts
Project pipeline to capitalize on opportunities
Organic metallurgical coal growth
7 new mines in next 2 years
Targeting more than 11.0 million tons
production by 2013
Targeting 40.0 million tons total production
within 5 years
Proven M&A track record
Expanding
Revenue
& Cash Flow
Organic Growth
and M&A
Foundation of
Strength &
Potential |
 16
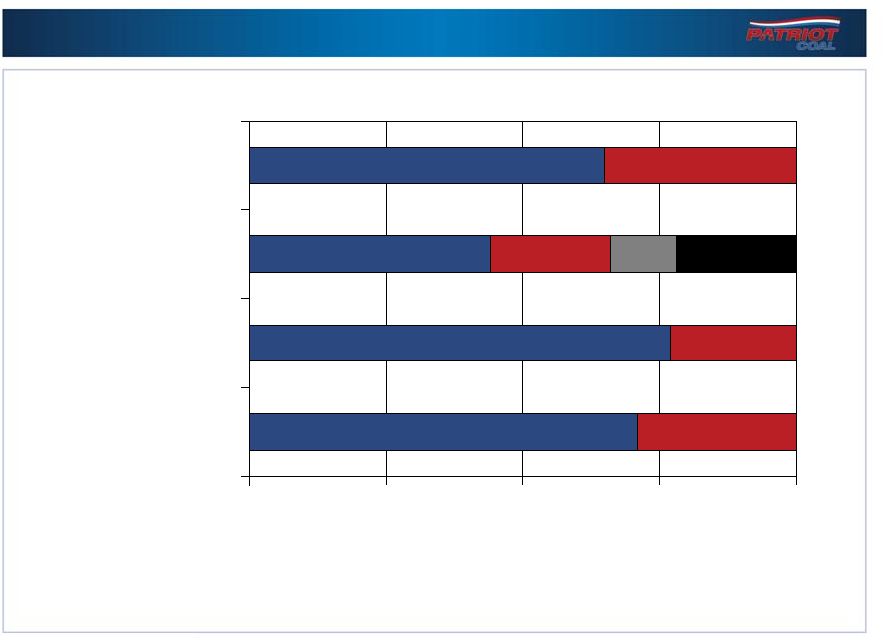
Product Diversification
0%
25%
50%
75%
100%
APP
CAPP thermal
NAPP
ILB
ILB
Underground
Surface
2010 Tons Sold
30.9 Million Tons
Mining Method
67%
Reserves
1.8 Billion Tons
Diverse locations, products & mining methods
Significant met coal exports
2010 Met Shipments
Domestic
Export
Met |
 17
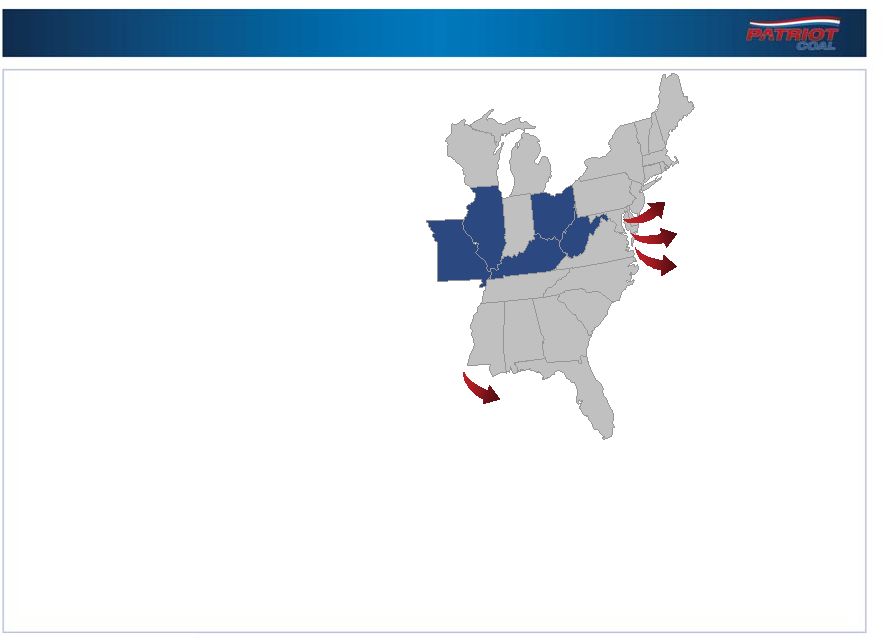
Advantage of Diversity
Multiple Basins & Coal Qualities:
Northern Appalachia Thermal
Federal
Central Appalachia Metallurgical
Kanawha Eagle
Panther
Rocklick
Wells
Central Appalachia Thermal
Big Mountain
Blue Creek
Campbell’s Creek
Corridor G
Logan County
Paint Creek
Illinois Basin Thermal
Bluegrass
Dodge Hill
Highland
Multiple quality & transportation options
Transportation Optionality:
Rail
Barge
East Coast & Gulf exports
IL
OH
KY
WV
MO
New Orleans
Baltimore
Newport News
Norfolk |
 18
0
2
4
6
8
10
12
14
16
18
Metallurgical
Appalachia
Thermal
Illinois Basin
Priced
Unpriced
Leverage to Higher Pricing in 2011
48 -
53
40
Illinois Basin
$65 -
$85
TBD
Current
Market
59
$127
Priced
Business
Metallurgical
Appalachia
Thermal
Significant leverage to higher pricing in 2011
50% Rocklick
& Wells; 50%
Panther-type |
 19
48 –
53
49
Illinois Basin
$70 -
$90
NA
Current
Market
$57
NA
Priced
Business
Metallurgical
Appalachia
Thermal
Significant leverage to higher pricing in 2012
Leverage to Higher Pricing in 2012
0
2
4
6
8
10
12
14
16
18
Metallurgical
Appalachia
Thermal
Illinois Basin
Priced |
 20
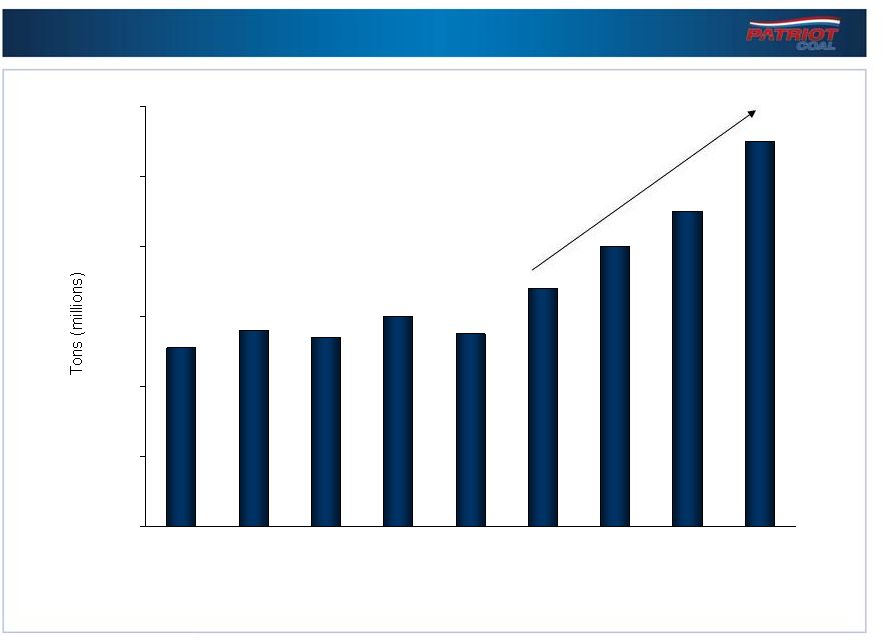
0.0
2.0
4.0
6.0
8.0
10.0
12.0
2005
2006
2007
2008
2009
2010
2011
2012
2013
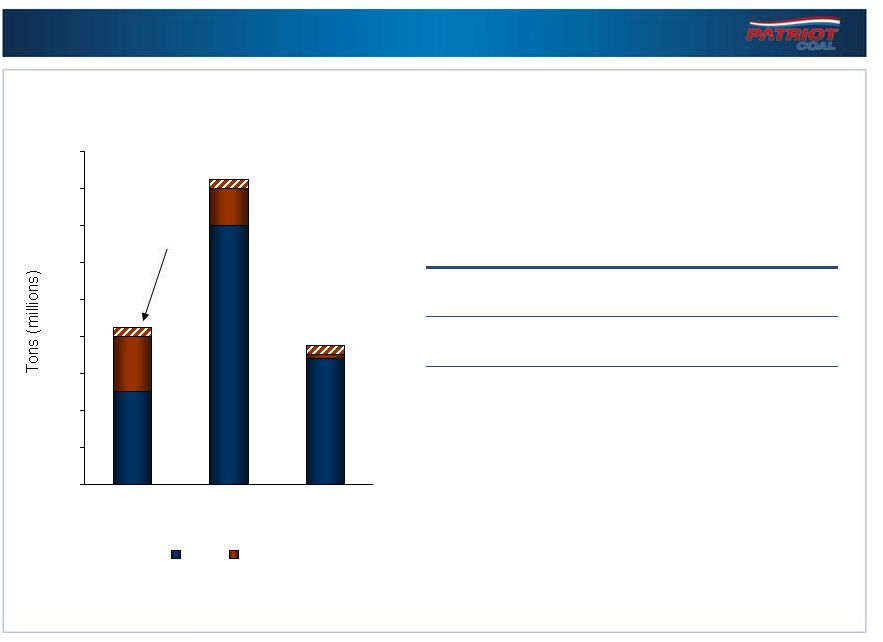
Patriot Met Coal Expansion Plans
Opening 7 new met mines to meet rising worldwide demand
+60% increase |
 21
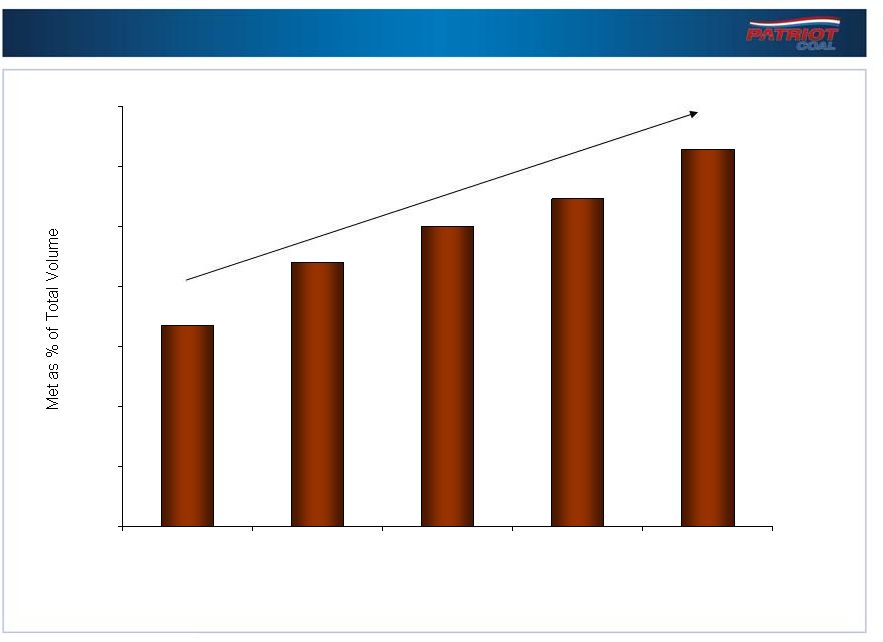
0%
5%
10%
15%
20%
25%
30%
35%
2009
2010
2011
2012
2013
Increasing Met Exposure
Expanding high-margin met coal as a percent of total production
+85% increase |
 22
Impact of Legacy Thermal Contracts
$0
$50
$100
$150
$200
Current
Market
Less
$5.00/ton
Current
Market
Current
Market
Plus
$5.00/ton
6.5
million
tons
to
be
repriced
over
the
next
24
months
$0
$50
$100
$150
$200
Current
Market
Less
$5.00/ton
Current
Market
Current
Market
Plus
$5.00/ton
2012
2013 |
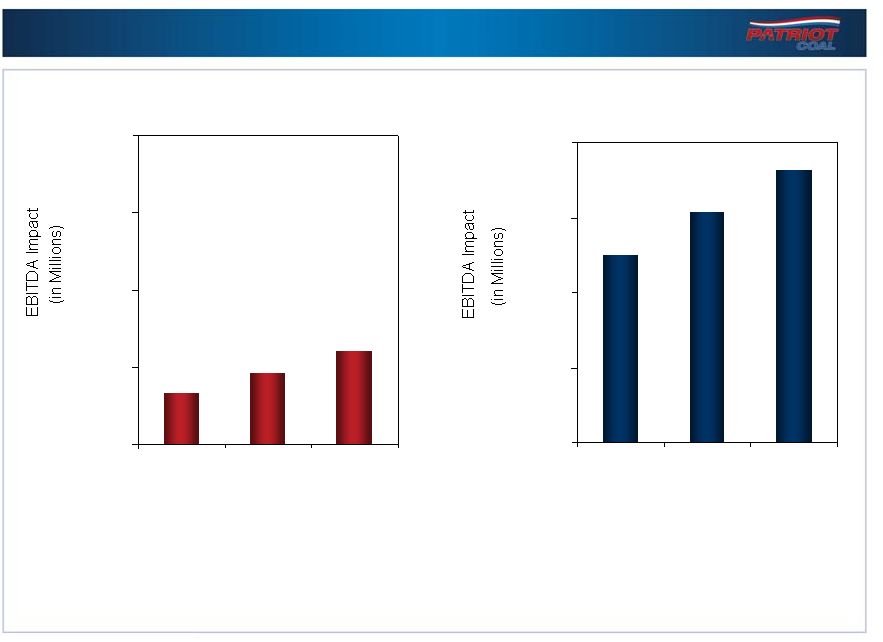
 23
Price Sensitivity
Increase in Price per Ton
Higher prices have a dramatic impact on EBITDA
* Assumes 23 million tons thermal, 8 million tons met, 15% taxes/royalties
Thermal
Met
$0
$100
$200
$300
$400
$500
$5
$10
$15
$20 |
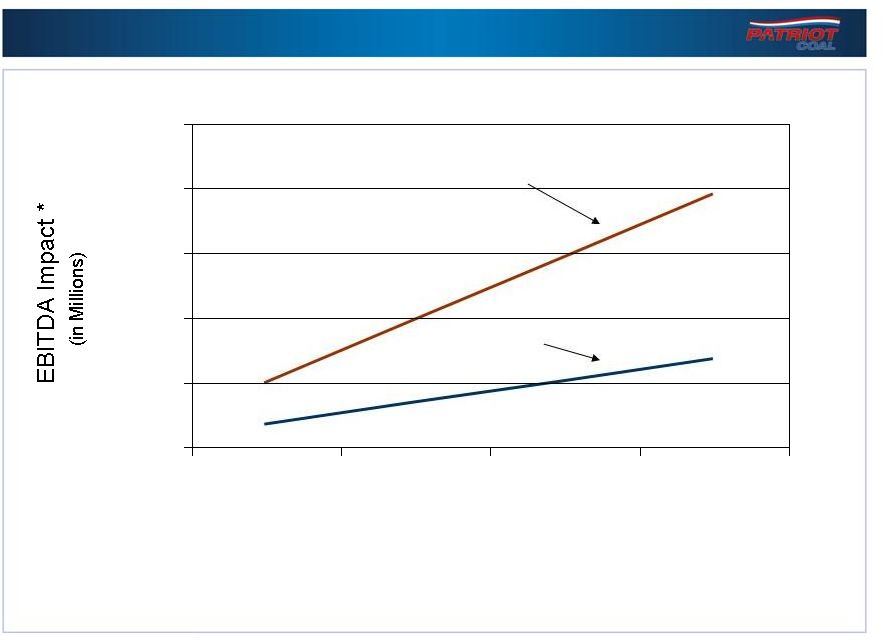
 24
Financial Metrics
EBITDA
(in Millions)
EBITDA per ton
28% increase
$0
$25
$50
$75
$100
$125
$150
2008
2009
2010
50% increase
$0.00
$2.00
$4.00
$6.00
$8.00
$10.00
$12.00
$14.00 |
 25
Bolt-on
Acquisitions
Increased
Market Cap
Organic
Growth
Expanding
Revenues
& Cash Flow
Transformational
M&A
Patriot’s Growth Cycle
PCX
Foundation of
Strength &
Potential |
 FINANCIAL
COMMUNITY PRESENTATION
February 9 & 10, 2011
Contact:
Janine Orf
Director, Investor Relations
314.275.3680
jorf@patriotcoal.com |
 27
$(48.0)
(0.5)
12.8
(57.4)
(15.2)
(63.0)
121.5
(188.1)
$141.9
2010
-
-
Income tax provision
$127.2
16.6
(38.1)
(20.2)
(35.1)
298.6
(205.3)
$110.7
2009
-
Restructuring & Impairment Charge
249.5
Sales Contract Accretion, net
$142.7
17.2
(23.6)
(19.2)
(125.4)
$44.2
2008
EBITDA
Net Income (Loss)
Interest Income
Reclamation & Remediation
Obligation Expense
Depreciation, Depletion &
Amortization
Interest Expense
Reconciliation of EBITDA to Net Income
($ in Millions) |