Attached files
| file | filename |
|---|---|
| 8-K - FORM 8-K - PEABODY ENERGY CORP | c62857e8vk.htm |

| 1 1 CSFB 2011 Energy Summit February 9-10, 2011 Vic Svec Senior Vice President Investor Relations and Corporate Communications Exhibit 99.1 |
| 2 Statement on Forward-Looking Information Some of the following information contains forward-looking statements within the meaning of Section 27A of the Securities Act of 1933 and Section 21E of the Securities Exchange Act of 1934, as amended, and is intended to come within the safe-harbor protection provided by those sections. Our forward-looking statements are based on numerous assumptions that the company believes are reasonable, but they are open to a wide range of uncertainties and business risks that may cause actual results to differ materially from expectations as of Jan. 25, 2011. These factors are difficult to accurately predict and may be beyond the company's control. The company does not undertake to update its forward-looking statements. Factors that could affect the company's results include, but are not limited to: demand for coal in the United States and the Pacific Rim thermal and metallurgical coal seaborne markets; price volatility and demand, particularly in higher-margin products and in our trading and brokerage businesses; impact of weather on demand, production and transportation; reductions and/or deferrals of purchases by major customers and ability to renew sales contracts; credit and performance risks associated with customers, suppliers, co-shippers, trading, banks and other financial counterparties; geologic, equipment, permitting and operational risks related to mining; transportation availability, performance and costs; availability, timing of delivery and costs of key supplies, capital equipment or commodities such as diesel fuel, steel, explosives and tires; successful implementation of business strategies, including our Btu Conversion and generation development initiatives; negotiation of labor contracts, employee relations and workforce availability; changes in postretirement benefit and pension obligations and funding requirements; replacement and development of coal reserves; access to capital and credit markets and availability and costs of credit, margin capacity, surety bonds, letters of credit, and insurance; effects of changes in interest rates and currency exchange rates (primarily the Australian dollar); effects of acquisitions or divestitures; economic strength and political stability of countries in which we have operations or serve customers; legislation, regulations and court decisions or other government actions, including new environmental requirements, changes in income tax regulations or other regulatory taxes; litigation, including claims not yet asserted; and other risks detailed in the company's reports filed with the Securities and Exchange Commission (SEC). The use of "Peabody," "the company," and "our" relate to Peabody, its subsidiaries and majority- owned affiliates. EBITDA or Adjusted EBITDA is defined as income from continuing operations before deducting net interest expense, income taxes, asset retirement obligation expense, and depreciation, depletion and amortization. EBITDA, which is not calculated identically by all companies, is not a substitute for operating income, net income or cash flow as determined in accordance with United States generally accepted accounting principles. Management uses EBITDA as a key measure of operating performance and also believes it is a useful indicator of the company's ability to meet debt service and capital expenditure requirements. Adjusted EPS is defined as income from continuing operations and diluted earnings per share excluding the impact of the remeasurement of foreign income tax accounts. Management has included this measurement because, in management's opinion, excluding such impact is a better indicator of the company's ongoing effective tax rate and diluted earnings per share, and is therefore more useful in comparing the company's results with prior and future periods. 01/25/11 |
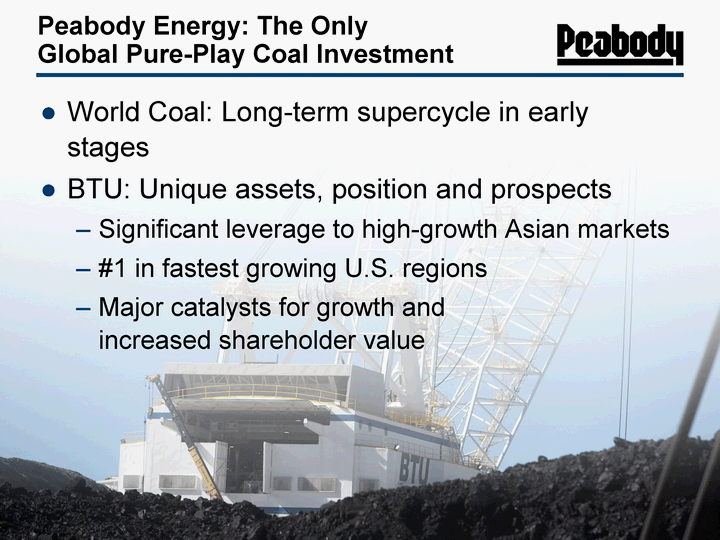
| 3 Peabody Energy: The Only Global Pure-Play Coal Investment World Coal: Long-term supercycle in early stages BTU: Unique assets, position and prospects Significant leverage to high-growth Asian markets #1 in fastest growing U.S. regions Major catalysts for growth and increased shareholder value |
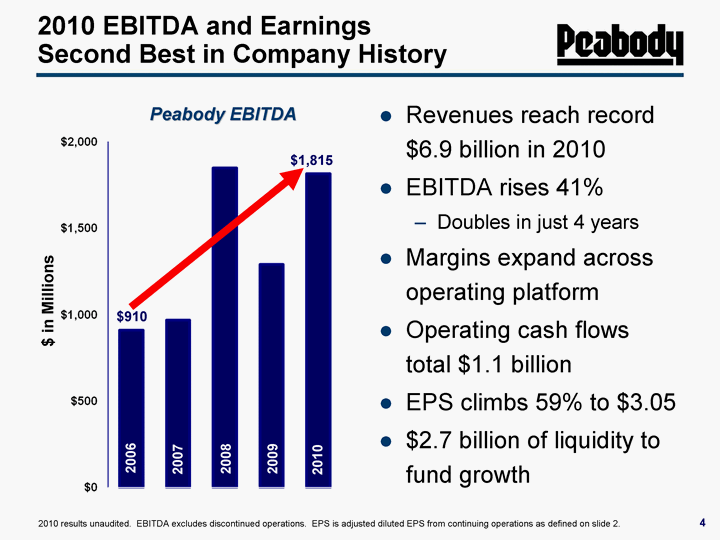
| 4 Revenues reach record $6.9 billion in 2010 EBITDA rises 41% Doubles in just 4 years Margins expand across operating platform Operating cash flows total $1.1 billion EPS climbs 59% to $3.05 $2.7 billion of liquidity to fund growth $1,815 2010 EBITDA and Earnings Second Best in Company History $ in Millions 2006 2007 2008 2009 2010 2010 results unaudited. EBITDA excludes discontinued operations. EPS is adjusted diluted EPS from continuing operations as defined on slide 2. $910 Peabody EBITDA |
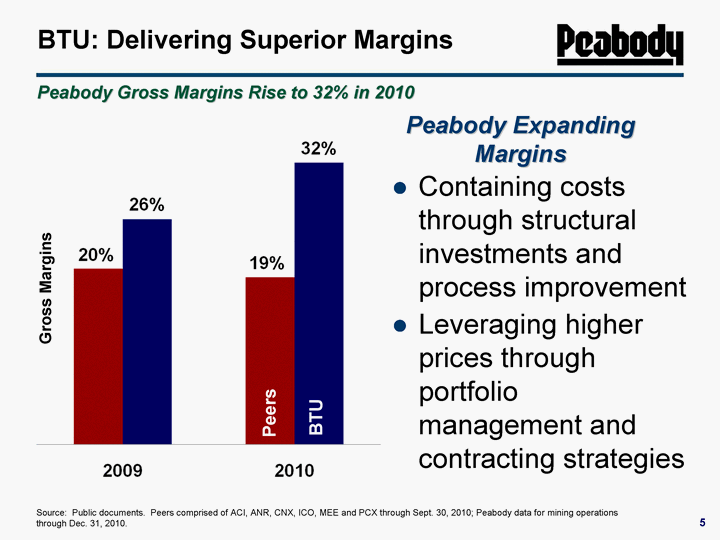
| 5 BTU: Delivering Superior Margins Source: Public documents. Peers comprised of ACI, ANR, CNX, ICO, MEE and PCX through Sept. 30, 2010; Peabody data for mining operations through Dec. 31, 2010. Gross Margins Containing costs through structural investments and process improvement Leveraging higher prices through portfolio management and contracting strategies BTU Peers Peabody Gross Margins Rise to 32% in 2010 Peabody Expanding Margins |
| Global Markets Outstanding for Coal |
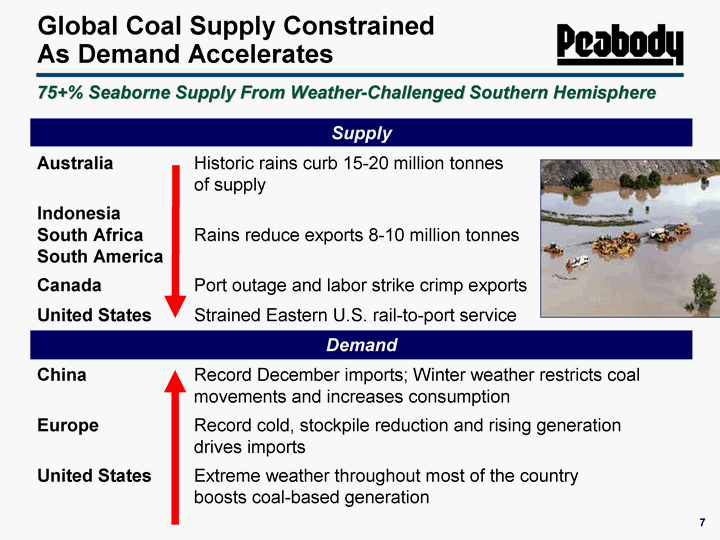
| 75+% Seaborne Supply From Weather-Challenged Southern Hemisphere Supply Supply Australia Historic rains curb 15-20 million tonnes of supply Indonesia South Africa South America Rains reduce exports 8-10 million tonnes Canada Port outage and labor strike crimp exports United States Strained Eastern U.S. rail-to-port service Demand Demand China Record December imports; Winter weather restricts coal movements and increases consumption Europe Record cold, stockpile reduction and rising generation drives imports United States Extreme weather throughout most of the country boosts coal-based generation Global Coal Supply Constrained As Demand Accelerates 7 |
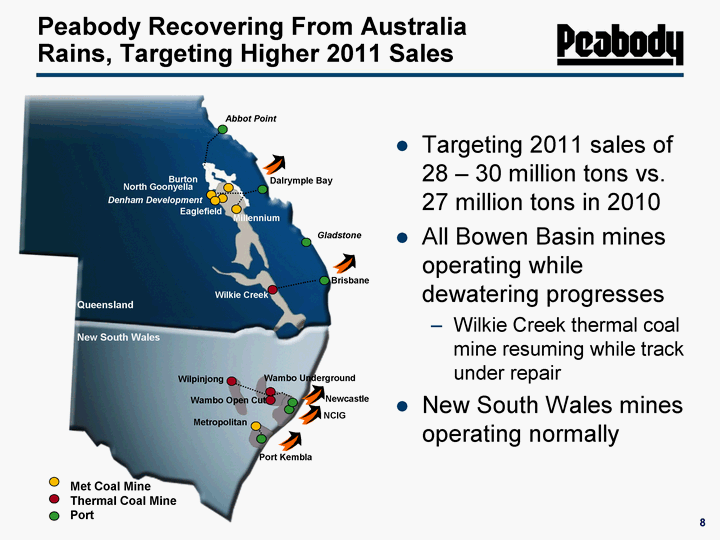
| 8 Peabody Recovering From Australia Rains, Targeting Higher 2011 Sales Burton North Goonyella Eaglefield Millennium Metropolitan Dalrymple Bay Abbot Point Port Kembla Queensland New South Wales Wilkie Creek Brisbane Wilpinjong Wambo Underground Wambo Open Cut NCIG Newcastle Gladstone Met Coal Mine Thermal Coal Mine Port Denham Development Targeting 2011 sales of 28 - 30 million tons vs. 27 million tons in 2010 All Bowen Basin mines operating while dewatering progresses Wilkie Creek thermal coal mine resuming while track under repair New South Wales mines operating normally |
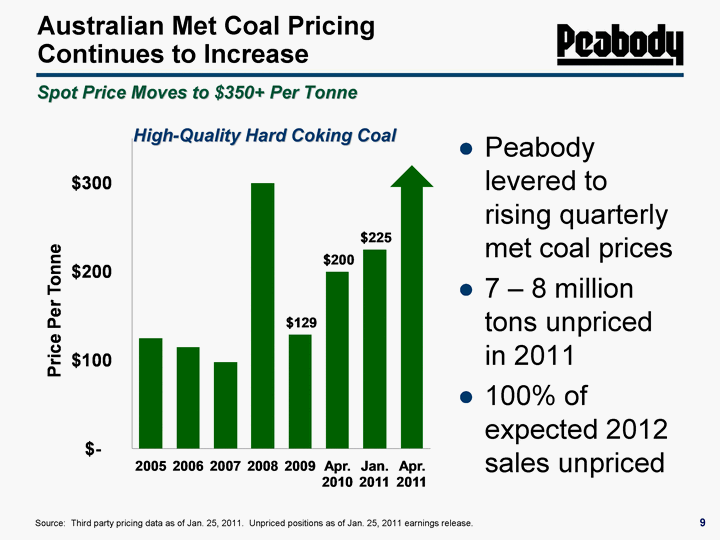
| Australian Met Coal Pricing Continues to Increase Peabody levered to rising quarterly met coal prices 7 - 8 million tons unpriced in 2011 100% of expected 2012 sales unpriced 9 High-Quality Hard Coking Coal Source: Third party pricing data as of Jan. 25, 2011. Unpriced positions as of Jan. 25, 2011 earnings release. Spot Price Moves to $350+ Per Tonne |
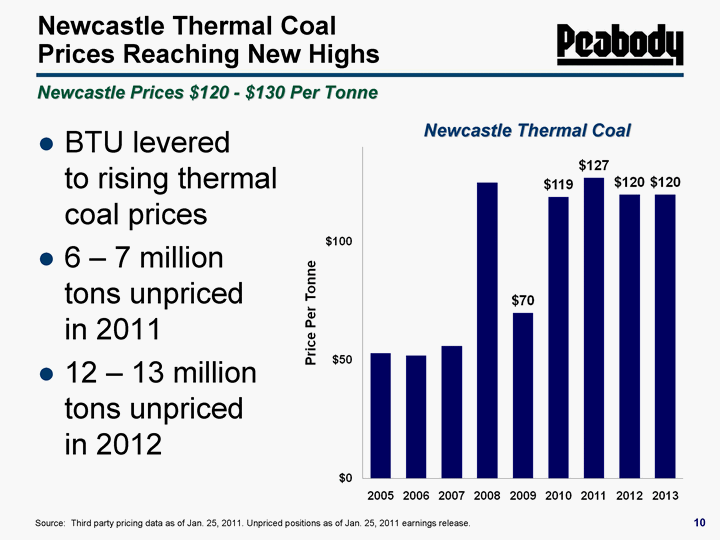
| Newcastle Thermal Coal Prices Reaching New Highs BTU levered to rising thermal coal prices 6 - 7 million tons unpriced in 2011 12 - 13 million tons unpriced in 2012 10 Newcastle Thermal Coal Source: Third party pricing data as of Jan. 25, 2011. Unpriced positions as of Jan. 25, 2011 earnings release. Newcastle Prices $120 - $130 Per Tonne |
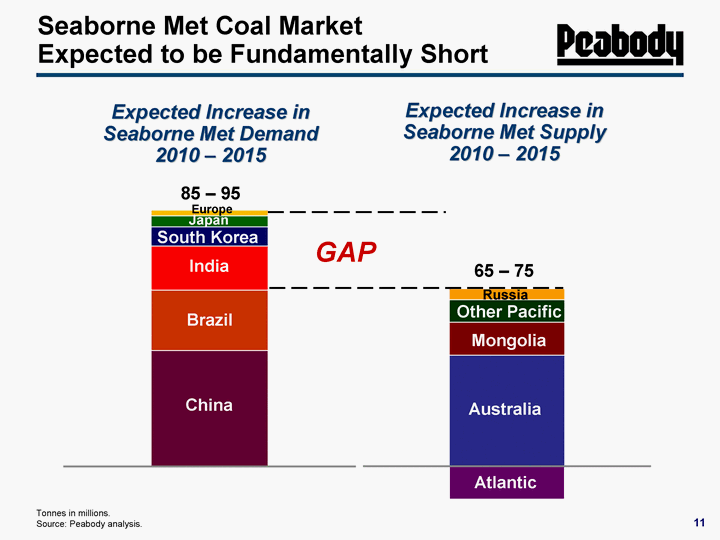
| Seaborne Met Coal Market Expected to be Fundamentally Short Expected Increase in Seaborne Met Demand 2010 - 2015 Expected Increase in Seaborne Met Supply 2010 - 2015 Tonnes in millions. Source: Peabody analysis. 65 - 75 Atlantic Brazil India China Europe South Korea Japan 85 - 95 Australia Mongolia Other Pacific Russia GAP 11 |
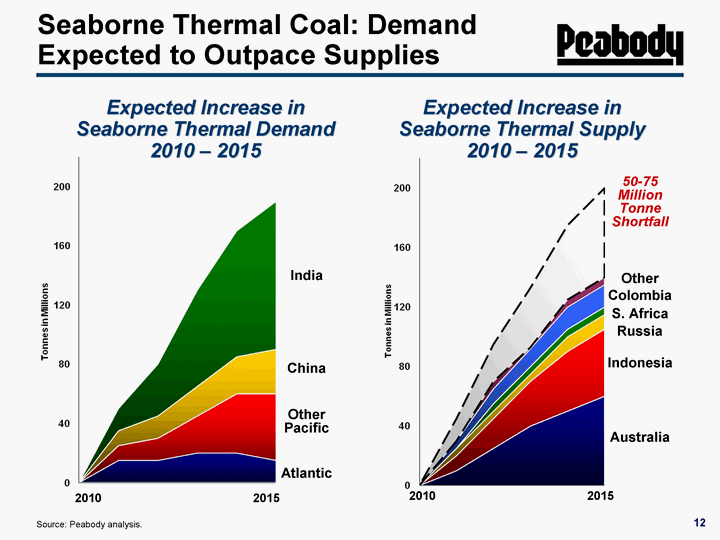
| 12 12 Seaborne Thermal Coal: Demand Expected to Outpace Supplies Expected Increase in Seaborne Thermal Demand 2010 - 2015 India China Other Pacific Atlantic Expected Increase in Seaborne Thermal Supply 2010 - 2015 Australia Indonesia Russia S. Africa Colombia Other Source: Peabody analysis. 2010 2015 2010 2015 50-75 Million Tonne Shortfall |
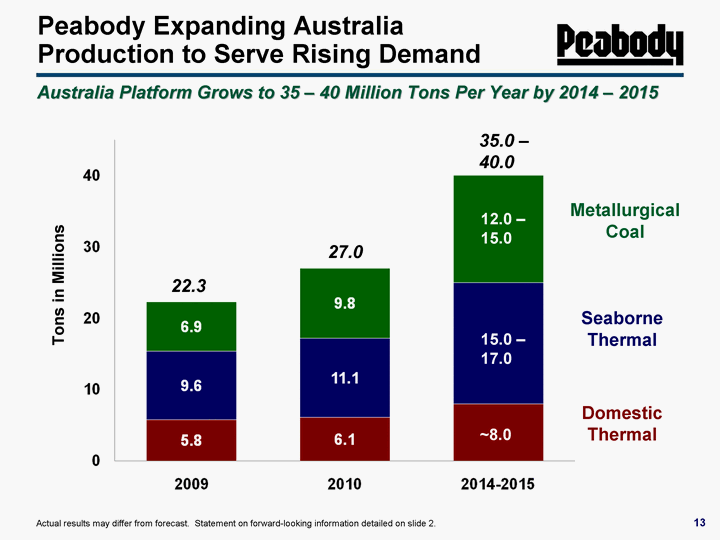
| Peabody Expanding Australia Production to Serve Rising Demand 13 ~8.0 15.0 - 17.0 12.0 - 15.0 27.0 35.0 - 40.0 Tons in Millions Actual results may differ from forecast. Statement on forward-looking information detailed on slide 2. 22.3 Australia Platform Grows to 35 - 40 Million Tons Per Year by 2014 - 2015 Metallurgical Coal Seaborne Thermal Domestic Thermal |
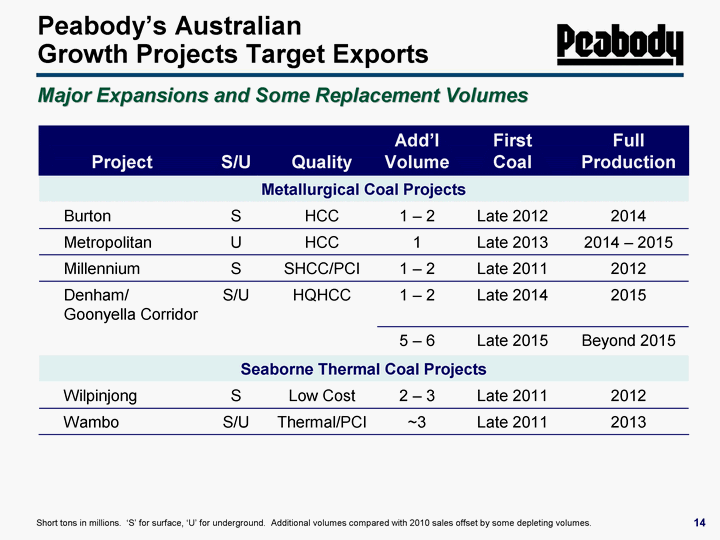
| Project S/U Quality Add'l Volume First Coal Full Production Metallurgical Coal Projects Metallurgical Coal Projects Metallurgical Coal Projects Metallurgical Coal Projects Metallurgical Coal Projects Metallurgical Coal Projects Burton S HCC 1 - 2 Late 2012 2014 Metropolitan U HCC 1 Late 2013 2014 - 2015 Millennium S SHCC/PCI 1 - 2 Late 2011 2012 Denham/ Goonyella Corridor S/U HQHCC 1 - 2 Late 2014 2015 5 - 6 Late 2015 Beyond 2015 Seaborne Thermal Coal Projects Seaborne Thermal Coal Projects Seaborne Thermal Coal Projects Seaborne Thermal Coal Projects Seaborne Thermal Coal Projects Seaborne Thermal Coal Projects Wilpinjong S Low Cost 2 - 3 Late 2011 2012 Wambo S/U Thermal/PCI ~3 Late 2011 2013 14 Major Expansions and Some Replacement Volumes Peabody's Australian Growth Projects Target Exports Short tons in millions. 'S' for surface, 'U' for underground. Additional volumes compared with 2010 sales offset by some depleting volumes. |
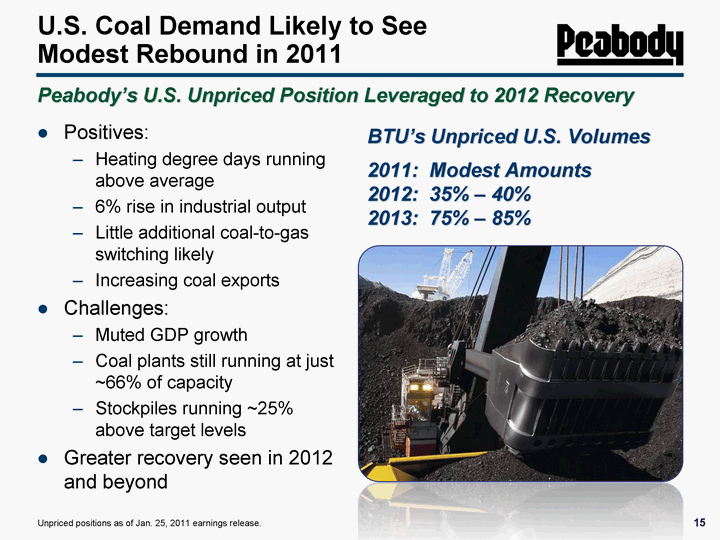
| U.S. Coal Demand Likely to See Modest Rebound in 2011 Positives: Heating degree days running above average 6% rise in industrial output Little additional coal-to-gas switching likely Increasing coal exports Challenges: Muted GDP growth Coal plants still running at just ~66% of capacity Stockpiles running ~25% above target levels Greater recovery seen in 2012 and beyond 15 Peabody's U.S. Unpriced Position Leveraged to 2012 Recovery BTU's Unpriced U.S. Volumes 2011: Modest Amounts 2012: 35% - 40% 2013: 75% - 85% Unpriced positions as of Jan. 25, 2011 earnings release. |
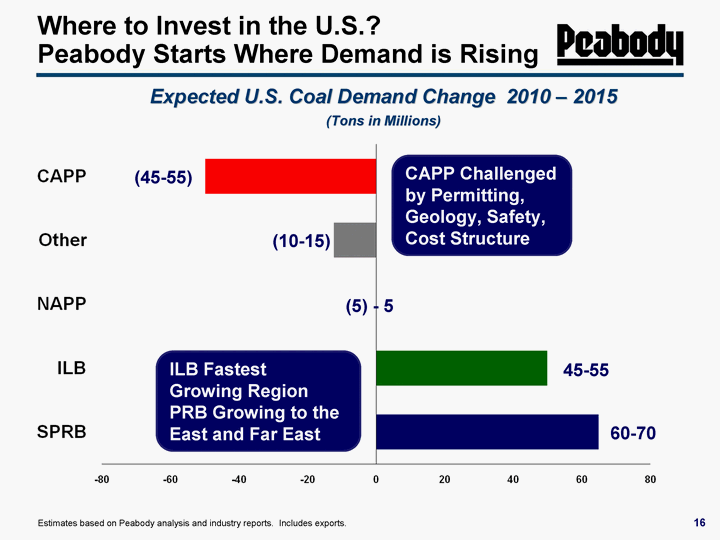
| Where to Invest in the U.S.? Peabody Starts Where Demand is Rising 16 Expected U.S. Coal Demand Change 2010 - 2015 (Tons in Millions) 60-70 45-55 (5) - 5 (10-15) (45-55) Estimates based on Peabody analysis and industry reports. Includes exports. CAPP Challenged by Permitting, Geology, Safety, Cost Structure ILB Fastest Growing Region PRB Growing to the East and Far East |
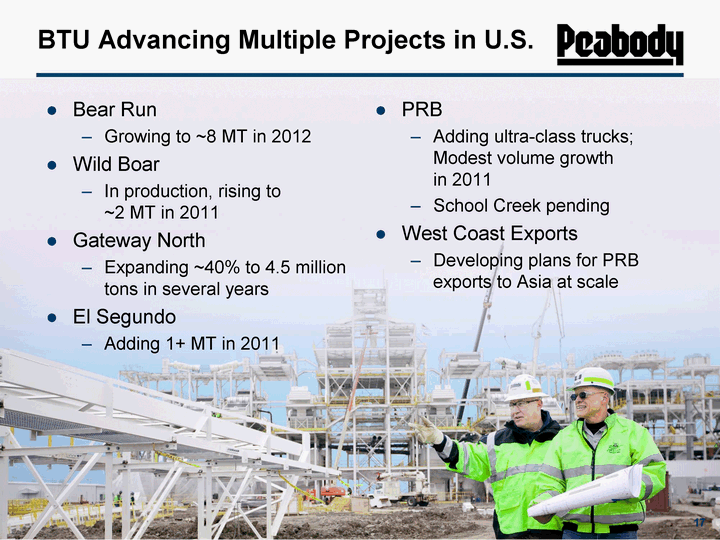
| BTU Advancing Multiple Projects in U.S. Bear Run Growing to ~8 MT in 2012 Wild Boar In production, rising to ~2 MT in 2011 Gateway North Expanding ~40% to 4.5 million tons in several years El Segundo Adding 1+ MT in 2011 PRB Adding ultra-class trucks; Modest volume growth in 2011 School Creek pending West Coast Exports Developing plans for PRB exports to Asia at scale 17 |

| Early Stages of Coal Supercycle |
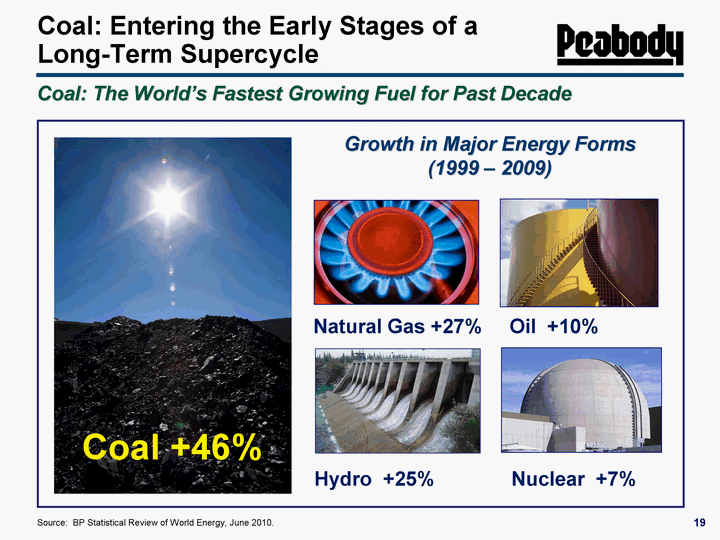
| Coal: Entering the Early Stages of a Long-Term Supercycle 19 Coal: The World's Fastest Growing Fuel for Past Decade Source: BP Statistical Review of World Energy, June 2010. Coal +46% Growth in Major Energy Forms (1999 - 2009) Natural Gas +27% Oil +10% Hydro +25% Nuclear +7% |
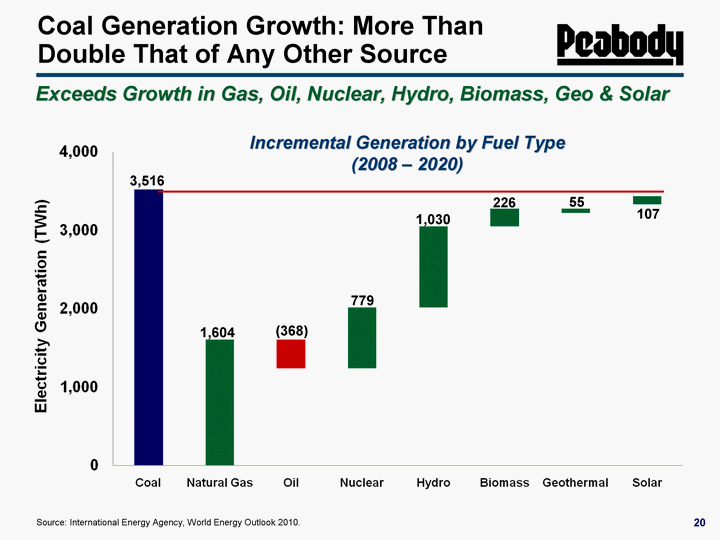
| Coal Generation Growth: More Than Double That of Any Other Source 20 Source: International Energy Agency, World Energy Outlook 2010. Exceeds Growth in Gas, Oil, Nuclear, Hydro, Biomass, Geo & Solar 3,516 1,604 (368) 779 1,030 226 55 107 Incremental Generation by Fuel Type (2008 - 2020) |
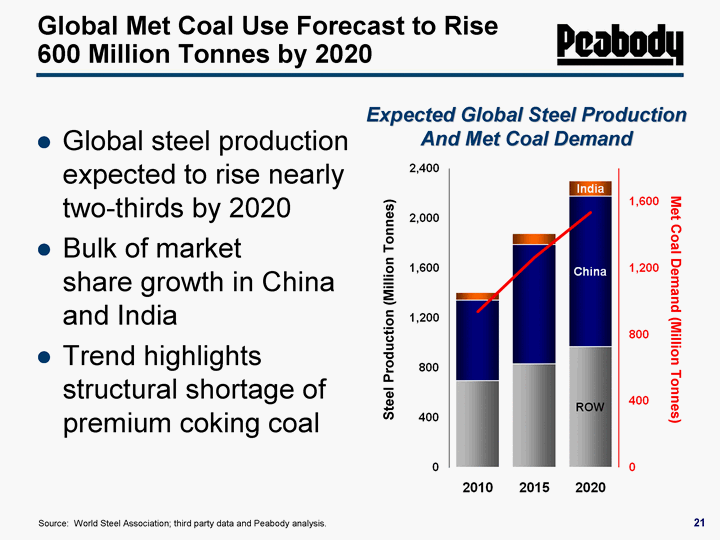
| 21 21 Global Met Coal Use Forecast to Rise 600 Million Tonnes by 2020 Expected Global Steel Production And Met Coal Demand Source: World Steel Association; third party data and Peabody analysis. Global steel production expected to rise nearly two-thirds by 2020 Bulk of market share growth in China and India Trend highlights structural shortage of premium coking coal Other India China EU/US Met Coal Demand (Million Tonnes) Steel Production (Million Tonnes) |
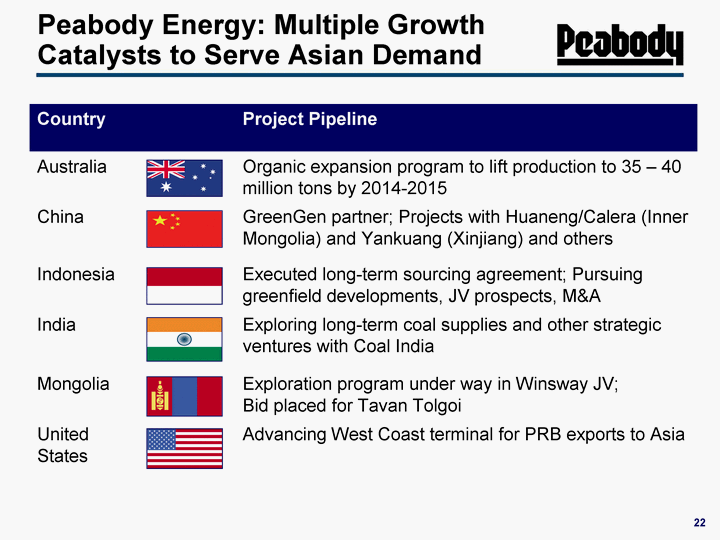
| Country Country Project Pipeline Australia Organic expansion program to lift production to 35 - 40 million tons by 2014-2015 China GreenGen partner; Projects with Huaneng/Calera (Inner Mongolia) and Yankuang (Xinjiang) and others Indonesia Executed long-term sourcing agreement; Pursuing greenfield developments, JV prospects, M&A India Exploring long-term coal supplies and other strategic ventures with Coal India Mongolia Exploration program under way in Winsway JV; Bid placed for Tavan Tolgoi United States Advancing West Coast terminal for PRB exports to Asia Peabody Energy: Multiple Growth Catalysts to Serve Asian Demand 22 |
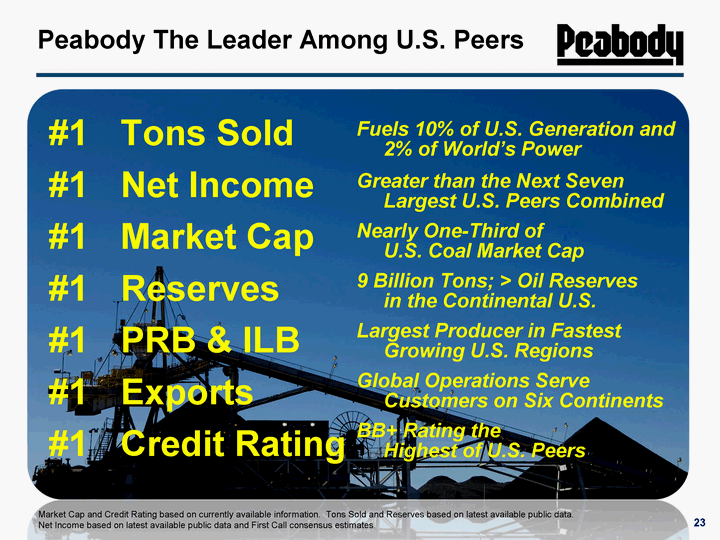
| Peabody The Leader Among U.S. Peers #1 Tons Sold #1 Net Income #1 Market Cap #1 Reserves #1 PRB & ILB #1 Exports #1 Credit Rating 23 Fuels 10% of U.S. Generation and 2% of World's Power Greater than the Next Seven Largest U.S. Peers Combined Nearly One-Third of U.S. Coal Market Cap 9 Billion Tons; > Oil Reserves in the Continental U.S. Largest Producer in Fastest Growing U.S. Regions Global Operations Serve Customers on Six Continents BB+ Rating the Highest of U.S. Peers Market Cap and Credit Rating based on currently available information. Tons Sold and Reserves based on latest available public data. Net Income based on latest available public data and First Call consensus estimates. |
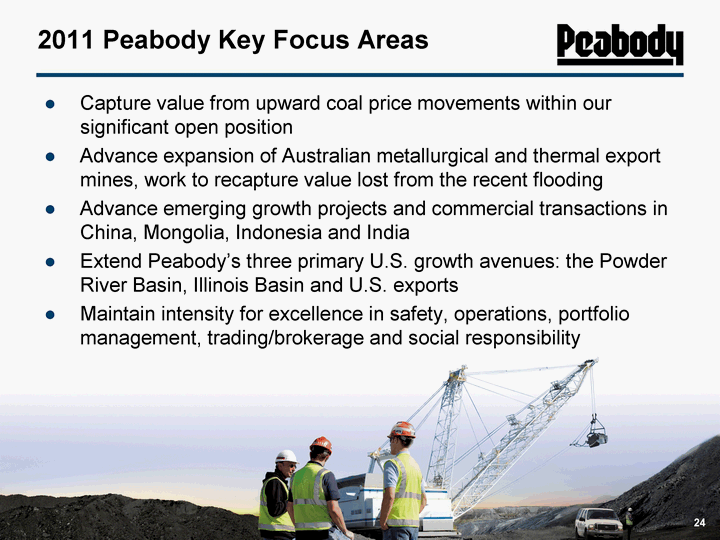
| 24 2011 Peabody Key Focus Areas Capture value from upward coal price movements within our significant open position Advance expansion of Australian metallurgical and thermal export mines, work to recapture value lost from the recent flooding Advance emerging growth projects and commercial transactions in China, Mongolia, Indonesia and India Extend Peabody's three primary U.S. growth avenues: the Powder River Basin, Illinois Basin and U.S. exports Maintain intensity for excellence in safety, operations, portfolio management, trading/brokerage and social responsibility |

| 25 25 CSFB 2011 Energy Summit February 9-10, 2011 Vic Svec Senior Vice President Investor Relations and Corporate Communications |
