Attached files
| file | filename |
|---|---|
| 8-K - FORM 8-K - NATIONAL FINANCIAL PARTNERS CORP | d8k.htm |
 FOURTH QUARTER 2010 EARNINGS CALL PRESENTATION
FEBRUARY 9, 2011
Exhibit 99.1 |
 2
Related to Forward-Looking Statements
Certain
items
in
this
presentation
and
in
today’s
discussion,
including
matters
relating
to
revenue,
net
income,
Adjusted
EBITDA,
cash
earnings,
cash
earnings
per
diluted
share
and
percentages
or
calculations
using
these
measures,
acquisitions,
capital
structure
or
growth
rates
and
other
financial
measurements
and
non-financial
statements
in
future
periods,
constitute
forward-looking
statements
as
that
term
is
defined
in
the
Private
Securities
Litigation
Reform
Act
of
1995.
These
forward-looking
statements
are
based
on
management's
current
views
with
respect
to
future
results
and
are
subject
to
risks
and
uncertainties.
These
statements
are
not
guarantees
of
future
performance.
Actual
results
may
differ
materially
from
those
contemplated
by
forward-looking
statements.
National
Financial
Partners
Corp.
(“NFP”
or
the
“Company”)
refers
you
to
its
filings
with
the
SEC,
including
its
Annual
Report
on
Form
10-K
for
the
year
ended
December
31,
2009,
filed
on
February
12,
2010,
its
Quarterly
Report
on
Form
10-Q
for
the
period
ended
March
31,
2010,
filed
with
the
SEC
on
May
10,
2010
and
its
Quarterly
Report
on
Form
10-Q
for
the
period
ended
June
30,
2010,
filed
with
the
SEC
on
August
4,
2010
for
additional
discussion
of
these
risks
and
uncertainties
as
well
as
a
cautionary
statement
regarding
forward-looking
statements.
Forward-looking
statements
made
during
this
presentation
speak
only
as
of
today's
date.
NFP
expressly
disclaims
any
obligation
to
update
or
revise
any
forward-looking
statements,
whether
as
a
result
of
new
information,
future
events
or
otherwise. |
 3
Related to Non-GAAP Financial Information
The
Company
analyzes
its
performance
using
historical
and
forward-looking
non-GAAP
measures
called
cash
earnings,
cash
earnings
per
diluted
share,
Adjusted
EBITDA,
adjusted
income
before
management
fees,
management
fees
(excluding
the
accelerated
vesting
of
certain
RSUs),
and
percentages
or
calculations
using
these
measures.
The
Company
believes
these
non-
GAAP
measures
provide
additional
meaningful
methods
of
evaluating
certain
aspects
of
the
Company’s
operating
performance
from
period
to
period
on
a
basis
that
may
not
be
otherwise
apparent
under
GAAP.
Cash
earnings
is
defined
as
net
income
excluding
amortization
of
intangibles,
depreciation,
the
after-tax
impact
of
the
impairment
of
goodwill
and
intangible
assets,
the
after-tax
impact
of
non-cash
interest
expense
and
the
after-tax
impact
of
certain
non-recurring
items.
Cash
earnings
per
diluted
share
is
calculated
by
dividing
cash
earnings
by
the
number
of
weighted
average
diluted
shares
outstanding
for
the
period
indicated.
Cash
earnings
and
cash
earnings
per
diluted
share
should
not
be
viewed
as
substitutes
for
net
income
and
net
income
per
diluted
share,
respectively.
Adjusted
EBITDA
is
defined
as
net
income
excluding
income
tax
expense,
interest
income,
interest
expense,
gain
on
early
extinguishment
of
debt,
other,
net,
amortization
of
intangibles,
depreciation,
impairment
of
goodwill
and
intangible
assets,
(gain)
loss
on
sale
of
businesses,
the
pre-tax
impact
of
the
accelerated
vesting
of
certain
RSUs
and
any
change
in
estimated
contingent
consideration
amounts
recorded
in
accordance
with
purchase
accounting
that
have
been
subsequently
adjusted
and
recorded
in
the
consolidated
statement
of
operations.
Adjusted
EBITDA
should
not
be
viewed
as
a
substitute
for
net
income.
Adjusted
income
before
management
fees
is
defined
as
income
before
management
fees
excluding
corporate
income.
Adjusted
income
before
management
fees
should
not
be
viewed
as
a
substitute
for
income
from
operations.
Management
fees
(excluding
accelerated
vesting
of
certain
RSUs)
shows
management
fees
without
the
one-time
impact
of
the
accelerated
vesting
of
certain
RSUs
on
September
17,
2010.
Management
fees
(excluding
the
accelerated
vesting
of
certain
RSUs)
should
not
be
viewed
as
a
substitute
for
management
fees.
A
reconciliation
of
these
non-GAAP
measures
to
their
GAAP
counterparts
for
the
periods
presented
herein
is
provided
in
the
Company’s
quarterly
financial
supplement
for
the
period
ended
December
31,
2010,
which
is
available
on
the
Investor
Relations
section
of
the
Company’s
Web
site
at
www.nfp.com. |
 4
Reconciliation: Net Income to Cash Earnings
Q4 2010
Q4 2009
YTD 2010
YTD 2009
GAAP net income (loss)
$ 15,269
$ 1,851
$ 42,558
$ (493,386)
Amortization of intangibles
8,211
8,806
33,013
36,551
Depreciation
3,095
8,857
12,123
19,242
Impairment of goodwill and intangible assets
-
6,231
2,901
618,465
Tax benefit of impairment of goodwill and intangible assets
(15)
(1,133)
(1,147)
(90,608)
Non-cash interest, net of tax
802
1,559
5,094
6,814
Accelerated vesting of certain RSUs, net of tax
-
-
8,174
-
Gain on debt, net of tax
-
-
(5,914)
-
Cash earnings
(1)
$ 27,362
$ 26,171
$ 96,802
$ 97,078
GAAP
net
income
(loss)
per
share
-
diluted
$ 0.34
$ 0.04
$ 0.96
$ (12.02)
Amortization of intangibles
0.18
0.20
0.75
0.87
Depreciation
0.07
0.21
0.27
0.46
Impairment of goodwill and intangible assets
-
0.14
0.07
14.78
Tax benefit of impairment of goodwill and intangible assets
-
(0.03)
(0.03)
(2.16)
Non-cash interest, net of tax
(1)
0.02
0.04
0.12
0.16
Accelerated vesting of certain RSUs, net of tax
-
-
0.19
-
Gain on debt, net of tax
-
-
(0.13)
-
Impact of diluted shares on cash earnings not reflected in GAAP
net
loss
per
share
-
diluted
(2)
-
-
-
0.23
Cash
earnings
per
share
-
diluted
(3)
$ 0.60
$ 0.61
$ 2.19
$ 2.32
($ in thousands, except per share data)
(1) Cash earnings is a non-GAAP measure, which the Company defines as net
income excluding amortization of intangibles, depreciation, the after-tax impact of the impairment of goodwill and intangible assets, the after-tax
impact of non-cash interest expense and the after-tax impact of certain
non-recurring items. (2)
For
periods
where
the
Company
generated
a
GAAP
net
loss,
weighted
average
common
shares
outstanding
-
diluted
was
used
to
calculate
cash
earnings
per
share
-
diluted
only.
To
calculate
GAAP
net
loss
per
share,
weighted
average
common
shares
outstanding
-
diluted
is
the
same
as
weighted
average
common
shares
outstanding
-
basic
due
to
the
antidilutive
effects
of
other
items
caused
by
a
GAAP
net
loss
position.
(3)
The
sum
of
the
per-share
components
of
cash
earnings
per
share
-
diluted
may
not
agree
to
cash
earnings
per
share
-
diluted
due
to
rounding. |
 5
Reconciliation: Net Income to
Adjusted EBITDA
(1)
Adjusted EBITDA is a non-GAAP measure, which the Company defines as net income excluding income
tax expense, interest income, interest expense, gain on early
extinguishment of debt, other, net, amortization of intangibles, depreciation, impairment of goodwill
and intangible assets, (gain) loss on sale of businesses, the pre-tax impact of the
accelerated vesting of certain RSUs and any change in estimated contingent consideration amounts recorded in accordance with purchase accounting that
have been subsequently adjusted and recorded in the consolidated statement of operations.
The reconciliation of Adjusted EBITDA per reportable segment does not include the following items,
which are not allocated to any of the Company’s reportable segments: income tax expense,
interest income, interest expense, gain on early extinguishment of debt and other, net. These items are included in the reconciliation of Adjusted
EBITDA to net income on a consolidated basis.
For a reconciliation of Adjusted EBITDA per reportable segment for the three months ended December 31,
2009, March 31, 2010, June 30, 2010, September 30, 2010 and December 31, 2010, please see the
Company’s quarterly financial supplement for the period ended December 31, 2010 which is available on the Investor Relations section
of the Company’s Web site at www.nfp.com.
Corporate
Individual
Advisor
(in thousands)
Client Group
Client Group
Services Group
Consolidated
For the twelve months ended December 31, 2010
GAAP net income (loss)
42,558
$
Income tax expense (benefit)
26,481
Interest income
(3,854)
Interest expense
18,533
Gain on early extinguishment of debt
(9,711)
Other, net
(8,303)
Income (loss) from operations
43,046
$
15,202
$
7,456
$
65,704
$
Amortization of intangibles
21,397
11,615
-
33,013
Depreciation
6,298
4,458
1,367
12,123
Impairment of goodwill and intangible assets
1,931
970
-
2,901
Gain on sale of businesses
(8,057)
(2,237)
-
(10,295)
Accelerated vesting of RSUs
7,394
6,001
-
13,395
Adjusted EBITDA
(1)
72,009
$
36,009
$
8,823
$
116,841
$
For the twelve months ended December 31, 2009
GAAP net income (loss)
(493,386)
$
Income tax expense (benefit)
(74,384)
Interest income
(3,077)
Interest expense
20,567
Other, net
(11,583)
Income (loss) from operations
(319,863)
$
(244,124)
$
2,124
$
(561,863)
$
Amortization of intangibles
22,959
13,592
-
36,551
Depreciation
9,277
8,885
1,080
19,242
Impairment of goodwill and intangible assets
354,408
264,057
-
618,465
Loss (gain) on sale of businesses
7
(2,103)
-
(2,096)
Adjusted EBITDA
(1)
66,788
$
40,307
$
3,204
$
110,299
$
|
 JESSICA BIBLIOWICZ
Chairman, President & Chief Executive Officer |
 7
4Q10 Highlights
Revenue of $284.3 million, grew 2.6%
Organic revenue grew 8.6%
Positive contributions from
Corporate Client Group and Advisor Services Group
Adjusted EBITDA of $36.1 million
Continue to generate strong cash flow
Revenue grew 2.6%; Organic revenue grew 8.6% |
 8
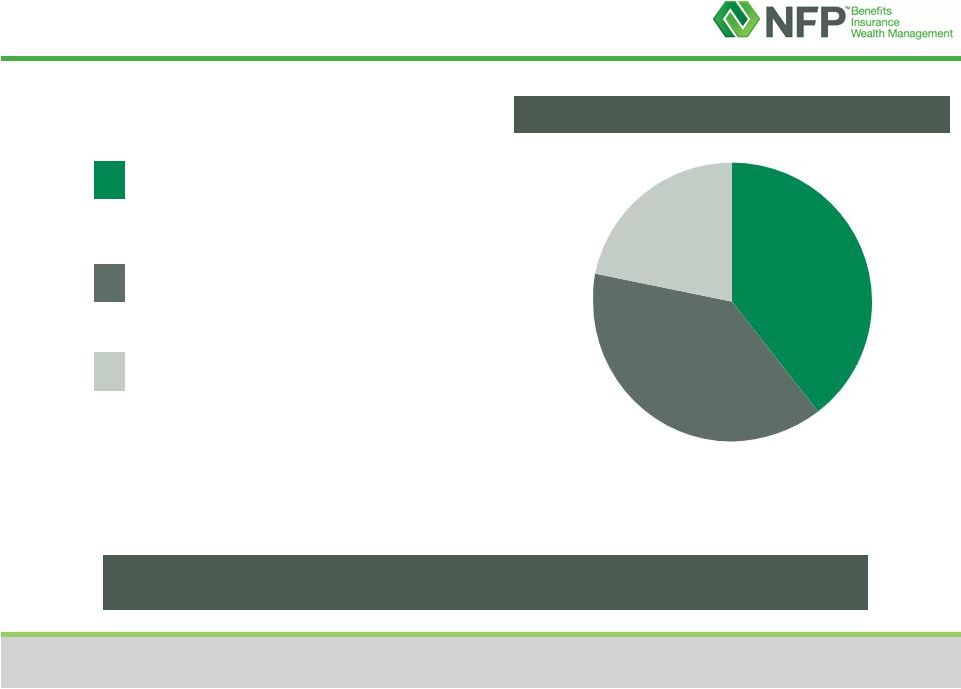
Business Segments
Advisor Services Group
Organic revenue growth +17.7%
Individual Client Group
Organic revenue growth +1.8%
Corporate Client Group
Organic revenue growth +5.8%
Organic growth in all three business segments
FY10 Revenue $981.9 million
$215.2
22%
$378.8
39%
$387.9
39% |
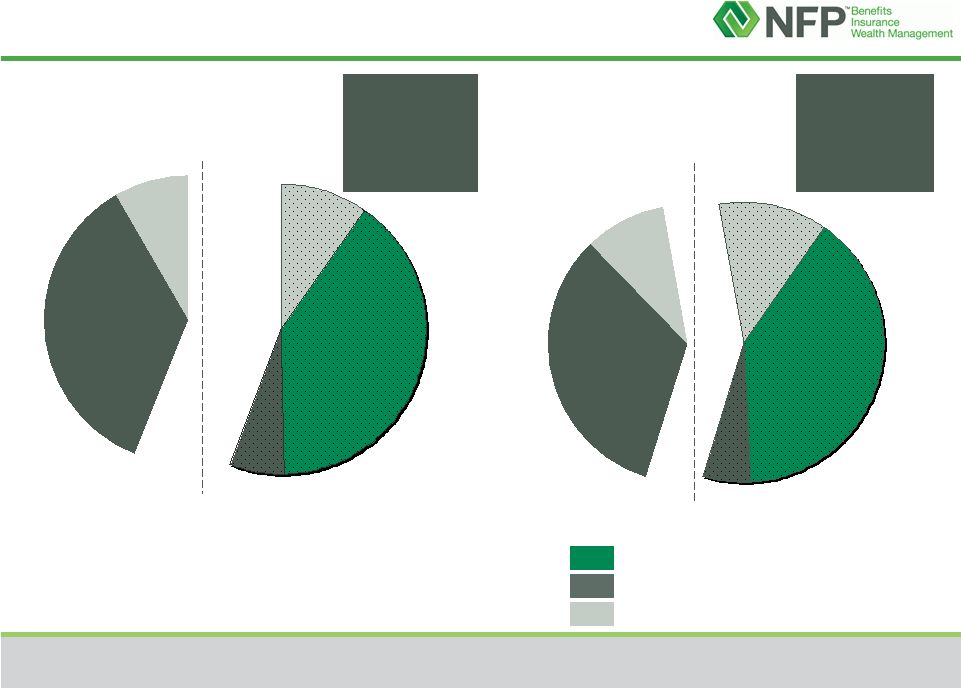
 9
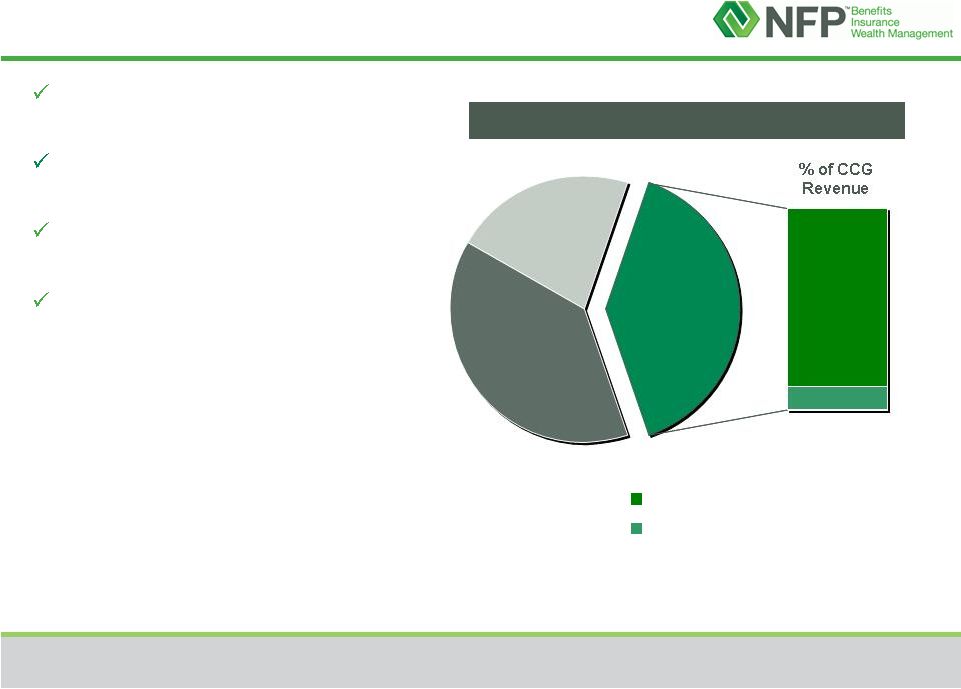
Corporate Client Group
Overview & Components of Revenue
A leader in the middle market
Organic revenue grew 8.6%
Steady performance
Long-term growth through
acquisitions, sub-acquisitions and
organically
% of CCG
Revenue
FY10 Revenue Breakdown
88%
12%
39%
Corporate Benefits
Executive Benefits |
 10
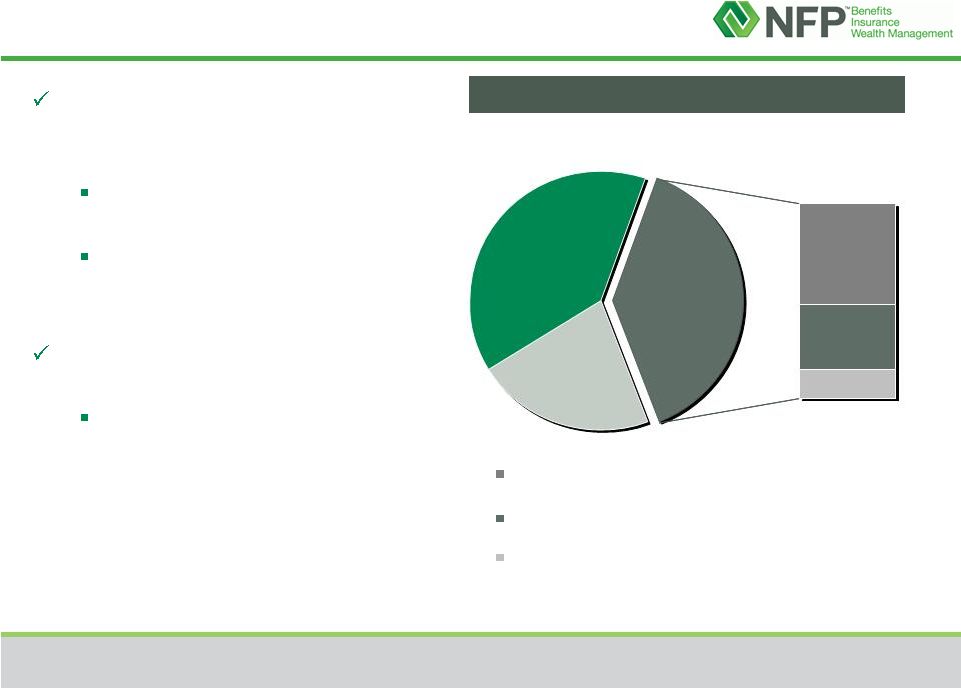
Individual Client Group
Overview & Components of Revenue
Pressure on life insurance
industry in 2010 from a
challenging market environment
Clarification on estate taxes
in December
Recruitment for long-term
growth
Continued steady performance
by investment advisors
Acquisitions, sub-acquisitions
and recruitment for long-term
growth
% of ICG
Revenue
FY10 Revenue Breakdown
Investment Advisory
39%
53%
33%
14%
Marketing Organization & Wholesale Life Brokerage
Retail Life |
 11
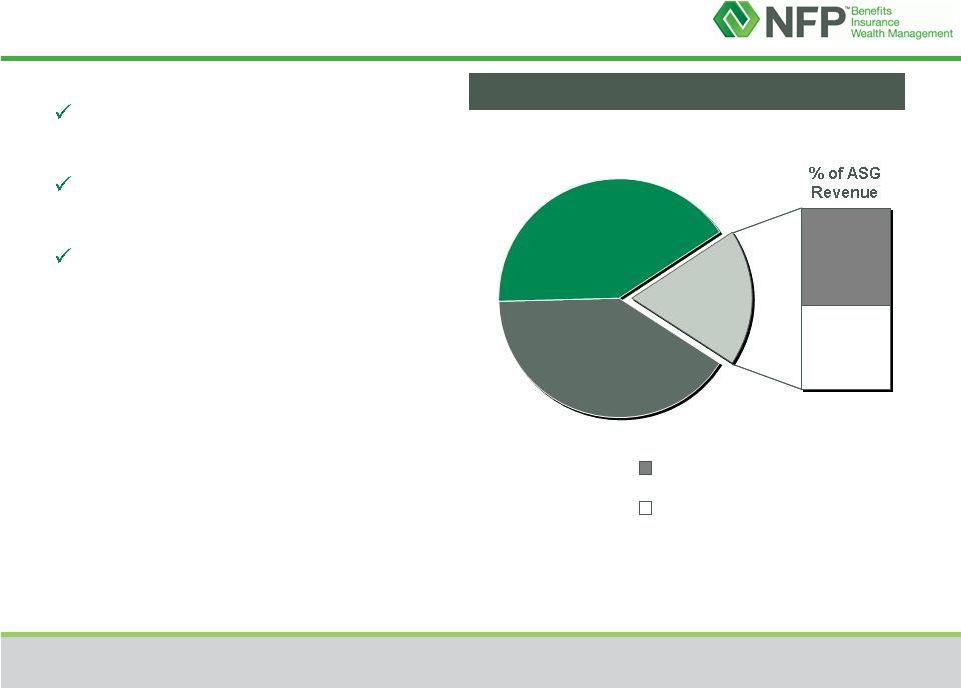
Advisor
Services Group
Overview
% of ASG
Revenue
FY10 Revenue Breakdown
Continued strong growth
AUM $9.3 billion, up 18.6% YOY
Focus on recruiting and building
scale for long-term growth
43%
57%
22%
Asset Based Fees
Commissions |
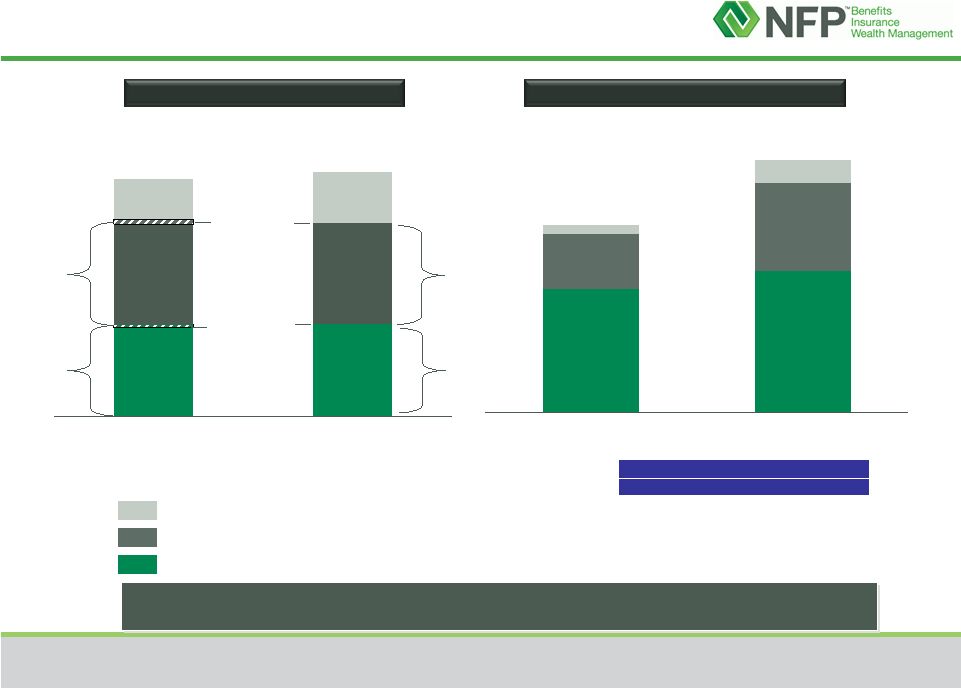
 12
$55.3
6%
$387.9
39%
$121.8
12%
$92.4
10%
$380.0
40%
$56.4
6%
$93.4
10%
$323.5
33%
$78.6
8%
$340.9
36%
Recurring Revenue
1
by Business Segment
FY10 Revenue $981.9 million
FY10
Recurring
revenue
57%
FY09
Recurring
revenue
56%
1
Recurring revenue refers to revenue that is generally recurring in nature
and includes corporate and executive benefits, investment advisory and
asset based fees businesses.
FY09 Revenue $948.3 million
($ in millions)
Individual Client Group
Corporate Client Group
Advisor Services Group |
 DOUG HAMMOND
Chief Operating Officer |
 14
Corporate Client Group
A leader in the corporate middle market
Coordinated independent solutions
Health and welfare
Retirement planning
Ancillary services
Executive benefits
P&C insurance
Steady and recurring business with opportunities for growth
Opportunities and uncertainties remain with healthcare reform
Positive market drivers in retirement planning
Opportunities in P&C |
 15
Individual Client Group
A leader in serving
high net worth individuals
Independent life insurance
Investment advisory
Clarification related to the two-year estate tax resolution
announced in December 2010
Solid performance continued in investment advisory |
 16
Advisor Services Group
Serves independent financial advisors
Broker-dealer
Corporate registered investment advisor
Assets under management $9.3 billion, up 18.6% YOY
Growth drivers
New assets
Advisor recruitment
Asset-based fees (due to broader financial market performance)
|
 DONNA BLANK
Chief Financial Officer |
 18
4Q10 Consolidated Financial Highlights
Revenue
Adjusted EBITDA & Margin
$17.8
$20.3
$7.8
$12.6
$1.3
$3.3
4Q09
4Q10
$26.9
$36.1
Individual Client Group
Corporate Client Group
Advisor Services Group
$47.8
$58.9
$3.5
$0.2
$5.7
$0.1
4Q09
4Q10
$277.2
$284.3
ICG
Dispositions
CCG
Dispositions
$122.4
$107.0
($ in millions)
1
The sum of the components may not agree to total due to rounding.
Adjusted EBITDA Margin
4Q09
4Q10
Corporate Client Group
16.6%
18.7%
Individual Client Group
6.4%
10.8%
Advisor Services Group
2.7%
5.5%
Consolidated
9.7%
12.7%
1
54%
53%
Recurring
Revenue
$116.9
$108.5
Revenue growth of 2.6% driven by CCG and ASG |
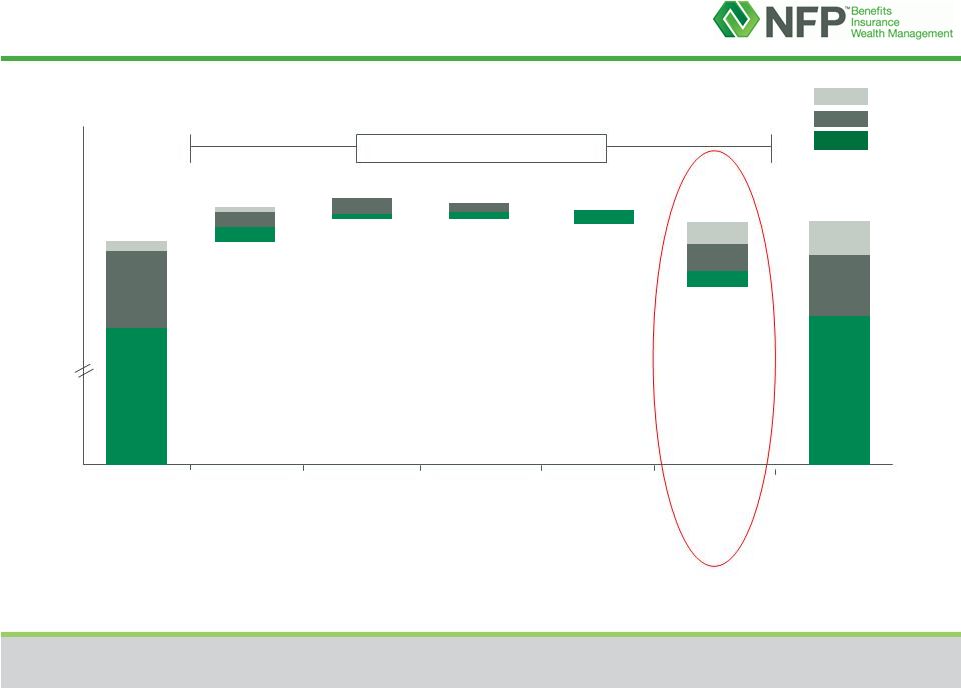 19
$(1.5)
2009-2010 Adjusted EBITDA Drivers
($ in millions)
ASG
ICG
CCG
2009
Adjusted
EBITDA
HQ Sublease
Cost
(recognized 2009)
PIP Expense
(lower expense
recognized in 2010)
Stock-Based
Comp in
Mgmt Fees
(which does not
include impact of
RSU acceleration)
(higher expense
recognized in 2010)
Underlying
Segment
Performance
(in 2010)
2010
Adjusted
EBITDA
$66.8
$40.3
$3.2
$4.8
$4.0
$0.2
$3.9
$0.1
$(1.2)
$(10.7)
$72.0
$36.0
$8.8
$3.4
$5.4
$110.3
$116.8
CCG Sublet
(expense
recognized in 2010)
$(1.9)
Year over Year Change |
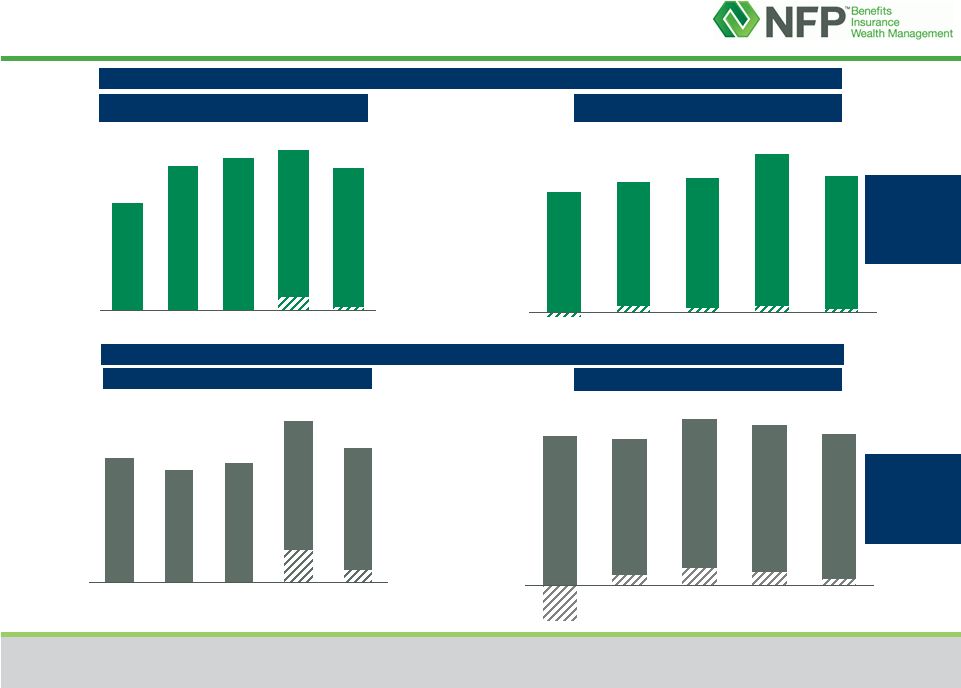 20
53.8%
2.5%
5.3%
6.7%
3.8%
-13.8%
59.0%
57.9%
57.3%
58.7%
38.0%
39.0%
42.0%
1.2%
2.0%
1.4%
2.2%
-1.2%
41.3%
48.0%
1Q10
2Q10
3Q10
4Q10
YTD10
PIP
1.3%
4.0%
41.1%
43.7%
42.8%
45.3%
32.1%
1Q09
2Q09
3Q09
4Q09
YTD09
Management
Fees
(excl.
accelerated
vesting
of
RSUs)
as % of Adjusted Income Before Management Fees
2009
2010
2010
2009
PIP
PIP
Corporate Client Group
Individual Client Group
36.8%
41.2%
43.2%
44.9%
57.6%
59.8%
PIP
PIP
42.7%
65.7%
PIP
1Q10
2Q10
3Q10
YTD10
PIP
5.4%
14.3%
53.8%
56.6%
52.6%
49.5%
55.0%
1Q09
2Q09
3Q09
4Q09
YTD09
PIP
PIP
50.0%
PIP
63.2%
PIP
4Q10
PIP
PIP
47.7%
42.4%
70.9%
59.2%
NFP’s CCG
priority
interest
60.6% as of
12/31/10
NFP’s ICG
priority
interest
47.2% of
12/31/10 |
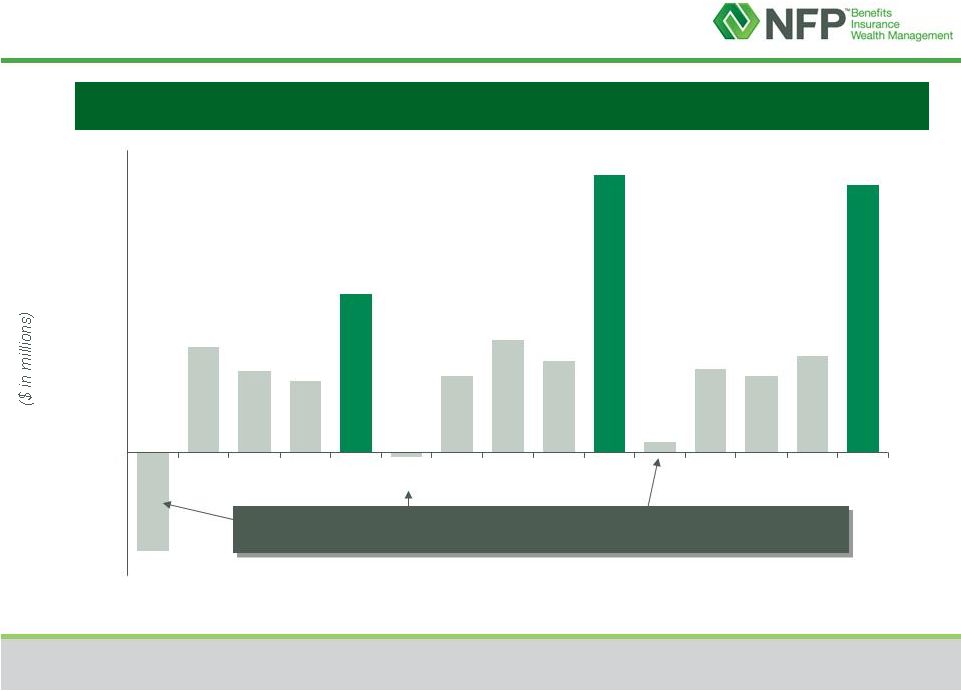 21
Quarterly/Annual Operating Cash Flow
Quarterly/Annual Operating Cash Flow
In Q1, larger payments to Principals typically occur as management fee
bonuses for prior year performance are paid
Operating Cash Flow
(1)
Q1 2008 and 12/31/08 YTD acquisitions include $14.4 mm paid in connection with an
acquisition which was treated as prepaid management fees. (2)
Sum of the quarters may not agree to the full year total due to rounding.
(1)
(2)
$119
$43
$37
$5
$124
$41
-$2
$71
$32
$36
$47
-$44
($55)
($10)
$35
$80
$125
Q1'08
Q2'08
Q3'08
Q4'08
FY'08
Q1'09
Q2'09
Q3'09
Q4'09
FY'09
Q1'10
Q2'10
Q3'10
Q4'10
FY'10
$34
$34
(1)
$50 |