Attached files
| file | filename |
|---|---|
| 8-K - FORM 8-K - SOUTHERN Co GAS | form8_k.htm |
| EX-99.1 - EXHIBIT 99.1 - SOUTHERN Co GAS | exhibit_99-1.htm |
Exhibit 99.2

4Q and Year-End 2010 Earnings Presentation
February 9, 2011
TM

2
Forward-Looking Statements &
Supplemental Information
Supplemental Information
Forward-Looking Statements
Certain expectations and projections regarding our future performance referenced in this presentation, in other reports or statements we file with the SEC or otherwise release to the
public, and on our website, are forward-looking statements. Senior officers and other employees may also make verbal statements to analysts, investors, regulators, the media and
others that are forward-looking. Forward-looking statements involve matters that are not historical facts, such as statements regarding our future operations, prospects, strategies,
financial condition, economic performance (including growth and earnings), industry conditions and demand for our products and services. Because these statements involve
anticipated events or conditions, forward-looking statements often include words such as "anticipate," "assume," "believe," "can," "could," "estimate," "expect," "forecast," "future,"
"goal," "indicate," "intend," "may," "outlook," "plan," "potential," "predict," "project," "seek," "should," "target," "would," or similar expressions. Forward-looking statements contained in
this presentation include, without limitation, statements regarding future earnings per share, dividend growth and EBIT contribution, our priorities for 2011, the proposed merger with
Nicor Inc. and our position as we enter 2011. Our expectations are not guarantees and are based on currently available competitive, financial and economic data along with our
operating plans. While we believe our expectations are reasonable in view of the currently available information, our expectations are subject to future events, risks and uncertainties,
and there are several factors - many beyond our control - that could cause results to differ significantly from our expectations.
Such events, risks and uncertainties include, but are not limited to, changes in price, supply and demand for natural gas and related products; the impact of changes in state and
federal legislation and regulation including changes related to climate change; actions taken by government agencies on rates and other matters; concentration of credit risk; utility
and energy industry consolidation; the impact on cost and timeliness of construction projects by government and other approvals, development project delays, adequacy of supply of
diversified vendors, unexpected change in project costs, including the cost of funds to finance these projects; the impact of acquisitions and divestitures; direct or indirect effects on
our business, financial condition or liquidity resulting from a change in our credit ratings or the credit ratings of our counterparties or competitors; interest rate fluctuations; financial
market conditions, including recent disruptions in the capital markets and lending environment and the current economic downturn; general economic conditions; uncertainties about
environmental issues and the related impact of such issues; the impact of changes in weather, including climate change, on the temperature-sensitive portions of our business; the
impact of natural disasters such as hurricanes on the supply and price of natural gas; acts of war or terrorism; and other factors which are provided in detail in our filings with the
Securities and Exchange Commission. Forward-looking statements are only as of the date they are made, and we do not undertake to update these statements to reflect subsequent
changes.
Supplemental Information
Company management evaluates segment financial performance based on earnings before interest and taxes (EBIT), which includes the effects of corporate expense allocations and
on operating margin. EBIT is a non-GAAP (accounting principles generally accepted in the United States of America) financial measure that includes operating income, other income
and expenses. Items that are not included in EBIT are financing costs, including debt and interest expense and income taxes. The company evaluates each of these items on a
consolidated level and believes EBIT is a useful measurement of our performance because it provides information that can be used to evaluate the effectiveness of our businesses
from an operational perspective, exclusive of the costs to finance those activities and exclusive of income taxes, neither of which is directly relevant to the efficiency of those
operations. Operating margin is a non-GAAP measure calculated as operating revenues minus cost of gas, excluding operation and maintenance expense, depreciation and
amortization, and taxes other than income taxes. These items are included in the company's calculation of operating income. The company believes operating margin is a better
indicator than operating revenues of the contribution resulting from customer growth, since cost of gas is generally passed directly through to customers. EBIT and operating margin
should not be considered as alternatives to, or more meaningful indicators of, the company's operating performance than operating income or net income attributable to AGL
Resources Inc. as determined in accordance with GAAP. In addition, the company's EBIT and operating margin may not be comparable to similarly titled measures of another
company. We also present certain non-GAAP financial measures excluding the effects of our proposed merger with Nicor. Because we complete material mergers and acquisitions
only occasionally, we believe excluding these effects from certain measures is useful because they allow investors to more easily evaluate and compare the performance of the
Company's core businesses from period to period. Reconciliations of non-GAAP financial measures referenced in this presentation are available on the company’s Web site at
www.aglresources.com
4Q and 2010 Highlights
• Record GAAP EPS of $3.00 per diluted
share for 2010
share for 2010
• Adjusted EPS of $3.05, excluding approximately
$4 million in after-tax costs related to Nicor
merger
$4 million in after-tax costs related to Nicor
merger
• 5% increase in operating income
• Solid results across business segments,
excluding sale of AGL Networks
excluding sale of AGL Networks
• Effective expense management
• 4Q10 GAAP EPS of $0.81 per diluted
share
share
• Adjusted diluted EPS of $0.86, excluding Nicor
merger-related costs
merger-related costs
• Cold weather in 4Q10 drove solid results
• Dividend increase of 2% in 2010
• Board of Directors approved $0.04 increase for
2011
2011
• Solid balance sheet
3
Note: Please review the AGL Resources 10-K as filed with the SEC on 2/9/11 for detailed information. EBIT, Adjusted Net Income and Adjusted EPS are non-
GAAP measures. Please see the appendix to this presentation or visit the investor relations section of www.aglresources.com for a reconciliation to GAAP.
GAAP measures. Please see the appendix to this presentation or visit the investor relations section of www.aglresources.com for a reconciliation to GAAP.
(1) Adjusted net income and adjusted EPS exclude Nicor-related merger costs of approximately $4 million, net of tax.
4
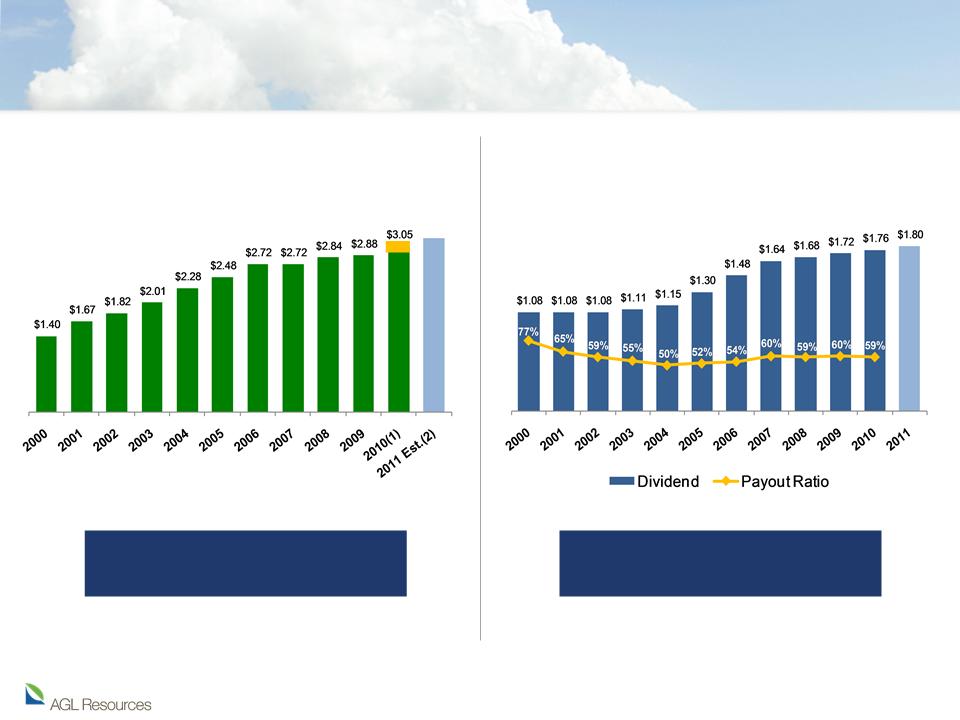
Consistent EPS and Dividend Growth
Diluted EPS Growth
Dividend Growth
2011 EPS Guidance:
$3.10-$3.20 per diluted share
Dividend increase of $0.04 approved by
Board of Directors for 2011
Board of Directors for 2011
(1)$3.00 diluted GAAP EPS; $3.05 adjusted, excluding Nicor merger costs. Please see the appendix to this presentation or visit the investor relations section of
www.aglresources.com for a reconciliation to GAAP.
www.aglresources.com for a reconciliation to GAAP.
(2) Estimate excludes Nicor-related merger costs.
$3.10-
$3.20

5
5
EBIT by Operating Segment
1%
69%
10%
20%
Historical EBIT by Operating Segment
2010 EBIT Contribution
NOTE: EBIT is a non-GAAP measure. Please see the appendix to this presentation or the investor relations section of www.aglresources.com for a reconciliation to GAAP.
(1) AGL Resources sold AGL Networks in July 2010.
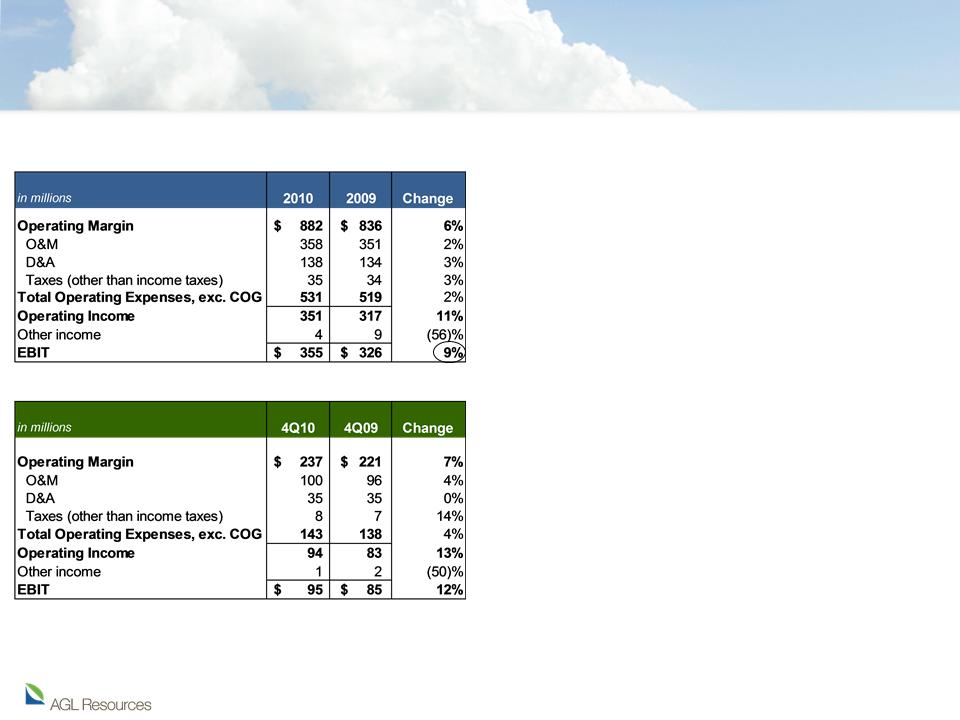
• 2010 EBIT increased 9%; key drivers
include:
include:
• Magnolia and Hampton Roads Crossing pipelines
added $27 million
added $27 million
• New rates and regulatory infrastructure programs
at Atlanta Gas Light and Elizabethtown Gas
added $15 million
at Atlanta Gas Light and Elizabethtown Gas
added $15 million
• Effective O&M expense management
• 4Q10 EBIT up 12% with similar drivers
as full year
as full year
• 2010 cap ex of $357 million vs. $354
million in 2009
million in 2009
• Customer count stable
• 2.263 million customers in 2010 vs.
2.266 million in 2009
2.266 million in 2009
• Virginia Natural Gas rate case filed
2/8/11
2/8/11
6
6
Distribution
NOTE: COG = Cost of Gas
7
7
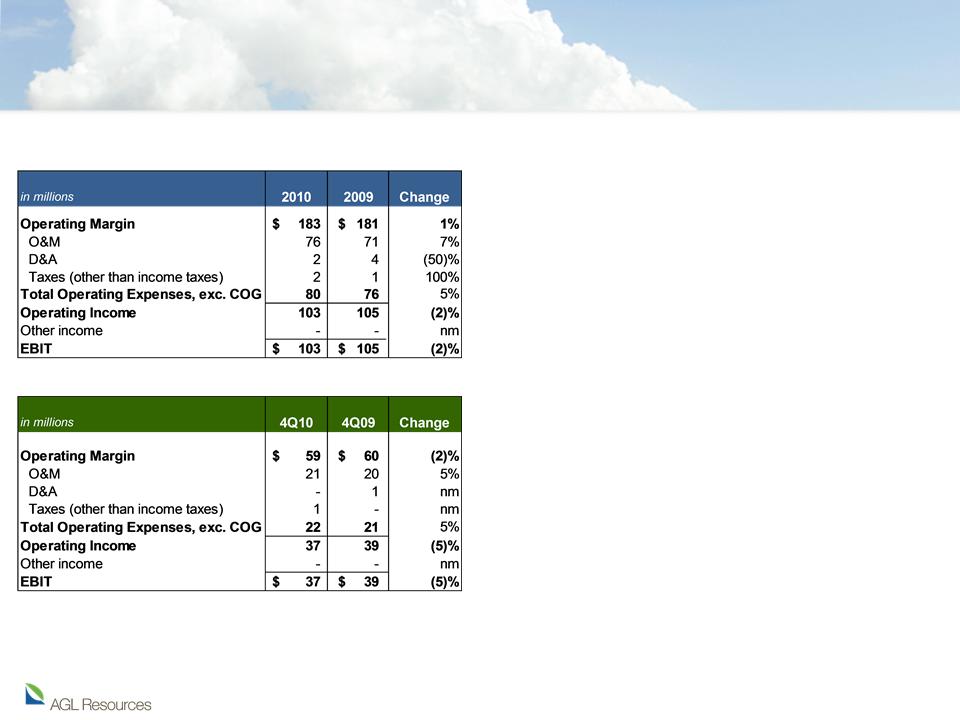
Retail
• 2010 EBIT down 2%; key drivers include:
• Migration of additional customers to lower-margin
fixed price plans
fixed price plans
• Higher expenses due to marketing and legal costs
• Offset by increased customer usage due to colder
weather in 1Q and 4Q
weather in 1Q and 4Q
• Net income attributable to AGL Resources
up by $11 million vs. 2009 due to
increased stake in SouthStar
up by $11 million vs. 2009 due to
increased stake in SouthStar
• 4Q10 EBIT down 5% with similar drivers as
full year
full year
• Market share and customer count:
• Georgia market share remains 33%
• Georgia customer count 496K in 2010 vs. 504K in
2009
2009
• Continue to explore opportunities to
expand service offerings and customer
base across multiple states
expand service offerings and customer
base across multiple states
8
8
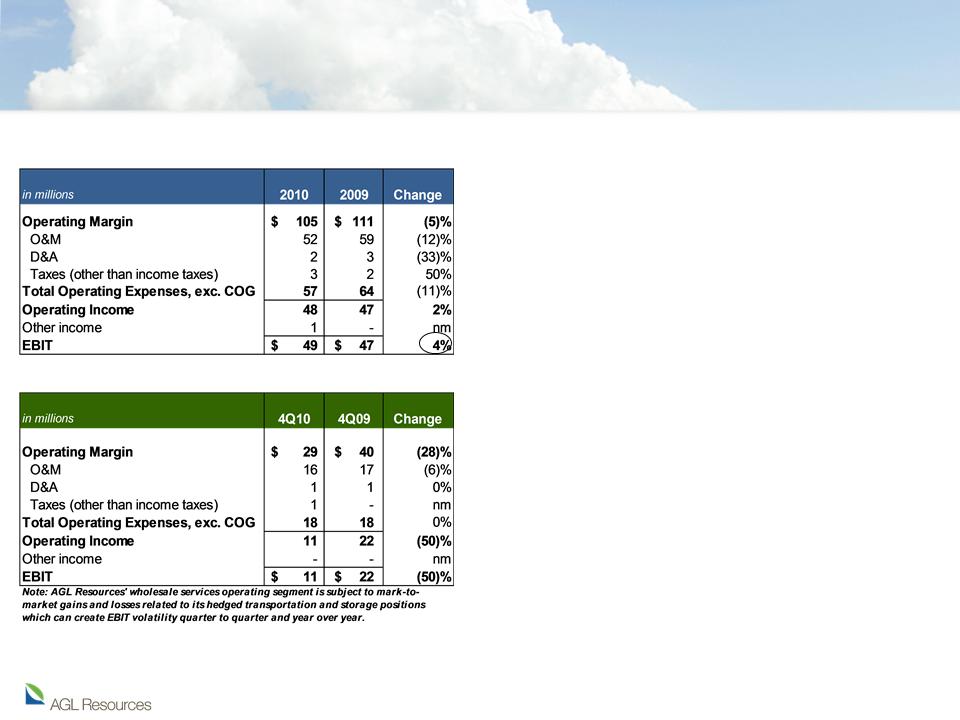
Wholesale
• Annual EBIT up 4%
• Unusually cold weather in 1Q and 4Q created asset
optimization opportunities for Sequent
optimization opportunities for Sequent
• Effective expense management
• Mark-to-market (MTM) gains on hedges in 2010 of $30
million; $14 million lower than MTM gains in 2009
million; $14 million lower than MTM gains in 2009
• 4Q10 EBIT $11 million
• Cold December weather allowed Sequent to generate
approximately 25% of its full year 2010 operating margin
during 4Q
approximately 25% of its full year 2010 operating margin
during 4Q
• $3 million in MTM losses in 4Q10 vs. $9 million in MTM
gains in 4Q09 primary contributor to y/y decline
gains in 4Q09 primary contributor to y/y decline
• Sequent storage rollout schedule for 2011
strong with $16 million in economic value
locked-in
strong with $16 million in economic value
locked-in
• Five year average of $15 million locked-in at start of year
• Results and timing can change based on market
conditions
conditions
• Increasing focus on fixed fee services
• Building sources of operating margin less impacted by
volatility in the marketplace
volatility in the marketplace
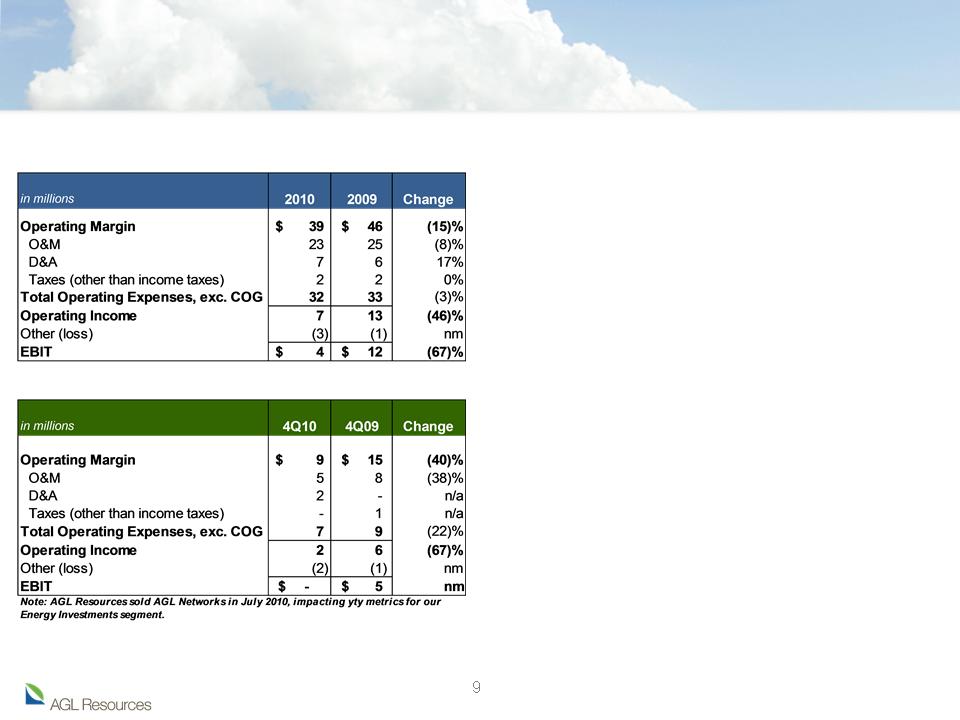
Energy Investments
• 2010 EBIT of $4 million
• Reduced EBIT primarily impacted by sale of AGL
Networks; AGL Networks EBIT contribution in 2009
$8 million vs. $3 million in 2010
Networks; AGL Networks EBIT contribution in 2009
$8 million vs. $3 million in 2010
• Golden Triangle Storage Cavern 1
operational
operational
• 2 Bcf contracted
• Remaining 4 Bcf expected to be available in April
• Storage values remain depressed due to high supply
of natural gas and reduced demand
of natural gas and reduced demand
• Golden Triangle Storage Cavern 2
construction ongoing
construction ongoing
• Expect completion early 2012
• Capex for 2011 expected to be approximately $37
million
million
• Construction costs for the entire GTS project
(Caverns 1 and 2) are estimated to be $325 million
(Caverns 1 and 2) are estimated to be $325 million
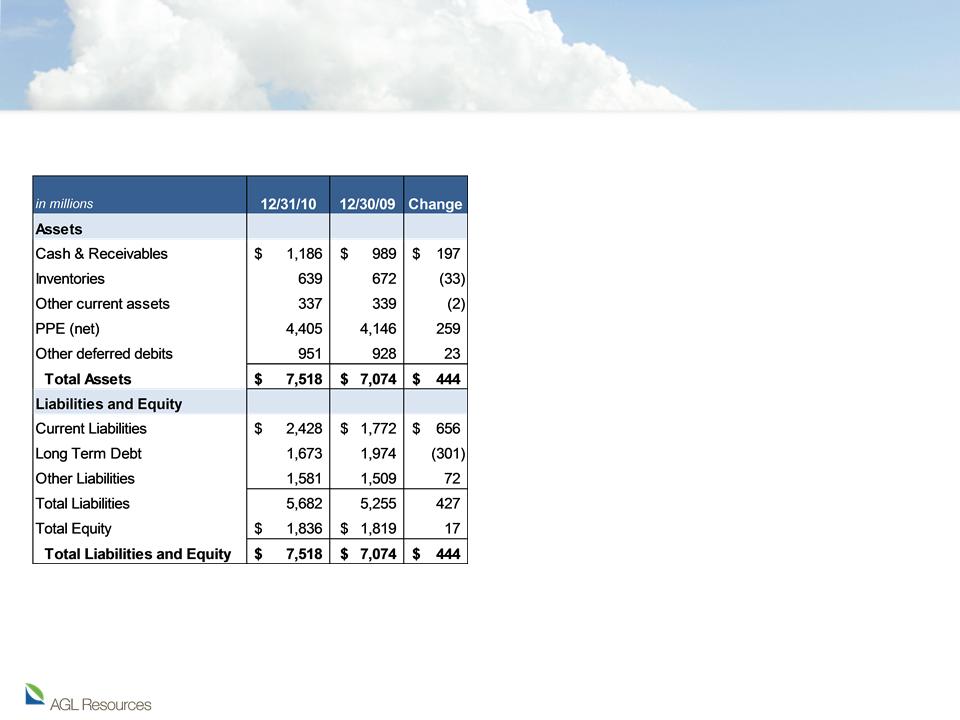
Balance Sheet Highlights
10
• Solid balance sheet with significant opportunity
to fund growth capital requirements
to fund growth capital requirements
• $1.2 billion refinanced in 2010
• $1.05 billion bridge facility in place related to Nicor merger
• Good access to capital markets
• Company credit metrics support solid, investment-grade
ratings
ratings
• $2.7 billion debt outstanding
• Long-term debt $1.67 billion
• Short-term debt of $732 million
• $300 million of senior notes with January 2011 expiration
included in current liabilities
included in current liabilities
• Debt to Cap Ratio: 60%
• 2010 total capital expenditures $510 million
• 70% at distribution operating companies
• 25% at energy investments
• 5% at retail, wholesale and corporate combined
• 2011 cap ex estimated at $440 million

11
11
2011 Guidance
• AGL Resources expects diluted EPS to be in the range of $3.10-$3.20 for
2011, excluding mark-to-market impacts and impacts from Nicor merger-
related costs
2011, excluding mark-to-market impacts and impacts from Nicor merger-
related costs
• Key assumptions include:
• Normal weather
• Average volatility in natural gas prices
• Successful implementation of new regulatory infrastructure and rate programs
• Immaterial impact from Virginia Natural Gas rate case
• Average diluted shares outstanding of 78.5 million
• Effective tax rate of 37.8%

12
12
2010 Operational Highlights
• Maintained focus on safety as top priority
• Top quartile of American Gas Association’s occupational safety ratings for 4th straight
year
year
• Rate cases completed at Atlanta Gas Light and Chattanooga Gas
• Overall favorable annual impact from AGL case: $27 million
• Overall favorable annual impact from Chattanooga case: $3 million
• Retail and wholesale businesses performed well, despite extraordinarily low
natural gas price volatility and storage spreads
natural gas price volatility and storage spreads
• SouthStar maintained ~33% market share in Georgia
• Sequent daily physical gas sales increased 54% to 4.57 Bcf/day in 2010
• Golden Triangle Storage Cavern 1 operational with 2 Bcf under contract
• Clean energy ventures underway
• Entered into joint-venture with El Paso in July 2010 to distribute liquefied natural gas
across the southeastern United States to the heavy-duty transportation market
across the southeastern United States to the heavy-duty transportation market

13
13
2011 Priorities
• Close Nicor transaction in second half of 2011
• Develop and implement integration plan
• Continue safe and efficient operations at our distribution businesses
• Complete rate case at Virginia Natural Gas
• Seeking $25 million increase; mitigation plan proposes rates to be phased in over three years
• VNG customers have not seen an increase in their approved base rates since 1996
• Continue to pursue responsible growth opportunities in retail and wholesale
businesses
businesses
M&A
Distribution
Retail &
Wholesale
Wholesale
Energy
Investments
Investments
Policy
Expense &
Balance Sheet
Discipline
Balance Sheet
Discipline
• Increase contracted capacity at Golden Triangle Storage
• Effectively control expenses and focus on capital discipline in each of our
business segments
business segments
• Maintain strong balance sheet and liquidity profile
• Continue to actively manage issues related to energy and environmental
policy and regulation
policy and regulation

14
14
Nicor Merger Update
• Regulatory approval process underway
• Merger approval request filed with Illinois Commerce Commission 1/18/11; requesting
expedited approval by 10/1/11
expedited approval by 10/1/11
• Registration statement filed with SEC 2/4/11
• Transition committee established and active
• Continue to anticipate closing in 2H11
Dec 2010
Q1 2011
Q2 2011
Q3 2011
Q4 2011
Transaction
Announced
Joint ICC Approval
Request Filed 1/18/11
Secure Regulatory Approvals
AGL Resources and
Nicor Shareholder
Meetings
Develop Transition Implementation Plans
Close Transaction
Long
-
Term Financing for Cash
Consideration
S-4 Registration
Statement Filed 2/4/11
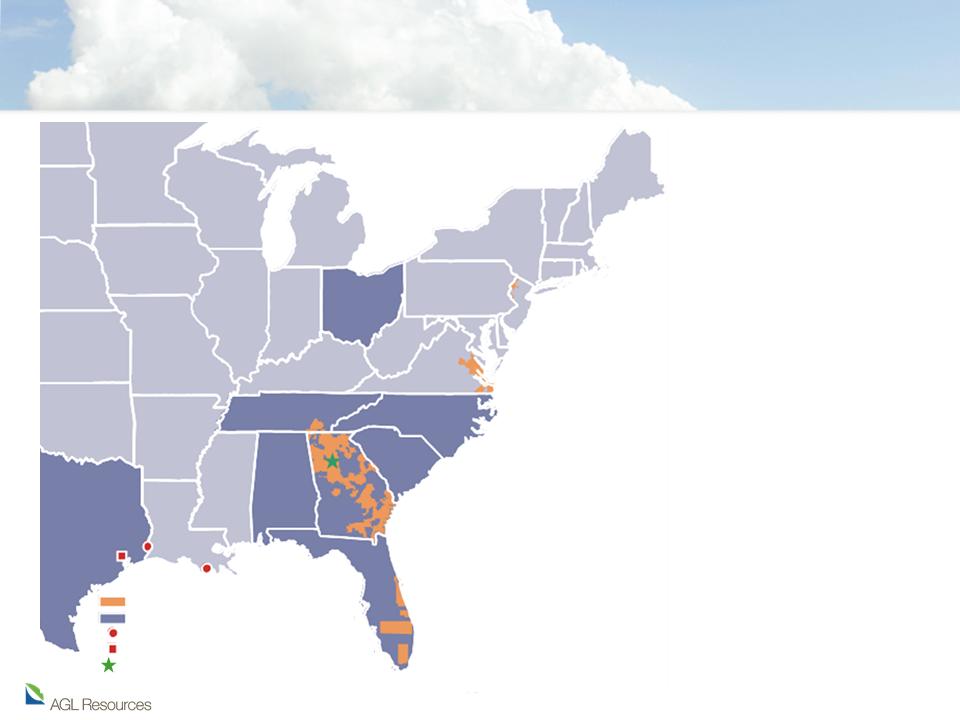
Well-Positioned for Strong 2011
Distribution service territory
Retail service territory
Non-Utility storage facilities
Wholesale headquarters
Corporate headquarters
• Economic recovery and
environmental benefits of
domestic resource make natural
gas an attractive energy choice
environmental benefits of
domestic resource make natural
gas an attractive energy choice
• Diversified business with
distribution, retail, wholesale and
storage assets well-positioned to
take advantage of long-term
trends
distribution, retail, wholesale and
storage assets well-positioned to
take advantage of long-term
trends
• 2011 transformational year for
AGL Resources
AGL Resources
• Nicor transaction would effectively
double size of company
double size of company
• Expected to be largest LDC in U.S.
by number of customers
by number of customers
• Diversifies both regulated and non-
utility businesses
utility businesses

Additional Resources
16
Company resources
• www.aglresources.com
• Sarah Stashak
Director, Investor Relations
404-584-4577
sstashak@aglresources.com
Industry resources
• www.aga.org
• www.eia.doe.gov

Appendix & GAAP Reconciliations

Detailed Utility Profile
18
|
State
|
Rate
Base (mm)
|
% of
Total |
Authorized
Return on Rate Base |
Est. 2010
Return on Rate Base |
Authorized
Return on Equity |
Est. 2011
Return on Equity |
Customers
(mm) |
% of
Total |
Regulatory Attributes
|
|
|
|
|
|
|
|
|
|
|
|
|
|
|
|
|
|
|
|
|
|
|
|
Georgia
|
$1,312
|
52%
|
8.10%
|
7.26%
|
10.75%
|
9.10%
|
1.5
|
68%
|
Decoupling, Regulatory
Infrastructure Program Rates, M&A Synergy Sharing |
|
New Jersey
|
435
|
17%
|
7.64%
|
7.87%
|
10.30%
|
10.76%
|
0.3
|
12%
|
Weather Normalization,
Regulatory Infrastructure Program Rates |
|
Virginia
|
502
|
20%
|
9.24%
|
8.24%
|
10.90%
|
9.62%
|
0.3
|
12%
|
Decoupling, Weather
Normalization |
|
Florida
|
164
|
7%
|
7.36%
|
5.04%
|
11.25%
|
6.22%
|
0.1
|
5%
|
Negotiated Rates Over
5-yr Period |
|
Tennessee
|
91
|
4%
|
7.41%
|
8.98%
|
10.05%
|
13.45%
|
0.1
|
3%
|
Revenue Normalization
|
|
Total
|
$ 2,504
|
100%
|
NA
|
NA
|
NA
|
NA
|
2.3
|
100%
|
|
Note: Please review the AGL Resources 10-K as filed with the SEC on 2/9/11 for detailed information.
19
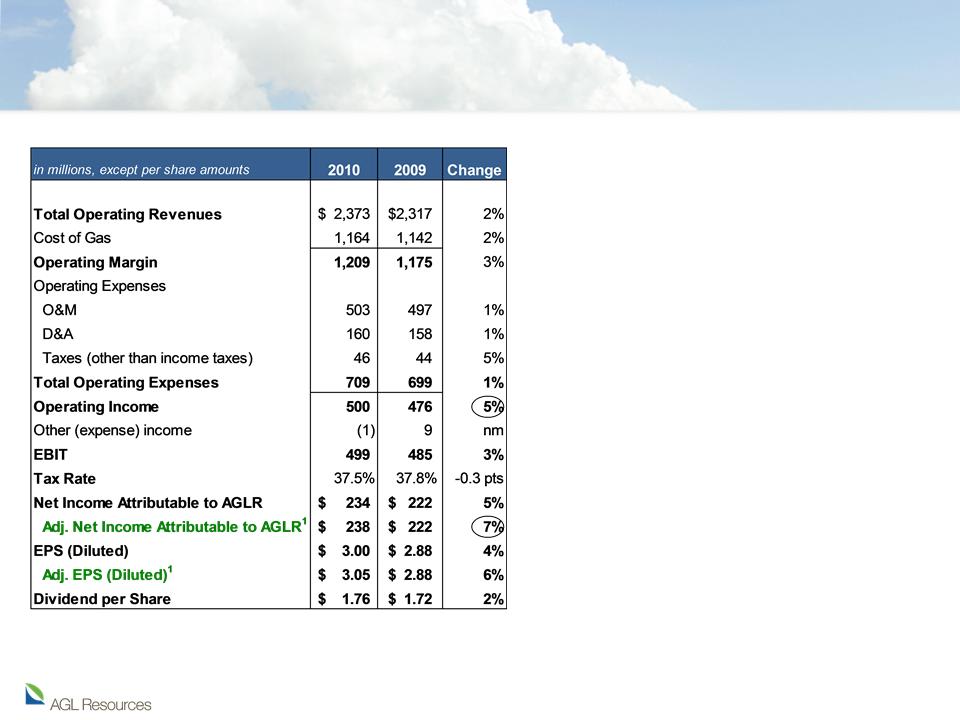
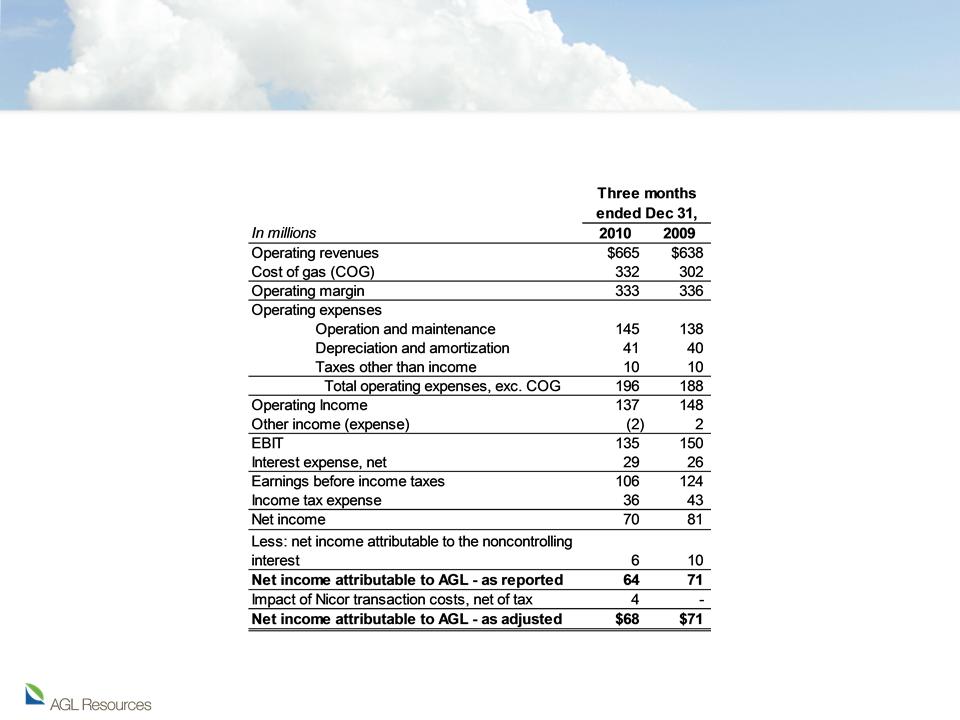
The following table set forth a reconciliation of AGL Resources’ operating margin to operating income and earnings before interest and taxes (EBIT) to earnings
before income taxes to net income to net income attributable to AGL - as reported and net income attributable to AGL - as adjusted, for the three months ended
December 31, 2010 and 2009.
before income taxes to net income to net income attributable to AGL - as reported and net income attributable to AGL - as adjusted, for the three months ended
December 31, 2010 and 2009.
GAAP Reconciliation
20
GAAP Reconciliation
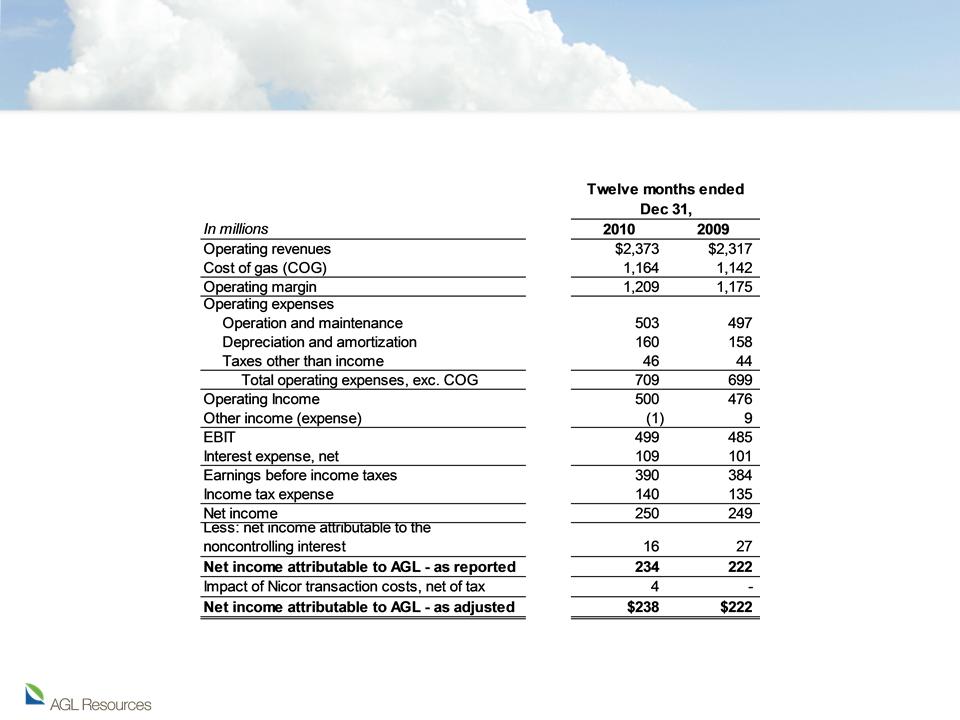
The following table set forth a reconciliation of AGL Resources’ operating margin to operating income and earnings before interest and taxes (EBIT) to earnings
before income taxes to net income to net income attributable to AGL - as reported and net income attributable to AGL - as adjusted, for the twelve months
ended December 31, 2010 and 2009.
before income taxes to net income to net income attributable to AGL - as reported and net income attributable to AGL - as adjusted, for the twelve months
ended December 31, 2010 and 2009.
21
GAAP Reconciliation
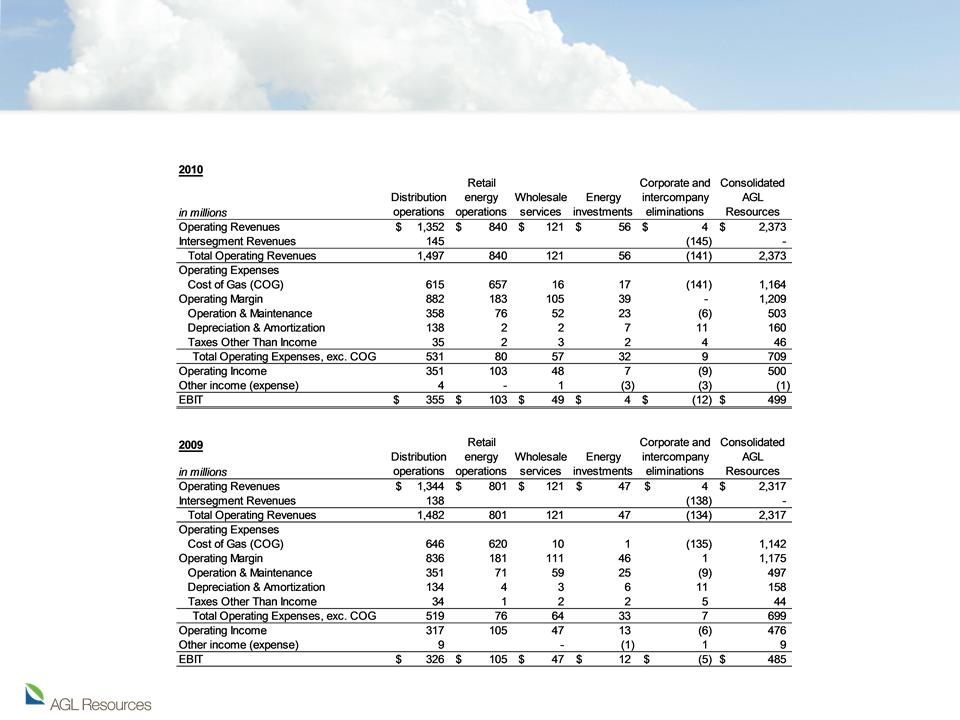
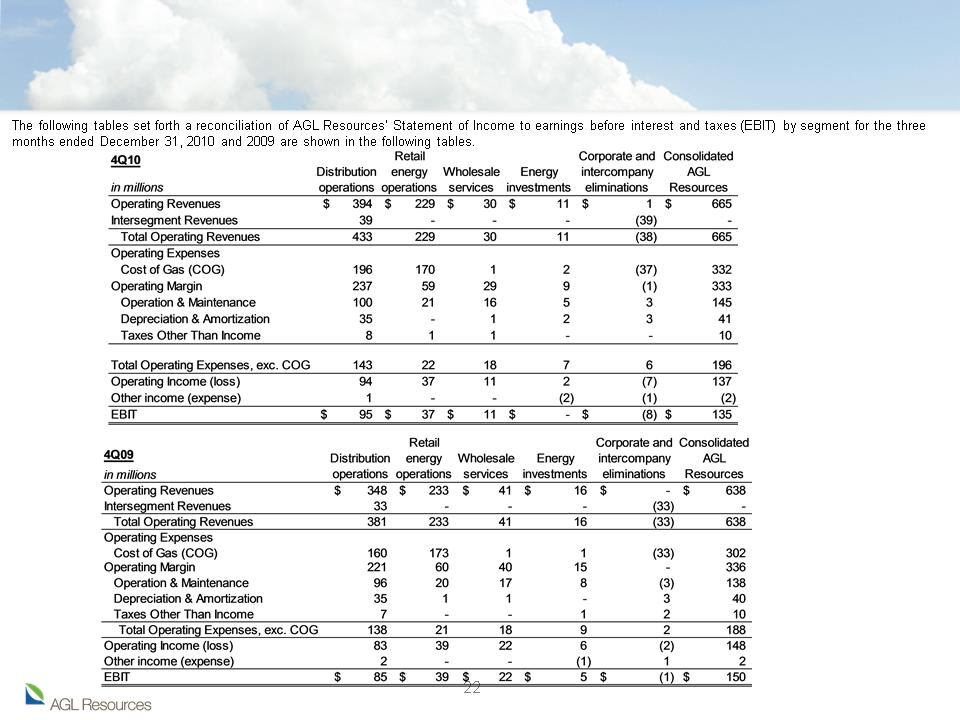
The following tables set forth a reconciliation of AGL Resources’ Statement of Income to earnings before interest and taxes (EBIT) by segment for the
years ended December 31, 2010 and 2009 are shown in the following tables.
years ended December 31, 2010 and 2009 are shown in the following tables.
GAAP Reconciliation
23
GAAP Reconciliation
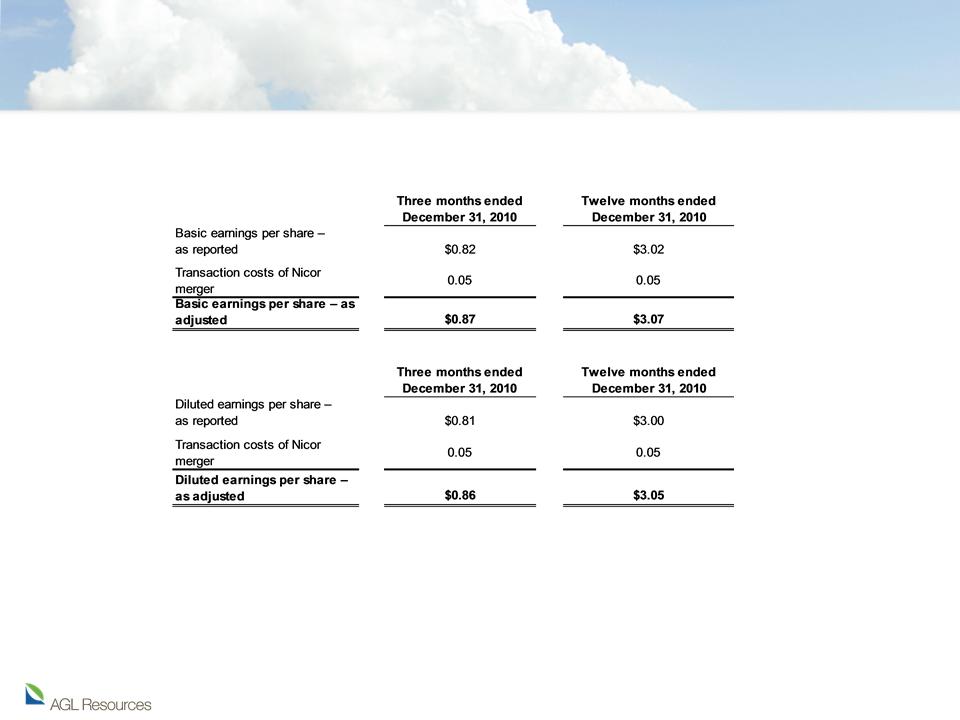
The following tables set forth a reconciliation of AGL Resources’ Basic and Diluted earnings per share - as reported (GAAP) to Basic and Diluted earnings
per share - as adjusted (Non-GAAP; excluding Nicor merger costs), for the indicated periods.
per share - as adjusted (Non-GAAP; excluding Nicor merger costs), for the indicated periods.

24
GAAP Reconciliation
A reconciliation of operating margin and EBIT by segment is available in our quarterly reports (Form 10-Q) and annual reports (Form 10-K) filed with the
Securities and Exchange Commission.
Securities and Exchange Commission.
Our management evaluates segment financial performance based on EBIT, which includes the effects of corporate expense allocations. EBIT is a non-
GAAP (accounting principles generally accepted in the United States of America) financial measure. Items that are not included in EBIT are financing
costs, including debt and interest expense and income taxes. We evaluate each of these items on a consolidated level and believe EBIT is a useful
measurement of our performance because it provides information that can be used to evaluate the effectiveness of our businesses from an operational
perspective, exclusive of the costs to finance those activities and exclusive of income taxes, neither of which is directly relevant to the efficiency of those
operations.
We also use EBIT internally to measure performance against budget and in reports for management and the Board of Directors. Projections of forward-
looking EBIT are used in our internal budgeting process, and those projections are used in providing forward-looking business segment EBIT projections
to investors. We are unable to reconcile our forward-looking EBIT business segment guidance to GAAP net income, because we do not predict the
future impact of unusual items and mark-to-market gains or losses on energy contracts. The impact of these items could be material to our operating
results reported in accordance with GAAP.
Operating margin is a non-GAAP measure calculated as revenues minus cost of gas, excluding operation and maintenance expense, depreciation and
amortization, taxes other than income taxes, and the gain or loss on the sale of our assets. These items are included in our calculation of operating
income. We believe operating margin is a better indicator than operating revenues of the contribution resulting from customer growth, since cost of gas is
generally passed directly through to customers.
EBIT and operating margin should not be considered as alternatives to, or more meaningful indicators of, our operating performance than operating
income or net income, as determined in accordance with GAAP. In addition, our EBIT or operating margin may not be comparable to similarly titled
measures of another company.
income or net income, as determined in accordance with GAAP. In addition, our EBIT or operating margin may not be comparable to similarly titled
measures of another company.
Net income attributable to AGL Resources, as adjusted and Basic and Diluted earnings per share, as adjusted are non-GAAP measures and exclude
transaction costs related to the Nicor Merger. We believe these financial measures are useful to investors because they provide an alternative method
for assessing the Company’s operating results in a manner that is focused on the performance of the Company’s ongoing operations. The presentation
of these financial measures is not meant to be a substitute for financial measures prepared in accordance with GAAP.