| SECURITIES AND EXCHANGE COMMISSION |
| Washington, D.C. 20549 |
| _______________________ |
| FORM 8-K |
| CURRENT REPORT |
| Pursuant to Section 13 or 15(d) of the |
| Securities Exchange Act of 1934 |
| Date of Report: February 7, 2011 |
| (Date of earliest event reported) |
| PRINCIPAL FINANCIAL GROUP, INC. |
| (Exact name of registrant as specified in its charter) |
| Delaware | 1-16725 42-1520346 | |
| (State or other jurisdiction | (Commission file number) (I.R.S. Employer | |
| of incorporation) | Identification Number) | |
| 711 High Street, Des Moines, Iowa 50392 | ||
| (Address of principal executive offices) | ||
| (515) 247-5111 | ||
| (Registrant’s telephone number, including area code) | ||
| Check the appropriate box below if the Form 8-K filing is intended to simultaneously satisfy the filing obligation of the | |
| registrant under any of the following provisions: | |
| [ ] | Written communications pursuant to Rule 425 under the Securities Act (17 CFR 230.425) |
| [ ] | Soliciting material pursuant to Rule 14a-12 under the Exchange Act (17 CFR 240.14a-12) |
| [ ] | Pre-commencement communications pursuant to Rule 14d-2(b) under the Exchange Act (17 CFR |
| 240.14d-2(b)) | |
| [ ] | Pre-commencement communications pursuant to Rule 13e-4(c) under the Exchange Act (17 CFR |
| 240.13e-4(c)) | |
| _______________________ | |
| Page 2 | |
| Item 2.02. Results of Operations and Financial Condition | |
| On February 7, 2011, Principal Financial Group, Inc. publicly announced information regarding its | |
| results of operations and financial condition for the quarter ended December 31, 2010. The text of | |
| the announcement is included herewith as Exhibit 99. | |
| Item 9.01 Financial Statements and Exhibits | |
| 99 Fourth Quarter 2010 Earnings Release | |
| SIGNATURE | |
| Pursuant to the requirements of the Securities Exchange Act of 1934, the registrant has duly | |
| caused this report to be signed on its behalf by the undersigned thereunto duly authorized. | |
| PRINCIPAL FINANCIAL GROUP, INC. | |
| By: /s/ Terrance J. Lillis | |
| Name: Terrance J. Lillis | |
| Title: Senior Vice President and Chief Financial | |
| Officer | |
| Date: February 8, 2011 | |
| Page 3 | |||
| EXHIBIT 99 | |||
| RELEASE: | On receipt February 2011 | ||
| MEDIA CONTACT: Susan Houser, 515-248-2268, houser.susan@principal.com | |||
| INVESTOR CONTACT: John Egan 515-235-9500, egan.john@principal.com | |||
| Principal Financial Group, Inc. Announces Full Year | |||
| and Fourth Quarter 2010 Results | |||
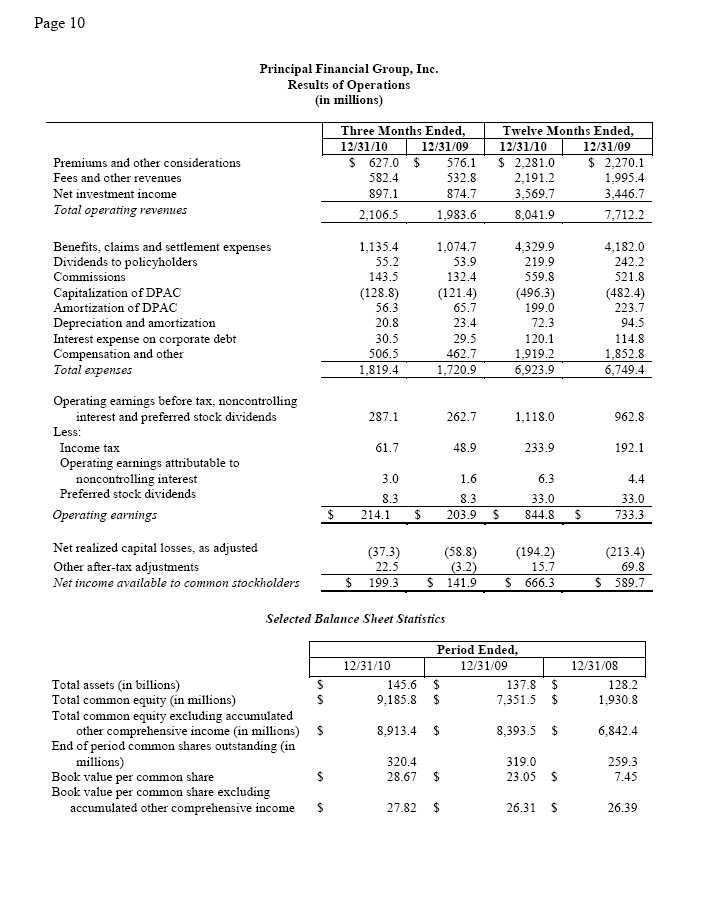
- Full-year 2010 operating earnings1 of $844.8 million, an increase of 15 percent over 2009; net income available to common stockholders of $666.3 million, an increase of 13 percent over 2009.
- Fourth quarter 2010 operating earnings of $214.1 million, an increase of 5 percent over fourth quarter 2009; net income available to common stockholders of $199.3 million, an increase of 40 percent over fourth quarter 2009.
- Year-end 2010 record assets under management of $318.8 billion, an increase of 12 percent compared to year-end 2009.
| (Des Moines, Iowa) – Principal Financial Group, Inc. (NYSE: PFG) today announced results for full-year and |
| fourth quarter 2010. The company reported operating earnings of $844.8 million for the twelve months ended |
| Dec. 31, 2010, compared to $733.3 million for the twelve months ended Dec. 31, 2009. Operating earnings per |
| diluted share (EPS) were $2.62 for the twelve months ended Dec. 31, 2010, compared to $2.45 for the twelve |
| months ended Dec. 31, 2009. The company reported net income available to common stockholders of $666.3 |
| million, or $2.06 per diluted share for the twelve months ended Dec. 31, 2010, compared to $589.7 million, or |
| $1.97 per diluted share for the twelve months ended Dec. 31, 2009. Operating revenues for the year 2010 were |
| $8,041.9 million compared to $7,712.2 million for the same period last year. |
| The company reported operating earnings of $214.1 million for the three months ended Dec. 31, 2010, |
| compared to $203.9 million for the three months ended Dec. 31, 2009. Operating earnings per diluted share |
| (EPS) were $0.66 for the three months ended Dec. 31, 2010, compared to $0.63 for the three months ended Dec. |
| 31, 2009. The company reported net income available to common stockholders of $199.3 million, or $0.62 per |
| diluted share for the three months ended Dec. 31, 2010, compared to $141.9 million, or $0.44 per diluted share |
| for the three months ended Dec. 31, 2009. Operating revenues for the fourth quarter 2010 were $2,106.5 million |
| compared to $1,983.6 million for the same period last year. |
| “The Principal® finished the year strong with all-time record assets under management and an |
| increase in operating earnings. Strong sales in Full Service Accumulation and Principal Funds paired with |
| record net cash flow in Principal International demonstrate the growth we’re seeing across our businesses,” |
| said Larry D. Zimpleman, chairman, president and chief executive officer of Principal Financial Group, Inc. |
| “Throughout 2010, we continued to be well-served by our hybrid business model and purposeful |
| diversification. The potential of our long-term strategies will help us capitalize on unprecedented growth |
| opportunities in 2011 and beyond.” |
| _______________________ |
| 1 Use of non-GAAP financial measures is discussed in this release after Segment Highlights |
| Page 4 | |
| “As the economic recovery takes hold, we continue to see momentum build in our businesses,” said | |
| Terry Lillis, senior vice president and chief financial officer. “Compared to 2009, we kept operating expenses | |
| relatively flat on 14 percent growth in average assets under management, reflecting our ongoing expense discipline | |
| and operating leverage. Our investment portfolio performed better than expected in 2010 with improving trends | |
| throughout the year, and we remain in a very strong financial position as we move forward.” | |
| Key Highlights | |
| Year End | |
|
• |
Principal International reported record assets under management of $45.8 billion as of Dec. 31, 2010, and |
| record net cash flow of $4.7 billion for the year. | |
|
• |
Record net cash flow in Principal Funds of $1.6 billion for 2010. |
|
• |
Continued strong operating leverage in Principal Global Investors with 53 percent growth in full-year |
| 2010 operating earnings over full-year 2009 compared to 6 percent growth in average assets under | |
| management. | |
|
• |
Strong capital position with an estimated risk based capital ratio of 420 percent at year end and $1.6 billion |
| of excess capital.2 | |
| Fourth Quarter | |
| • | Third highest cumulative sales quarter of the company’s three key U.S. Retirement and Investor Services |
| products in the fourth quarter, with $3.2 billion for Full Service Accumulation, $2.6 billion for Principal | |
| Funds and $306 million for Individual Annuities. | |
|
• |
Book value per share, excluding AOCI3 increased to a record high of $27.82, up 6 percent over fourth |
| quarter 2009. | |
|
• |
Paid an annual dividend of $0.55 per common share during the quarter, a 10 percent increase over 2009. |
| Net Income | |
| Year End | |
| Net income available to common stockholders of $666.3 million for the twelve months ended Dec. 31, 2010 | |
| reflects net realized capital losses of $194.2 million, which include: | |
|
• |
$148.9 million of losses related to credit gains and losses on sales and permanent impairments of fixed |
| maturity securities, including $114.3 million of losses on commercial mortgage backed securities; | |
|
• |
$72.1 million of gains recognized in the second quarter 2010 from a change in the company’s economic |
| interest in the Brasilprev joint venture; | |
|
• |
$64.4 million of losses and provisions on residential mortgage loans, primarily related to Principal Bank’s |
| home equity portfolio; and | |
|
• |
$34.5 million of losses on commercial mortgage whole loans. |
| Net income also reflects $48.5 million of one-time after-tax losses during the third quarter 2010 from planned | |
| severance and goodwill write-off as a result of the company’s decision to exit the medical insurance business. | |
| Fourth Quarter | |
| Net income available to common stockholders of $199.3 million for the three months ended Dec. 31, 2010 | |
| reflects net realized capital losses of $37.3 million, which include: | |
|
• |
$33.5 million of losses related to credit gains and losses on sales and permanent impairments of fixed |
| maturity securities, including $24.6 million of losses on commercial mortgage backed securities; | |
|
• |
$5.9 million of losses on commercial mortgage whole loans; |
|
• |
$9.7 million of losses on residential mortgage loans; and |
|
• |
$5.7 million of losses from fixed maturities designated as trading. |
| _______________________ | |
| 2 Excess capital includes cash at the holding company and capital at the life company above that needed to maintain a | |
| 350 percent NAIC risk based capital ratio for the life company. | |
| 3 Accumulated Other Comprehensive Income | |
| Page 5 |
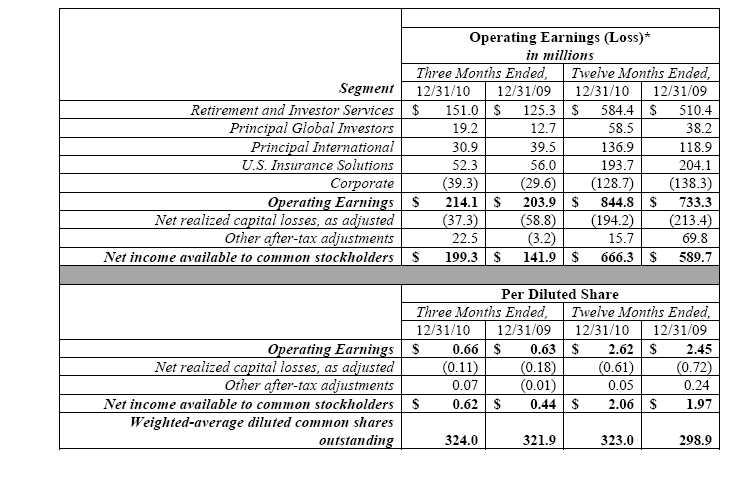
| Segment Highlights |
| Retirement and Investor Services |
| Segment operating earnings for fourth quarter 2010 were $151.0 million, compared to $125.3 million |
| for the same period in 2009, as every line of business within the segment saw a double-digit percentage increase. |
| Full Service Accumulation earnings increased 13 percent from the year ago quarter to $76.0 million, reflecting a |
| 10 percent increase in average account values. Principal Funds earnings increased 24 percent from a year ago to |
| $10.5 million, primarily due to a 15 percent increase in average account values. Individual Annuities earnings |
| were $33.2 million compared to $24.2 million for fourth quarter 2009. The variance primarily reflects favorable |
| investment performance in the quarter, including higher asset prepayment fee income. The accumulation |
| businesses4 had record account values of $159.6 billion at year end. |
| Operating revenues for the fourth quarter 2010 were $1,093.4 million compared to $1,017.1 million |
| for the same period in 2009 primarily due to higher revenues for the accumulation businesses, which |
| improved $51.5 million, or 8 percent from a year ago. |
| Segment assets under management were $175.0 billion as of Dec. 31, 2010, compared to $159.8 |
| billion as of Dec. 31, 2009, despite a $3.3 billion decrease in Investment Only account values. |
| Principal Global Investors |
| Segment operating earnings for fourth quarter 2010 were $19.2 million, compared to $12.7 million in |
| the prior year quarter, primarily due to increased transaction fees and an increase in assets under management. |
| Operating revenues for fourth quarter were $135.3 million, compared to $120.4 million for the same |
| period in 2009, primarily due to higher management fees and an increase in transaction fees. |
| Unaffiliated assets under management were $78.8 billion as of Dec. 31, 2010, compared to $73.8 |
| billion as of Dec. 31, 2009. |
| Principal International |
| Segment operating earnings were $30.9 million in fourth quarter 2010, compared to $39.5 million in |
| the prior year quarter as the current quarter, reflecting our reduced economic interest in the Brazilian joint |
| venture. |
| Operating revenues were $210.5 million for fourth quarter 2010, compared to $180.3 million for the |
| same period last year, primarily due to 32 percent growth in assets under management. |
| ________________________ |
| 4 Full Service Accumulation, Principal Funds, Individual Annuities and Bank and Trust Services |
| Page 6 |
| Segment assets under management were a record $45.8 billion as of Dec. 31, 2010 (excluding |
| approximately $6.9 billion of assets under management in our asset management joint venture in China, |
| which are not included in reported assets under management), up $11.2 billion over $34.6 billion as of Dec. |
| 31, 2009. This includes a record $4.7 billion of net cash flows over the trailing twelve months, or 14 percent |
| of beginning of period assets under management. |
| U.S. Insurance Solutions |
| Segment operating earnings for fourth quarter 2010 were $52.3 million, compared to $56.0 million |
| for the same period in 2009. Specialty Benefits earnings were $30.2 million in fourth quarter 2010, up from |
| $25.5 million in the same period a year ago, primarily due to favorable claims experience and improved |
| investment performance. Individual Life earnings were $22.1 million in the fourth quarter, compared to $30.5 |
| million in fourth quarter 2009, primarily due to an increase in GAAP net reserves in Individual Life following a |
| periodic long-term interest rate assumption review. |
| Segment operating revenues for fourth quarter were flat compared to the year ago quarter, with |
| stronger retail insurance sales and continued recovery in employer-sponsored benefit programs in the second |
| half of 2010. |
| Corporate |
| Operating losses for fourth quarter 2010 were $39.3 million compared to operating losses of $29.6 |
| million in fourth quarter 2009. The difference reflects a favorable settlement reserve release in the year ago quarter |
| and higher expenses in fourth quarter 2010. |
| _______________________ |
| Page 7 | |
| Forward looking and cautionary statements | |
| This press release contains forward-looking statements, including, without limitation, statements as to | |
| operating earnings, net income available to common stockholders, net cash flows, realized and unrealized | |
| gains and losses, capital and liquidity positions, sales and earnings trends, and management's beliefs, | |
| expectations, goals and opinions. The company does not undertake to update these statements, which are | |
| based on a number of assumptions concerning future conditions that may ultimately prove to be inaccurate. | |
| Future events and their effects on the company may not be those anticipated, and actual results may differ | |
| materially from the results anticipated in these forward-looking statements. The risks, uncertainties and | |
| factors that could cause or contribute to such material differences are discussed in the company's annual report | |
| on Form 10-K for the year ended Dec. 31, 2009, and in the company’s quarterly report on Form 10-Q for the | |
| quarter ended Sept. 30, 2010, filed by the company with the Securities and Exchange Commission, as updated | |
| or supplemented from time to time in subsequent filings. These risks and uncertainties include, without | |
| limitation: adverse capital and credit market conditions that may significantly affect the company’s ability to | |
| meet liquidity needs, access to capital and cost of capital; a continuation of difficult conditions in the global | |
| capital markets and the general economy that may materially adversely affect the company’s business and | |
| results of operations; the actions of the U.S. government, Federal Reserve and other governmental and | |
| regulatory bodies for purposes of stabilizing the financial markets might not achieve the intended effect; the | |
| risk from acquiring new businesses, which could result in the impairment of goodwill and/or intangible assets | |
| recognized at the time of acquisition; impairment of other financial institutions that could adversely affect the | |
| company; investment risks which may diminish the value of the company’s invested assets and the investment | |
| returns credited to customers, which could reduce sales, revenues, assets under management and net income; | |
| requirements to post collateral or make payments related to declines in market value of specified assets may | |
| adversely affect company liquidity and expose the company to counterparty credit risk; changes in laws, | |
| regulations or accounting standards that may reduce company profitability; fluctuations in foreign | |
| currency exchange rates that could reduce company profitability; Principal Financial Group, Inc.’s | |
| primary reliance, as a holding company, on dividends from its subsidiaries to meet debt payment obligations | |
| and regulatory restrictions on the ability of subsidiaries to pay such dividends; competitive factors; volatility | |
| of financial markets; decrease in ratings; interest rate changes; inability to attract and retain sales representatives; | |
| international business risks; a pandemic, terrorist attack or other catastrophic event; and default of the company’s re-insurers. | |
| Use of Non-GAAP Financial Measures | |
| The company uses a number of non-GAAP financial measures that management believes are useful to investors | |
| because they illustrate the performance of normal, ongoing operations, which is important in understanding and | |
| evaluating the company’s financial condition and results of operations. They are not, however, a substitute for | |
| U.S. GAAP financial measures. Therefore, the company has provided reconciliations of the non-GAAP | |
| measures to the most directly comparable U.S. GAAP measure at the end of the release. The company adjusts | |
| U.S. GAAP measures for items not directly related to ongoing operations. However, it is possible these | |
| adjusting items have occurred in the past and could recur in the future reporting periods. Management also uses | |
| non-GAAP measures for goal setting, as a basis for determining employee and senior management | |
| awards and compensation, and evaluating performance on a basis comparable to that used by investors | |
| and securities analysts. | |
| Earnings Conference Call | |
| On Tuesday, Feb. 8, 2011 at 10:00 a.m. (ET), Chairman, President and Chief Executive Officer Larry | |
| Zimpleman and Senior Vice President and Chief Financial Officer Terry Lillis will lead a discussion of | |
| results, asset quality and capital adequacy during a live conference call, which can be accessed as follows: | |
| • Via live Internet webcast. Please go to www.principal.com/investor at least 10-15 minutes prior to the | |
| start of the call to register, and to download and install any necessary audio software. | |
| • Via telephone by dialing 800-374-1609 (U.S. and Canadian callers) or 706-643-7701 (International | |
| callers) approximately 10 minutes prior to the start of the call. The access code is 34798317. | |
| Page 8 |
| Replay of the earnings call via telephone is available by dialing 800-642-1687 (U.S. and Canadian | ||
| callers) or 706-645-9291 (International callers). The access code is 34798317. This replay will be | ||
| available approximately two hours after the completion of the live earnings call through the end of day | ||
| Feb. 15, 2011. | ||
| Replay of the earnings call via webcast as well as a transcript of the call will be available after the call at: | ||
| www.principal.com/investor. | ||
| The company's financial supplement and additional investment portfolio detail for fourth quarter 2010 is |
| currently available at www.principal.com/investor, and may be referred to during the call. |
| About the Principal Financial Group |
| The Principal Financial Group® (The Principal ® )5 is a leader in offering businesses, individuals and |
| institutional clients a wide range of financial products and services, including retirement and investment |
| services, insurance, and banking through its diverse family of financial services companies. A member of the |
| Fortune 500, the Principal Financial Group has $318.8 billion in assets under management6 and serves some |
| 19.1 million customers worldwide from offices in Asia, Australia, Europe, Latin America and the United |
| States. Principal Financial Group, Inc. is traded on the New York Stock Exchange under the ticker symbol |
| PFG. For more information, visit www.principal.com. |
| ### |
| _______________________ |
| 5 “The Principal Financial Group” and “The Principal” are registered service marks of Principal Financial Services, |
| Inc., a member of the Principal Financial Group. |
| 6 As of Dec. 31, 2010 |
| Page 9 |
| Summary of Segment and Principal Financial Group, Inc. Results |
| *Operating earnings versus U.S. GAAP (GAAP) net income available to common stockholders |
| Management uses operating earnings, which excludes the effect of net realized capital gains and losses, as adjusted, and other after- |
| tax adjustments, for goal setting, as a basis for determining employee compensation, and evaluating performance on a basis |
| comparable to that used by investors and securities analysts. Segment operating earnings are determined by adjusting U.S. GAAP net |
| income available to common stockholders for net realized capital gains and losses, as adjusted, and other after-tax adjustments the |
| company believes are not indicative of overall operating trends. Note: it is possible these adjusting items have occurred in the past |
| and could recur in future reporting periods. While these items may be significant components in understanding and assessing our |
| consolidated financial performance, management believes the presentation of segment operating earnings enhances the understanding |
| of results of operations by highlighting earnings attributable to the normal, ongoing operations of the company’s businesses. |