Attached files
| file | filename |
|---|---|
| EX-99.1 - PRESS RELEASE - SUNOCO INC | dex991.htm |
| 8-K - SUNOCO INC--FORM 8-K - SUNOCO INC | d8k.htm |
 4Q10 Earnings Conference Call
February 3, 2011
Exhibit 99.2 |
 2
Safe Harbor Statement
This slide presentation should be reviewed in conjunction with Sunoco’s Fourth Quarter 2010
earnings conference call held on February 3, 2011 at 5:30 p.m. ET. You may listen to the audio
portion of the conference call on the website or an audio recording will be available after the
call’s completion by calling 1-800-294-0344 and entering conference ID #2345946.
Statements in this presentation that are not historical facts are forward-looking statements
intended to be covered by the safe harbor provisions of Section 27A of the Securities Act of
1933 and Section 21E of the Securities Exchange Act of 1934. These forward-looking
statements are based upon assumptions by Sunoco concerning future conditions, any or all of which ultimately
may prove to be inaccurate, and upon the current knowledge, beliefs and expectations of Sunoco
management. These forward-looking statements are not guarantees of future
performance. Forward-looking statements are inherently uncertain and involve significant risks and
uncertainties that could cause actual results to differ materially from those described during
this presentation. Such risks and uncertainties include economic, business, competitive
and/or regulatory factors affecting Sunoco's business, as well as uncertainties related to the outcomes
of pending or future litigation. In accordance with the safe harbor provisions of the Private
Securities Litigation Reform Act of 1995, Sunoco has included in its Annual Report on Form
10-K for the year ended December 31, 2009, and in its subsequent Form 10-Q and Form
8-K filings, cautionary language identifying important factors (though not necessarily all such factors) that
could cause future outcomes to differ materially from those set forth in the forward-looking
statements. For more information concerning these factors, see Sunoco's Securities and
Exchange Commission filings, available on Sunoco's website at www.SunocoInc.com. Sunoco
expressly disclaims any obligation to update or alter its forward-looking statements, whether as
a result of new information, future events or otherwise.
This presentation includes certain non-GAAP financial measures intended to supplement, not
substitute for, comparable GAAP measures. Reconciliations of non-GAAP financial measures to
GAAP financial measures are provided in the Appendix at the end of the presentation.
Investors are urged to consider carefully the comparable GAAP measures and the reconciliations
to those measures provided in the Appendix, or on our website at www.SunocoInc.com. |
 3
4Q10 Results
After-tax income before special items of
$13MM* ($0.11/share diluted),
pretax
loss of $2MM*
Retail contributed $1MM pretax in a period of rising crude prices
Logistics delivered strong results with pretax income of $37MM
SunCoke earned
$25MM pretax
Refining & Supply (R&S) reported a pretax loss of $17MM
as operational
issues hindered performance
* For
reconciliation
to
Net
Income
(Loss),
see
Slides
18
and
19.
Special
Items
in
4Q10
include
a
net
gain of $74MM after-tax.
Summary |
 4
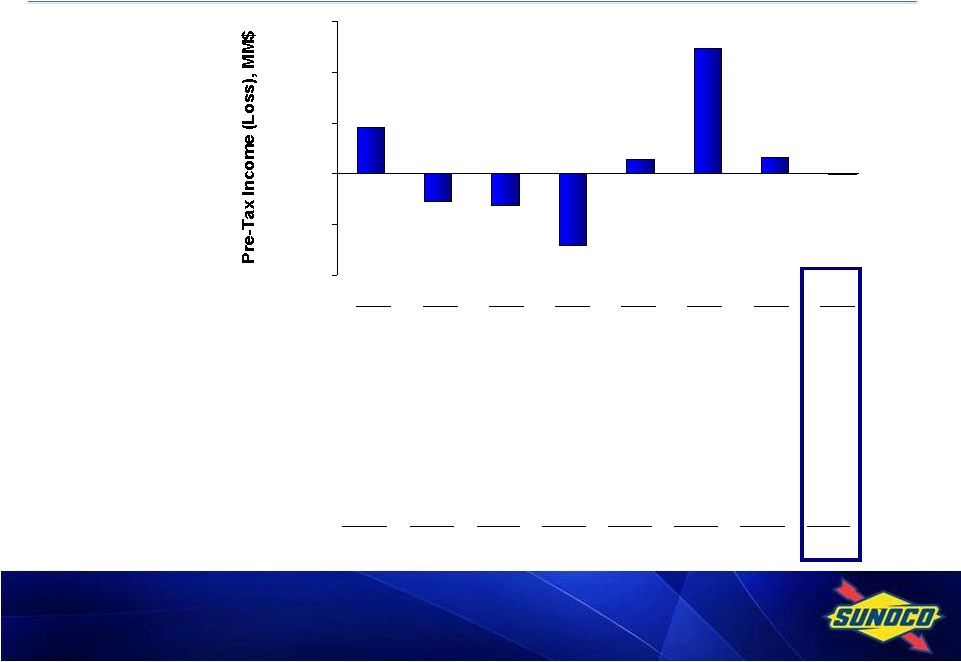
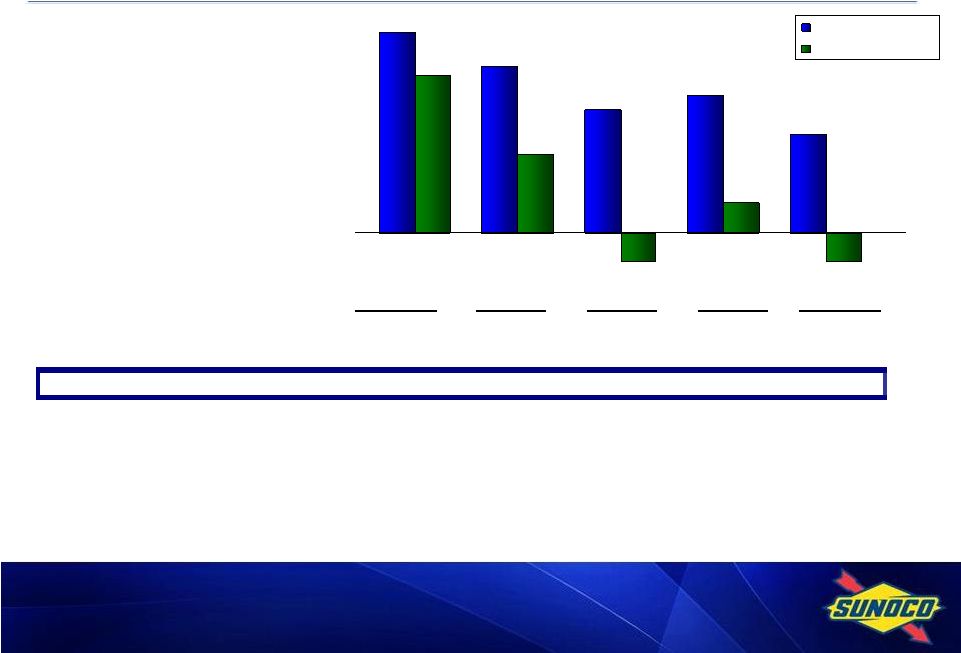
Pretax Income (Loss) Before Special Items*, MM$
(2)
33
247
29
(141)
(62)
(54)
90
($200)
($100)
$0
$100
$200
$300
* Pretax Income (Loss) Before Special Items. For reconciliation to Net Income
(Loss), see Slide 19. 1Q09
2Q09
3Q09
4Q09
1Q10
2Q10
3Q10
4Q10
Refining & Supply
Continuing Operations
26
(130)
(182)
(227)
(70)
138
(70)
(17)
Discontinued Tulsa Operations
15
(10)
-
-
-
-
-
-
Retail Marketing
9
18
83
36
34
73
68
1
Logistics
48
41
30
33
27
30
42
37
Coke
33
61
47
52
51
56
44
25
Chemicals
Continuing Operations
(17)
(6)
(4)
6
5
7
5
6
Discontinued Polypropylene Operations
11
6
2
3
33
-
-
-
Corporate Expenses
(18)
(15)
(18)
(16)
(23)
(30)
(28)
(27)
Net Financing Expenses & Other
(17)
(19)
(20)
(28)
(28)
(27)
(28)
(27)
Pre-Tax Income (Loss) Before Special Items
90
(54)
(62)
(141)
29
247
33
(2) |
 5
R&S EBITDA vs. Capital, MM$
4Q10
4Q09
Variance
2010
2009
Variance
Pretax Loss
(17)
(227)
210
(19)
(508)
489
DD&A
64
66
(2)
263
279
(16)
EBITDA
47
(161)
208
244
(229)
473
Capex*
(47)
(50)
3
(223)
(369)
146
* Excludes Biofuels growth capital.
While the refining environment remains challenging, we have made
progress
with
our
initiatives
around
reliability,
cost
structure
and
margin
capture, as shown by the year over year improvement in EBITDA
generation and efficiency of capital spending |
 6
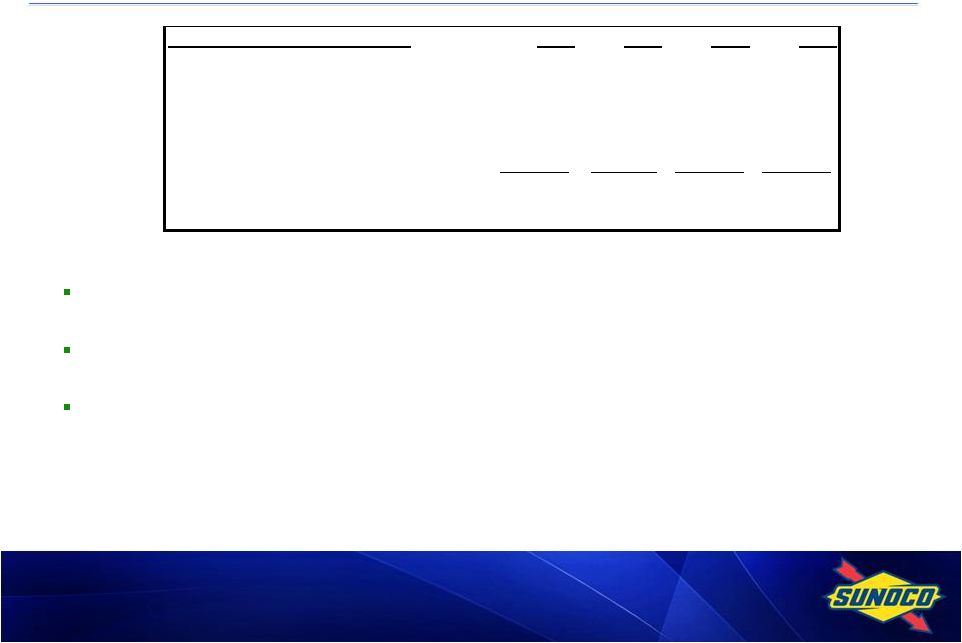
Retail Marketing –
Pretax Earnings of
$1MM
Margins challenged by rising crude and wholesale prices
throughout the quarter
4Q same site volumes higher than prior year for gasoline (1.8%) &
distillate (7%)
Logistics –
Pretax Earnings of $37MM
Strong performance from Sunoco Logistics Partners L.P. (NYSE:
SXL); Earnings helped by 2009 and 2010 acquisitions and
contango profits
Coke –
Pretax Earnings of $25MM
Full year after-tax income of $132MM in line with guidance
* Pretax Business Unit Income Before Special Items, excluding income attributable
to non-controlling interests. For reconciliation to Net Income (Loss),
see Slide 19. Retail, Logistics & Coke Income* -
4Q10 |
 7
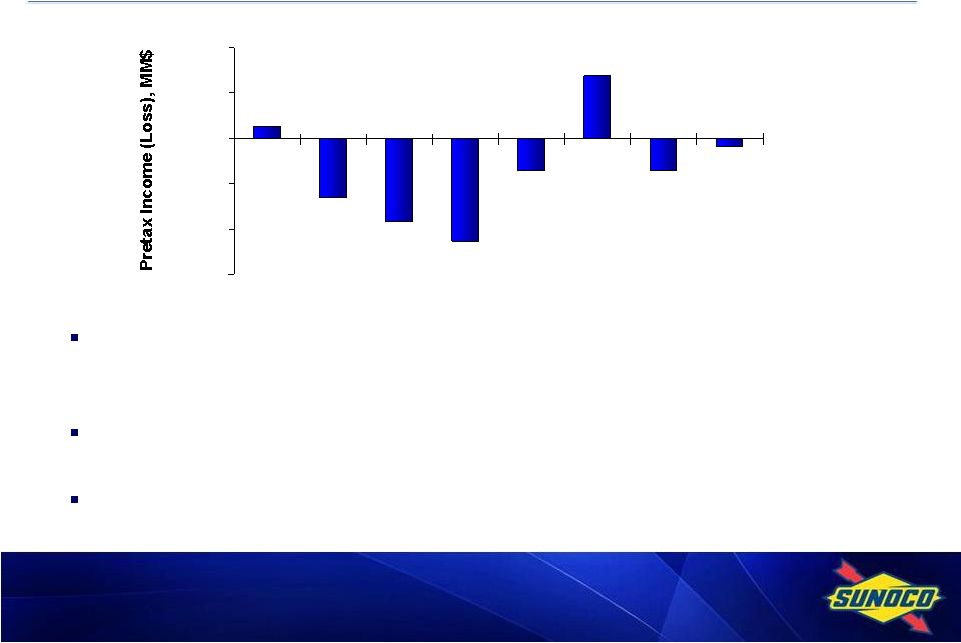
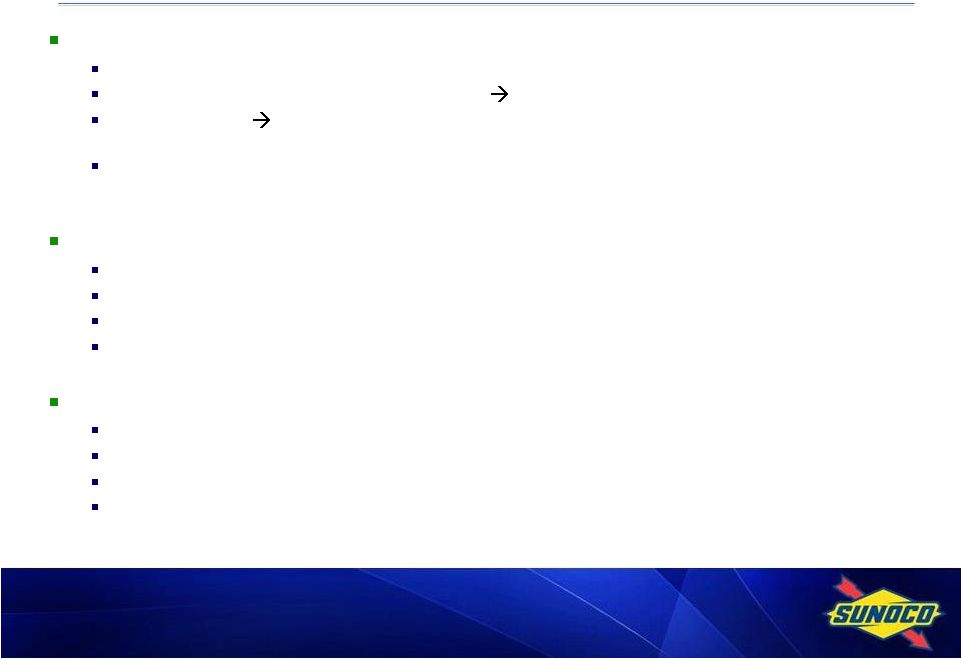
Northeast market margins improved from 3Q but region still challenged by
excess supply and depressed demand; rising crude prices further challenged
margin capture
Near break-even in 4Q better than last year by $210 MM, helped by improved
market
but
also
actions
on
operations,
cost
structure
and
margin
capture
Market is expected to remain challenging with continued economic
weakness
and additional global supply => we remain focused on fundamentals
Refining & Supply -
4Q10 Pretax Income*, MM$
* Pretax Business Unit Income Before Special Items, excluding discontinued Tulsa
refining operations. For reconciliation of Pretax Income (Loss) and Net
Income (Loss), see Slides 18 and 19. (17)
(70)
138
(70)
(227)
(182)
(130)
26
($300)
($200)
($100)
$0
$100
$200
1Q09
2Q09
3Q09
4Q09
1Q10
2Q10
3Q10
4Q10 |
 8
* Excludes discontinued Tulsa refining operations.
** R&S Weighted
Benchmark. For calculation, see Slide 28.
Realized R&S Margin vs. Benchmark**, $/B
1Q09
2Q09
3Q09
4Q09
FY09
1Q10
2Q10
3Q10
4Q10
FY10
Refining & Supply
Realized Margin *
6.33
3.65
2.72
1.96
3.66
4.08
7.34
3.88
4.77
5.04
Weighted Benchmark **
5.71
6.05
4.57
3.59
4.98
5.67
6.51
4.87
6.11
5.79
Differential
0.62
(2.40)
(1.85)
(1.63)
(1.32)
(1.59)
0.83
(0.99)
(1.34)
(0.75)
Margin Capture Rate
111%
60%
60%
55%
73%
72%
113%
80%
78%
87%
Actual vs. Weighted Benchmark:
Crude
1.40
0.18
0.10
(0.61)
0.27
(0.92)
0.33
(0.92)
(0.65)
(0.49)
Product
(0.78)
(2.58)
(1.95)
(1.02)
(1.59)
(0.67)
0.50
(0.07)
(0.69)
(0.26)
Differential
0.62
(2.40)
(1.85)
(1.63)
(1.32)
(1.59)
0.83
(0.99)
(1.34)
(0.75) |
 9
0.65
0.92
(0.33)
0.61
0.92
(0.10)
(0.18)
(1.40)
-4.00
-2.00
0.00
2.00
4.00
1Q09
2Q09
3Q09
4Q09
1Q10
2Q10
3Q10
4Q10
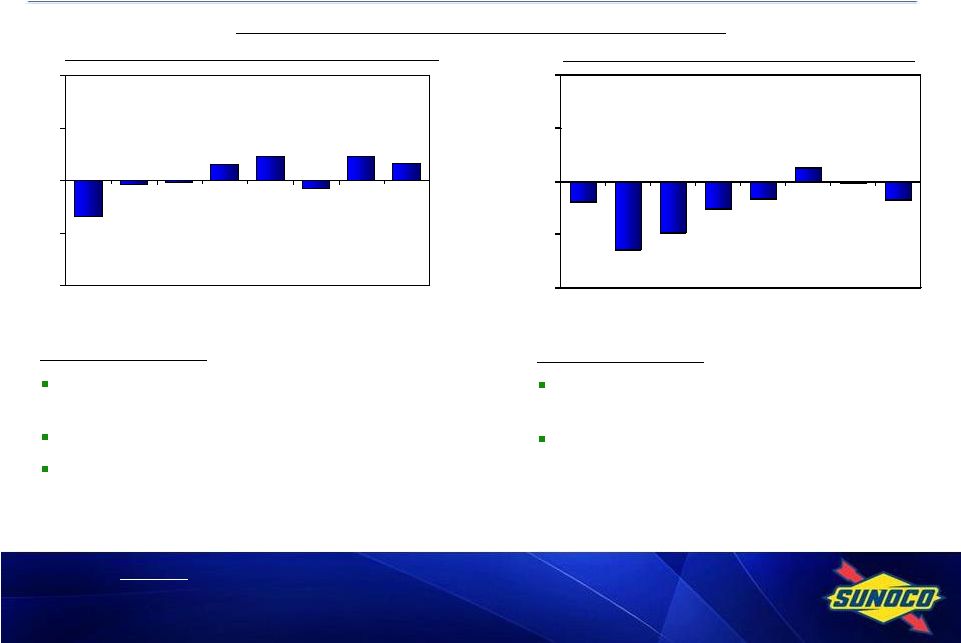
Crude Cost vs. Weighted Benchmark
(0.69)
(0.07)
0.50
(0.67)
(1.02)
(1.95)
(2.58)
(0.78)
-4.00
-2.00
0.00
2.00
4.00
1Q09
2Q09
3Q09
4Q09
1Q10
2Q10
3Q10
4Q10
Products vs. Weighted Benchmark
Total
Refining
&
Supply
(excluding
Tulsa)
* R&S Weighted
Benchmark. For calculation, see Slide 28.
4Q10 Comments:
Timing
hit
of
~$.50/B
due
to
rising
crude
prices
for second consecutive quarter
Toledo
diffs
better
than
3Q
Transportation costs higher than benchmark
4Q10 Comments:
Realizations impacted by lack of ratability
connected to reliability issues
Better than 4Q09 with improved distillate
cracks and upgraded product mix
Realized R&S Margin vs. Benchmark*, $/B |
 10
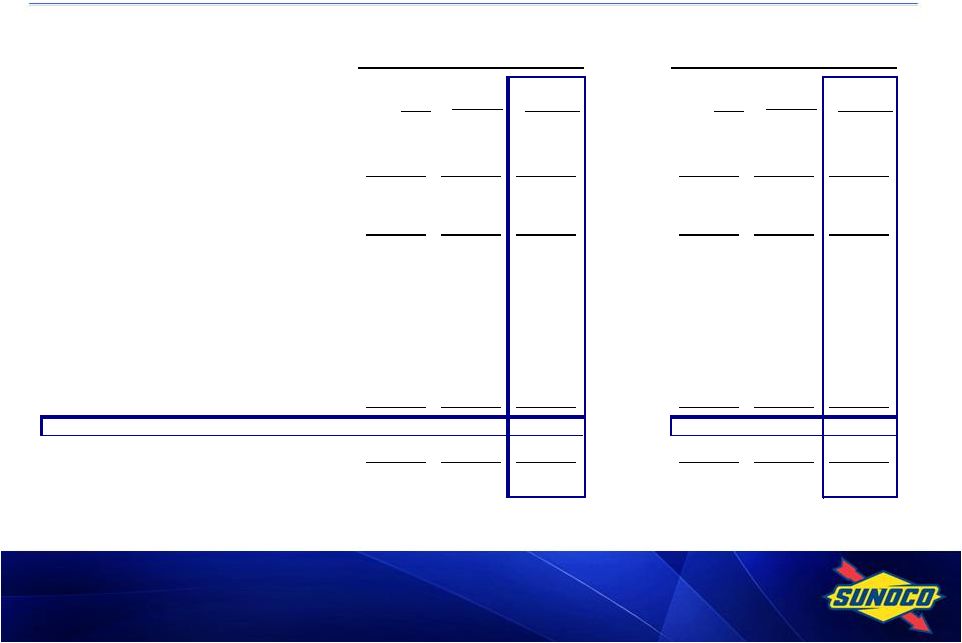
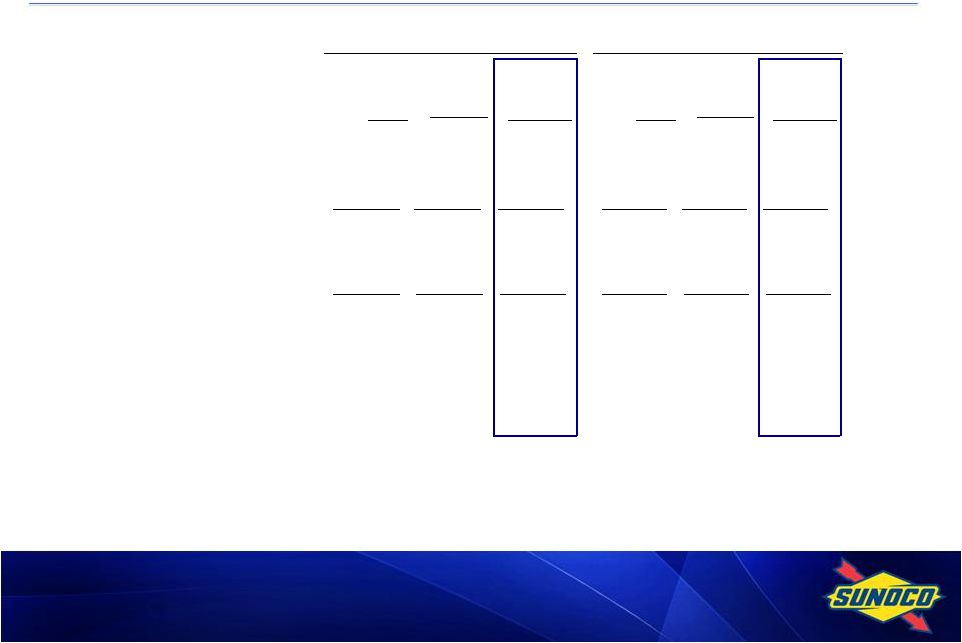
Sunoco and SXL Cash Flow, MM$
SUN
SUN
SXL
(ex SXL)
Sunoco
SXL
(ex SXL)
Sunoco
Cash from ops ex working capital
83
395
478
284
1,227*
1,511
Working capital
158
141
299
33
150
183
Cash flow from operations
241
536
777
317
1,377
1,694
Capital expenditures
(70)
(207)
(277)
(426)
(614)
(1,040)
Free cash flow
171
329
500
(109)
763
654
Divestments
-
27
27
-
393
393
Dividends to Sunoco shareholders
-
(19)
(19)
-
(73)
(73)
Distributions & other
(29)
(3)
(32)
(102)
(21)
(123)
SXL equity issue/sale, & GP contribution
-
-
-
147
142
289
SXL dividends to Sunoco
(23)
23
-
(91)
91
-
SXL dividends to Sunoco for IDR reset
-
-
-
(201)
201
-
Sunoco loan to SXL
-
-
-
100
(100)
-
Net cash flow before net debt activity
119
357
476
(256)
1,396
1,140
Net debt activity
(119)
-
(119)
256
(288)
(32)
Net increase in cash & cash equivalents
-
357
357
-
1,108
1,108
4Q10
2010
* Includes
$394MM
related
to
tax
refund
received
in
1Q10
(included
within
working
capital
in
Consolidated
Statement of Cash Flows). |
 11
12/31/09
3/31/10
6/30/10
9/30/10
12/31/10
Sunoco (ex-SXL)*
32%
16%
-6%
6%
-6%
SXL
50%
63%
65%
61%
59%
Consolidated**
41%
34%
25%
28%
20%
Sunoco Net Debt/(Cash)
1,223
498
(153)
173
(182)
SXL Net Debt***
866
1,139
1,211
1,346
1,227
Consolidated Net Debt,
2,089
1,637
1,058
1,419
945
Total Cash, MM$
377
812
1,462
1,129
1,485
34%
25%
28%
20%
6%
-6%
41%
-6%
16%
32%
Consolidated
Sunoco (ex-SXL)
* Proforma.
** Sunoco
Revolver
Covenant
basis.
For
calculation,
see
Slides
23
and
24.
*** Includes intercompany loan due to Sunoco from SXL at 12/31/2010 which is
eliminated in consolidation. Net Debt-to-Capital Ratio, %
|
 12
Capital Program by Business Unit, MM$
Proj
2008
2009
2010
2011
Refining & Supply
652
369
223
135-145*
Chemicals
49
35
20
25
Retail Marketing
128
80
99
115-125
Coke
16
30
43
75
845
514
385
350-370
Growth:
Coke
296
199
180
214
Biofuels - Fulton
-
11
24
-
Retail Marketing
-
-
25
-
1,141
724
614
564-584
Logistics - Maintenance
27
32
37
45
Logistics - Growth***
303
193
389
100-150
1,471
949
1,040
709-779
*
Assumes
close
of
Toledo
refinery
sale
in
1Q2011
and
excludes
Marcus
Hook
consent
decree
capital
that
may
be
delayed
as
a result of discussions with government environmental authorities.
* * Includes
$162MM
for
Middletown
coke
plant,
$40MM
for
Harold
Keene
coal
acquisition
and
$12MM
for coal expansion.
*** Logistics Growth excludes significant acquisitions and Project
Mariner. ** |
 13
SunCoke Financial Summary
Total SunCoke Energy, $MM
2007
2008
2009
2010
EBITDA
34
160
226
225
Less: Depreciation
20
25
33
49
Less: Income Tax
3
46
73
63
Plus: Tax Credits
18
16
19
19
Plus: Granite City one-time tax credit
-
-
41
-
Net Income
29
105
180
132
Capital Spending
(221)
(312)
(229)
(223)
2010 earnings of $132MM after-tax in line with guidance of $125MM to $140MM
Earnings were lower in 2H 2010 due to lower coal blend price and
higher spending
SunCoke EBITDA > capital spending in 2010 and working capital benefits generated
incremental cash flow |
 14
SunCoke 2011 and Forward
Settlement reached with ArcelorMittal
regarding coke pricing in Jewell contract
Guidance:
2010 ACT
2011
2012**
EBITDA
$225MM
$165MM -
$200MM
$280MM -
$320MM
Net Income*
$132MM
$90MM -
$115MM
$160MM -
$180MM
Coal price
~$130
~$165
~$175
Guidance Includes:
ArcelorMittal
settlement effective 1/1/2011
Transition & stand-alone costs starting in 2011
Full
Year
of
Gateway
operations
in
2011;
full
Year
of
Middletown
operations
starting
in
2012
Previously announced Jewell coal expansion
Middletown Project Completion estimated for late second half 2011
* Excludes any potential financing costs associated with separation of
SunCoke. ** Uses a coal price assumption of $175 per ton. No coal purchases
or sales have been contracted yet for 2012. |
 15
Refining
& Supply
1,100
Chemicals
690
Logistics
1,070
Will create two well-positioned businesses:
Leading high-quality metallurgical coke manufacturer with operations in the
U.S. and abroad
Streamlined fuels business that is better positioned to become the premier
provider of transportation fuels in its markets
Enhances both businesses and allows each to pursue more
focused strategic plan
Fritz Henderson hired to lead SunCoke; will be CEO after
separation
Private letter ruling filed in late October 2010
Unlocking Shareholder Value via SunCoke Separation |
 16
Market remains challenging, but we continue to execute our strategy
Profitable in 2010 on strength of retail, logistics and coke operations
Strong balance sheet provides flexibility
~$1.4 B swing in 2010 to net cash position
Recent growth
SXL growth capital ~ $400 MM in 2010; Ohio Turnpike & Garden State
Parkway; 25 stations in upstate New York; new distributors; Harold Keene
coal Refining still faces challenging market, but year-over-year
improvement reflects continued focus on margin capture, cost reduction, and
reliability/utilization Focused on fundamentals
Improve margin capture
Lower our break-even cost per barrel
Run safely and reliably at optimal capacity utilization; match product yield to
demand Balance sheet: High cash balance provides strategic flexibility
Positioning for future success
Become premier provider of transportation fuels in our markets
Grow through Retail and SXL
Achieve sustainably lower cost structure
Separation of SunCoke Energy remains a priority
Key Takeaways |
 Appendix |
 18
1Q09
2Q09
3Q09
4Q09
FY09
1Q10
2Q10
3Q10
4Q10
FY10
Refining & Supply
Continuing Operations
14
(77)
(118)
(135)
(316)
(42)
86
(44)
(8)
(8)
Discontinued Tulsa Operations
9
(6)
-
-
3
-
-
-
-
-
Retail Marketing
6
10
49
21
86
21
45
41
3
110
Logistics
30
26
19
22
97
17
20
26
23
86
Coke
25
42
35
78
180
37
41
33
21
132
Chemicals
Continuing Operations
(12)
(3)
(2)
4
(13)
3
5
3
4
15
Discontinued Polypropylene Operations
8
3
1
2
14
21
-
-
-
21
Corporate Expenses
(11)
(15)
(6)
(6)
(38)
(23)
(20)
(17)
(13)
(73)
Net Financing Expenses & Other
(10)
(11)
(12)
(17)
(50)
(17)
(19)
(15)
(17)
(68)
Income (Loss) Before Special Items
59
(31)
(34)
(31)
(37)
17
158
27
13
215
Special Items
(47)
(24)
(278)
57
(292)
(80)
(13)
38
74
19
Net Income (Loss) attributable to
Sunoco shareholders
12
(55)
(312)
26
(329)
(63)
145
65
87
234
EPS, $/Share (diluted)
Income (Loss) Before Special Items
0.50
(0.27)
(0.29)
(0.27)
(0.32)
0.14
1.31
0.22
0.11
1.79
Net Income (Loss) attributable to
Sunoco shareholders
0.10
(0.47)
(2.67)
0.22
(2.81)
(0.53)
1.20
0.54
0.72
1.95
Earnings Profile, MM$ After-Tax |
 19
Earnings Profile, MM$ Pretax
1Q09
2Q09
3Q09
4Q09
FY09
1Q10
2Q10
3Q10
4Q10
FY10
Refining & Supply
Continuing Operations
26
(130)
(182)
(227)
(513)
(70)
138
(70)
(17)
(19)
Discontinued Tulsa Operations
15
(10)
-
-
5
-
-
-
-
-
Retail Marketing
9
18
83
36
146
34
73
68
1
176
Logistics
48
41
30
33
152
27
30
42
37
136
Coke
33
61
47
52
193
51
56
44
25
176
Chemicals
Continuing Operations
(17)
(6)
(4)
6
(21)
5
7
5
6
23
Discontinued Polypropylene Operations
11
6
2
3
22
33
-
-
-
33
Corporate Expenses
(18)
(15)
(18)
(16)
(67)
(23)
(30)
(28)
(27)
(108)
Net Financing Expenses & Other
(17)
(19)
(20)
(28)
(84)
(28)
(27)
(28)
(27)
(110)
Pretax Income (Loss) Before Special Items
90
(54)
(62)
(141)
(167)
29
247
33
(2)
307
Pretax Special Items
(79)
(41)
(467)
94
(493)
(214)
(22)
62
123
(51)
Pretax Income (Loss)
11
(95)
(529)
(47)
(660)
(185)
225
95
121
256
Income Tax Expense (Benefit)
(1)
(40)
(217)
(73)
(331)
(122)
80
30
34
22
Net Income (Loss) attributable
to Sunoco
shareholders 12
(55)
(312)
26
(329)
(63)
145
65
87
234
|
 20
* Excludes discontinued Tulsa refining operations.
** Excludes discontinued polypropylene operations.
Key Indicators
1Q09
2Q09
3Q09
4Q09
FY09
1Q10
2Q10
3Q10
4Q10
FY10
Realized
Margin
Indicators
Refining & Supply, $/B*
6.33
3.65
2.72
1.96
3.66
4.08
7.34
3.88
4.77
5.04
Retail Marketing, cpg
Gasoline
6.4
7.0
13.0
8.8
8.9
8.9
11.5
10.5
6.6
9.4
Distillate
24.5
12.0
11.7
7.9
14.8
8.0
9.0
7.8
5.6
7.6
Chemicals, cpp**
6.6
8.2
7.3
9.7
8.0
9.9
8.9
7.6
9.1
8.8
Market
Indicators
Dated Brent Crude Oil, $/B
44.40
58.79
68.27
74.56
61.51
76.24
78.30
76.86
86.48
79.47
Natural Gas, $/DT
4.48
3.81
3.44
4.92
4.16
5.04
4.34
4.23
3.97
4.40 |
 21
1Q09
2Q09
3Q09
4Q09
FY09
1Q10
2Q10
3Q10
4Q10
FY10
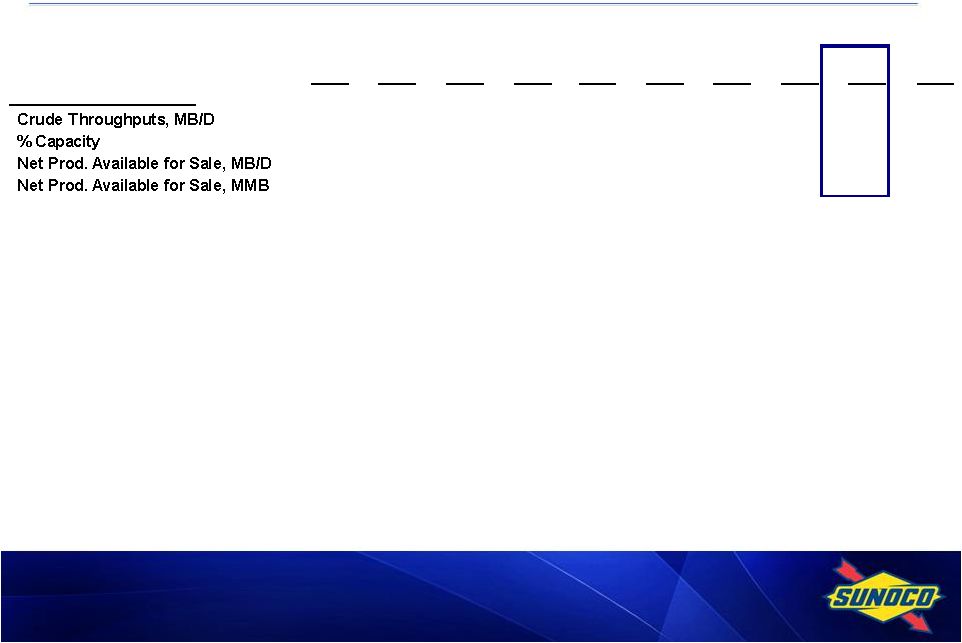
Total Refining & Supply *
627
644
613
617
625
533
618
632
572
589
76
78
74
85
78
79
92
94
85
87
689
720
669
682
690
591
664
682
634
643
62
66
62
62
252
53
61
62
58
234
* Excludes discontinued Tulsa refining operations.
Key Volume Indicators –
Refining & Supply |
 22
1Q09
2Q09
3Q09
4Q09
FY09
1Q10
2Q10
3Q10
4Q10
FY10
Retail Marketing
Gasoline Sales, MM Gal
1,066
1,147
1,140
1,108
4,461
1,026
1,130
1,171
1,171
4,498
Middle Distillate Sales, MM Gal
138
116
114
95
463
91
114
117
110
432
Total Sales, MM Gal
1,204
1,263
1,254
1,203
4,924
1,117
1,244
1,288
1,281
4,930
Gasoline and Diesel Throughput
143
153
156
153
151
147
159
148
161
156
(Company-Owned or Leased Outlets)
(M Gal/Site/Month)
Merchandise Sales (M$/Store/Month)
79
94
99
91
90
87
101
103
92
96
Chemicals*
Phenol and Related Sales, MM#
407
427
483
457
1,774
449
554
567
582
2,152
Coke
Production, M Tons:
United States
681
694
715
778
2,868
841
883
953
916
3,593
Brazil
280
279
321
383
1,263
413
422
431
370
1,636
* Excludes discontinued polypropylene operations.
Key Volume Indicators –
Retail, Chemicals, Coke |
 23
*
Represents intercompany loan due to Sunoco from SXL which is eliminated in
consolidation. **
Represents Partners’
Capital for SXL and Shareholders’
Equity for Sunoco.
*** The
Net
Debt
/
Capital
ratio
is
used
by
Sunoco
management
in
its
internal
financial
analysis
and
by
investors
and
creditors in the assessment of Sunoco’s financial position.
**** Capital excludes noncontrolling interests.
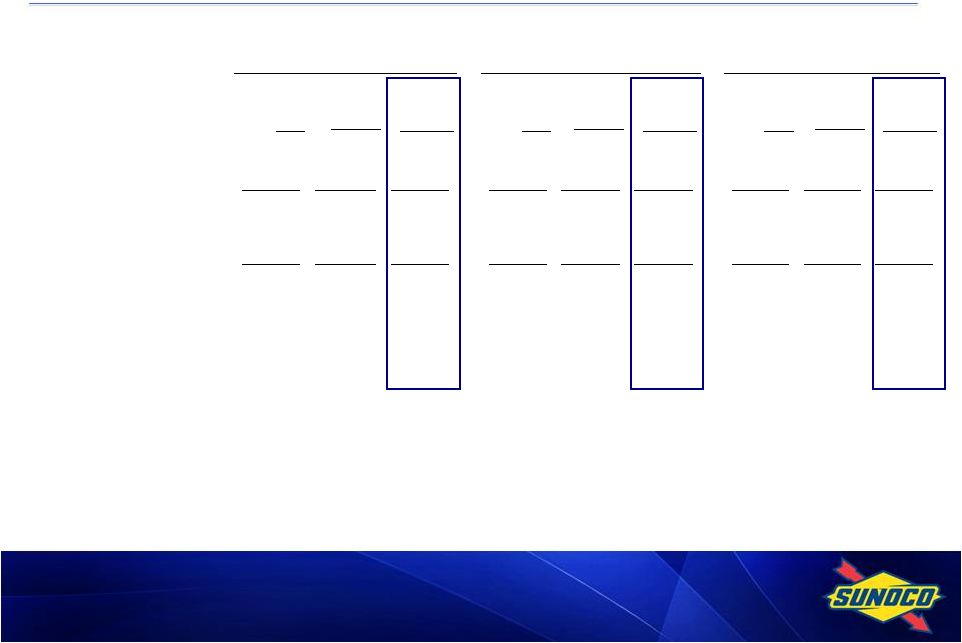
Financial Ratios, MM$ except ratios
Proforma
Proforma
SUN
SUN
SXL
(ex SXL)
Sunoco
SXL
(ex SXL)
Sunoco
Debt
1,248
1,299
2,547
1,129
1,300
2,429
Intercompany Debt*
100
-
-
100
-
-
Plus: Debt Guarantees
-
1
1
-
1
1
Less: Cash
(2)
(1,127)
(1,129)
(2)
(1,483)
(1,485)
Net Debt
1,346
173
1,419
1,227
(182)
945
Equity**
958
2,920
2,920
965
3,046
3,046
SXL Noncontrolling
Interest
-
-
689
-
-
692
Capital
2,304
3,093
5,028
2,192
2,864
4,683
Net Debt / Capital (Sunoco
Revolver Covenant Basis)***
N/A
6%
28%
N/A
-6%
20%
Debt / Capital (GAAP Basis) ****
61%
31%
47%
59%
30%
44%
9/30/2010
12/31/2010 |
 24
*
Represents
Partners’
Capital
for
SXL
and
Shareholders’
Equity
for
Sunoco.
** The Net Debt / Capital ratio is used by Sunoco management in its internal
financial analysis and by investors and creditors in the assessment of
Sunoco’s financial position. *** Capital excludes noncontrolling
interests. Financial Ratios, MM$ except ratios
Proforma
Proforma
Proforma
SUN
SUN
SUN
SXL
(ex SXL)
Sunoco
SXL
(ex SXL)
Sunoco
SXL
(ex SXL)
Sunoco
Debt
868
1,596
2,464
1,141
1,306
2,447
1,213
1,306
2,519
Plus: Debt Guarantees
-
2
2
-
2
2
-
1
1
Less: Cash
(2)
(375)
(377)
(2)
(810)
(812)
(2)
(1,460)
(1,462)
Net Debt
866
1,223
2,089
1,139
498
1,637
1,211
(153)
1,058
Equity*
862
2,557
2,557
657
2,712
2,712
664
2,831
2,831
SXL Noncontrolling
Interest
-
-
488
-
-
414
-
-
418
Capital
1,728
3,780
5,134
1,796
3,210
4,763
1,875
2,678
4,307
Net Debt / Capital (Sunoco
Revolver Covenant Basis)**
N/A
32%
41%
N/A
16%
34%
N/A
-6%
25%
Debt / Capital (GAAP Basis) ***
50%
38%
49%
63%
33%
47%
65%
32%
47%
12/31/2009
3/31/2010
6/30/2010 |
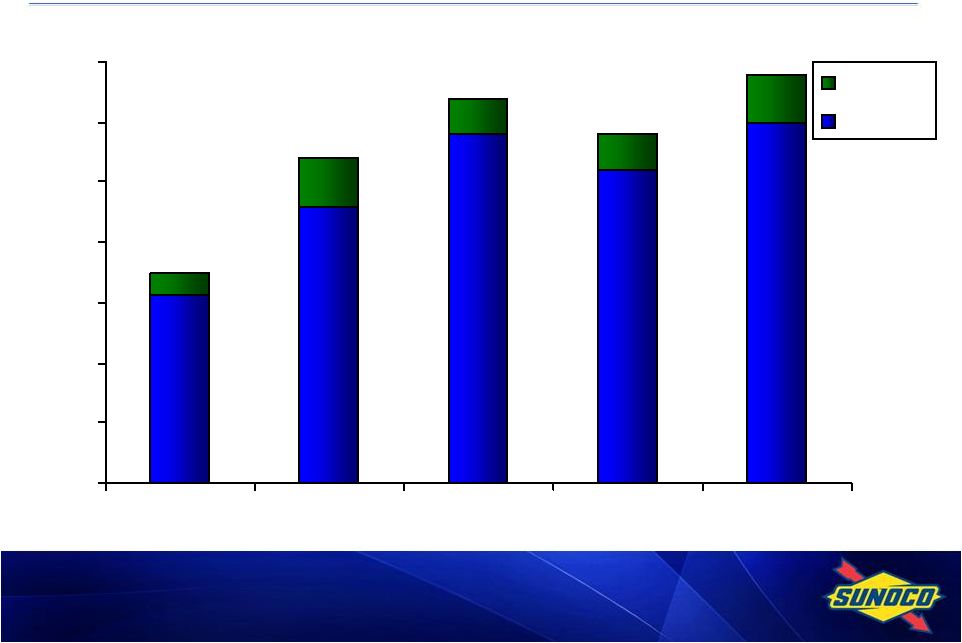 25
0.0
0.5
1.0
1.5
2.0
2.5
3.0
3.5
12/31/2009
3/31/2010
6/30/2010
9/30/2010
12/31/2010
SXL
Sunoco
* Includes cash and cash equivalents of $0.4B, $0.8B, $1.5B, $1.1B, and $1.5B
at 12/31/09, 3/31/10, 6/30/10, 9/30/10, and 12/31/10 respectively.
Liquidity*, B$
1.7
2.7
3.2
2.9
3.4 |
 26
1Q09
2Q09
3Q09
4Q09
FY09
1Q10
2Q10
3Q10
4Q10
FY10
Total Refining & Supply *
Net Production, MB/D
689.1
720.2
669.2
681.7
689.9
590.5
664.2
681.5
633.9
642.8
Gasoline
51%
51%
52%
53%
52%
52%
52%
52%
54%
52%
Middle Distillates
34%
32%
33%
32%
32%
34%
37%
37%
35%
36%
Residual Fuel
9%
9%
9%
8%
9%
6%
6%
5%
4%
5%
Petrochemicals
3%
4%
4%
4%
4%
4%
3%
4%
4%
4%
Other
8%
9%
7%
8%
8%
9%
7%
7%
8%
8%
Less Refinery Fuel
-5%
-5%
-5%
-5%
-5%
-5%
-5%
-5%
-5%
-5%
* Excludes discontinued Tulsa refining operations.
Refining & Supply –
Products Manufactured |
 27
* Excludes discontinued Tulsa refining operations.
Refining & Supply –
Gasoline and Distillate Production
1Q09
2Q09
3Q09
4Q09
FY09
1Q10
2Q10
3Q10
4Q10
FY10
Total Refining & Supply
*
Gasoline Production, MB/D
350.0
370.3
346.0
365.5
357.9
306.3
343.1
357.9
339.9
337.0
RFG
46%
46%
55%
45%
48%
47%
48%
43%
45%
46%
Conventional
54%
54%
45%
55%
52%
53%
52%
57%
55%
54%
Distillate Production, MB/D
233.4
229.5
219.3
219.3
225.3
202.4
244.5
250.1
225.1
230.6
On-Road Diesel Fuel
47%
53%
56%
52%
52%
53%
66%
62%
52%
59%
Heating Oil / Off-Road Diesel
30%
22%
23%
25%
25%
28%
15%
18%
25%
21%
Jet Fuel
20%
23%
19%
21%
21%
17%
19%
19%
21%
19%
Kerosene/Other
3%
2%
2%
2%
2%
2%
0%
1%
2%
1% |
 28
Toledo 4-3-1 Benchmark
4 WTI Crude: NYMEX Futures Close + $2.00 for transportation*
3 Unleaded Gasoline: Chicago Pipeline Platt’s Low
1 Distillate: 50% ULSD Chicago Pipeline Platt’s Low
50% Jet Gulf Coast Pipe Platt’s Low**
Northeast 6-3-2-1 Value-Added Benchmark
6 Dated Brent Crude: Platt’s Mid + $2.25 for transportation*
3 Gasoline: 50% Unleaded RBOB NY Harbor Barge Platt's Low
50% Unleaded Regular Gasoline NY Harbor Barge Platt's Low
2 Distillate: 55% ULSD NY Harbor Barge Platt's Low
20% Jet/Kero NY Harbor Barge Platt's Low
25% No.2 Fuel Oil NY Harbor Barge Platt's Low
1 No. 6 0.3% Sulfur High Pour Resid: NY Harbor Barge Platt’s Low
1Q09
2Q09
3Q09
4Q09
FY09
1Q10
2Q10
3Q10
4Q10
FY10
Northeast 6-3-2-1
Value-Added Benchmark
5.32
5.23
4.10
3.85
4.62
6.09
5.91
4.22
6.05
5.57
Toledo 4-3-1
Benchmark
7.28
9.36
6.41
2.56
6.40
3.99
8.89
7.50
6.33
6.68
1Q09
2Q09
3Q09
4Q09
FY09
1Q10
2Q10
3Q10
4Q10
FY10
Northeast 6-3-2-1
at 80% weight
4.26
4.18
3.28
3.08
3.70
4.87
4.73
3.37
4.84
4.46
Toledo 4-3-1
at 20% weight
1.45
1.87
1.29
0.51
1.28
0.80
1.78
1.50
1.27
1.33
R&S Weighted Benchmark
5.71
6.05
4.57
3.59
4.98
5.67
6.51
4.87
6.11
5.79
* Benchmarks were updated in 1Q10 to reflect higher market crude transportation
costs and all prior periods were restated for these new transportation
costs. ** The Toledo benchmark was updated effective 1/1/2010 to include the
US Gulf Coast Jet component. However, prior to 2010, the benchmarks
were not restated for this change due to immateriality. Sunoco Refining
Weighted Benchmark Margin, $/B |
 29
Media releases and SEC filings are available
on
our
website
at
www.SunocoInc.com
Contact for more information:
Clare McGrory
(215) 977-6764
For More Information |