Attached files
| file | filename |
|---|---|
| 8-K - FORM 8-K - GEORESOURCES INC | d8k.htm |
 GeoResources, Inc
Corporate Profile
February 2011
Exhibit 99.1 |
 2
Forward-Looking Statements
Information included herein contains forward-looking statements that involve
significant risks and uncertainties, including our need to replace
production and acquire or develop additional oil and gas reserves, intense
competition in the oil and
gas
industry,
our
dependence
on
our
management,
volatile
oil
and
gas
prices and costs, uncertain effects of hedging activities and uncertainties of our
oil and gas estimates of proved reserves and reserve potential, all of which
may be substantial. In addition, past performance is no guarantee of
future performance
or
results.
All
statements
or
estimates
made
by
the
Company,
other than statements of historical fact, related to matters that may or will occur
in the future are forward-looking statements.
Readers are encouraged to read our December 31, 2009 Annual Report on
Form 10-K and Form 10-K/A and any and all of our other documents filed with
the SEC regarding information about GeoResources
for meaningful cautionary
language in respect of the forward-looking statements herein. Interested
persons are able to obtain free copies of filings containing information
about GeoResources, without charge, at the SEC’s
internet site (http://www.sec.gov).
There is no duty to update the statements herein. |
 3
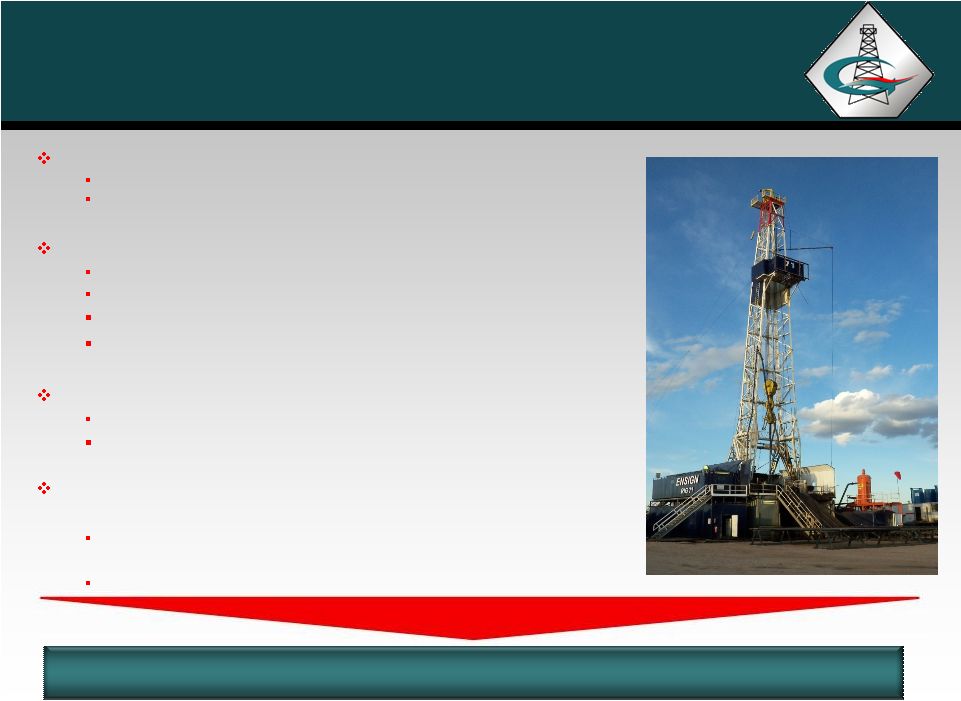
Corporate Highlights
Value Creation
Significant Bakken
and Eagle Ford upside
Strategically located in high rate of return resource plays
High level of operating control
Significant Bakken
Exposure
32,500 net operated acres
13,500 net non-operated acres
46,000 TOTAL ACRES
Continually Leasing
Rapidly expanding Eagle Ford Position
21,000 net acres
Commitment for additional leasing
Solid Proved Reserve and Production
Base
24
Mmboe
proved
reserves
(1)
(as
of
7/1/10)
are 56% oil
5,088 BOE/d average YTD Sept 2010
(1)
Does not include interests in affiliated partnerships. Reserves based on strip
pricing as of 6/30/10. See Additional Disclosures in Appendix. |
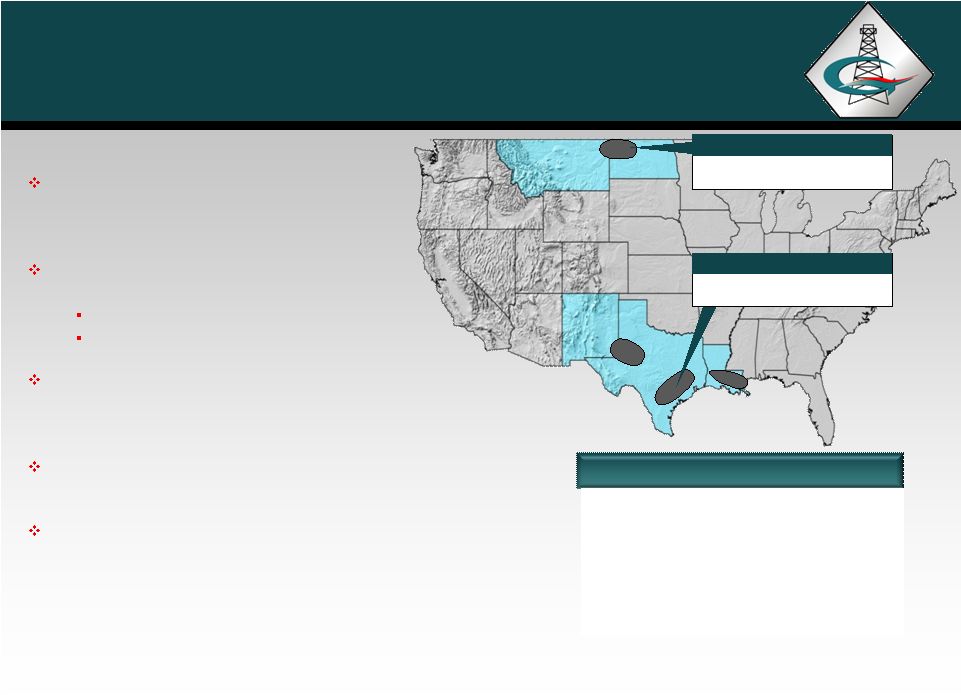 Company Overview
(1)
As of July 1, 2010. Excludes interests in two affiliated partnerships. Reserves
based on strip pricing at 7/1/10. See Additional Disclosures in
Appendix. (2)
Represents the Company’s average production rate for the nine months ending
September 30, 2010. (3)
Acreage information estimated as of December 31, 2010.
(4)
EBITDAX
is
a
non-GAAP
financial
measure.
Please
see
Appendix
for
a
definition
of
EBITDAX
and
a
reconciliation to net
income.
Bakken
46,000 net acres
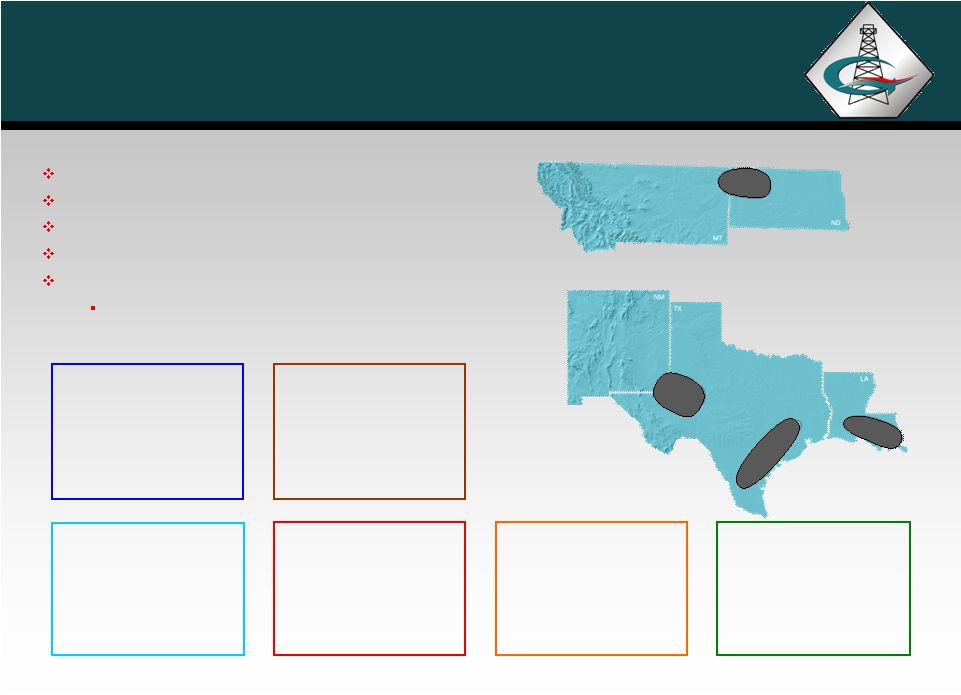
Company Highlights
(1,2,3)
Independent oil and natural gas
company focused in the Southwest,
Gulf Coast and Williston Basin
Significant upside potential through
growing positions in liquids-rich shales:
Bakken
–
46,000 net acres
Eagle Ford –
21,000 net acres
Nearly 60% of current production is oil
and expected to increase through near-
term development
Operate approximately 80% of proved
reserves
Last Quarter Annualized September 30,
2010
EBITDAX
of
$71
million
(4)
Eagle Ford
21,000 net acres
4
Proved Reserves (MMBOE)
24.0
Oil (reserves)
56%
Proved Developed
73%
Production (Boepd)
5,088
Oil (production)
56%
Operated
80%
Net Acreage
269,770 |
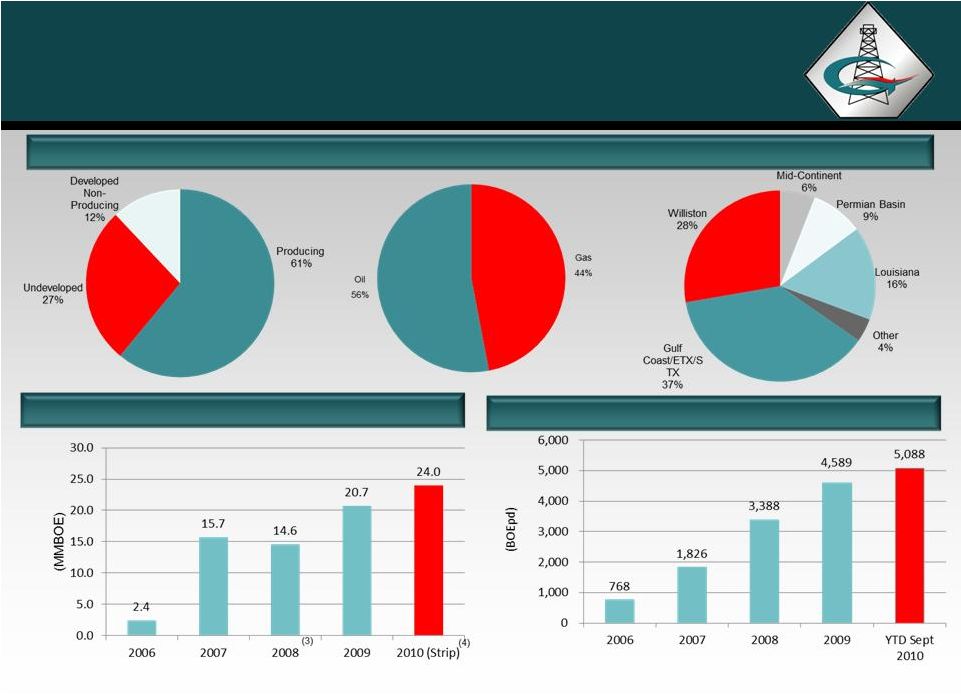 5
Proved Reserves (MMBOE)
(2)
Average Daily Production (BOEpd)
Reserves and Production
Current
Proved
Reserves
–
24.0
MMBOE
(1)
(1) As
of
July
1,
2010.
Excludes
partnership
interests.
(2)
2006
–
2009
proved
reserves
based
on
SEC
guidelines.
(3) 2008 Reserves reflect lower prices and divestitures. (4)
7/1/10 reserves based on NYMEX strip as of 6/30/10. See Additional Disclosures in Appendix. |
 Oil Weighted
Development
GeoResources Asset Overview |
   7
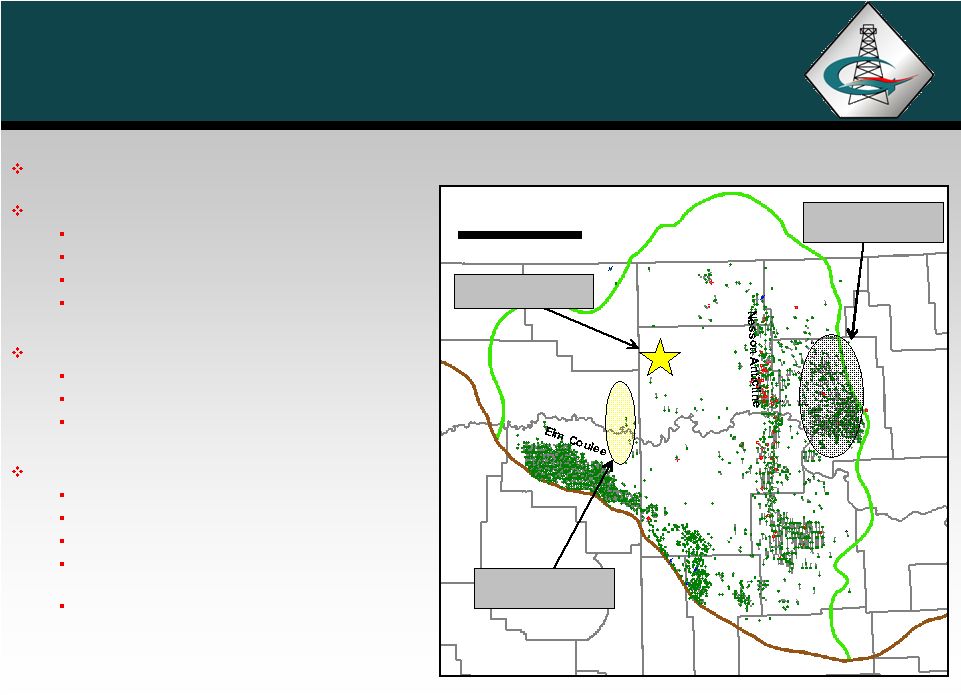
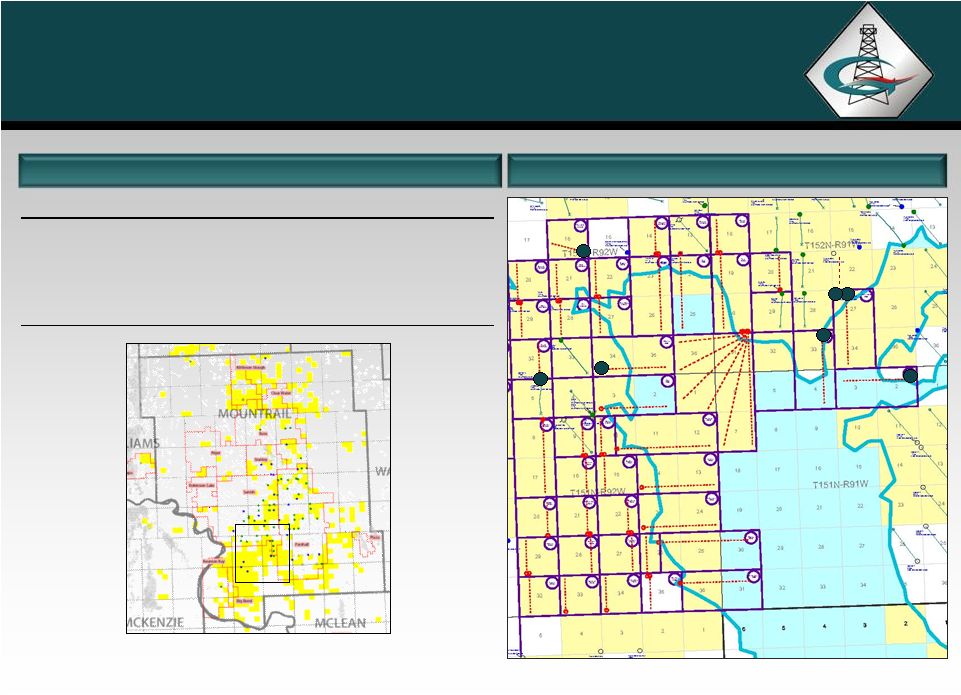
Bakken Shale Overview
46,000 Net Acres in the Bakken
Bakken Operated Project
24,000 net acres in Williams County, ND
Retained 47.5% WI and operations
Drilling started in September 2010
Lease in 82 drilling units (1,280 acres)
Bakken Non-Operated Project
Partnered with Slawson Exploration Company
13,000 net acres in Mountrail County, ND
Currently, four rigs operating by Slawson
Eastern Montana
9,000 net acres in Roosevelt/Richland Co., MT
7,500 operated / 1,500 non-operated acres
16 operated 1,280 acre units
Participating with Slawson in the Renegade 1-
10H & Battalion 1-3H with 25% WI
Participating with Brigham in the Swindle 16-9
#1H with a 9.3% WI
CANADA
ND
MT
50 miles
Williams
County
Parshall
Sanish
7
Roosevelt
County
Note: Information, except for map, as of December 31, 2010. Red/green symbols
in map depict permitted or drilled locations. Non-Operated
Project
Operated Project
Eastern
Montana Project |
 8
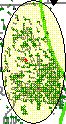
Bakken Shale -
Non-operated
Bakken Shale
Note: Yellow-highlighted areas represent the Company’s acreage
position. Partnered with experienced operator -
Slawson Exploration
13,000 net acres with working interests
ranging from 10% to 18%
Slawson has four rigs running currently and
has drilled over 75 wells
Additional opportunities:
Slawson and others evaluating
appropriate Bakken spacing and infill
drilling with several drilling units
containing second wells
Slawson evaluating Three Forks
potential with one producer and one
well waiting to frac
Encouraging offset Three Forks results
by EOG and Whiting where GEOI has
minor WI
8
Note: Information, except for map, as of December 31, 2010.
|
    Note:
Information as of December 31, 2010. Yellow-highlighted areas in maps represent the Company’s acreage position.
(1)
Initial Production
(bopd)
(24
hour
rate)
is
defined
as
the
peak
oil
volume
produced
on
a
daily
basis
through
permanent
production
facilities
that
occur
within
the
first
few
days
of
initial
production
from
the well.
(2)
Cannonball
Federal
#1-27-34H
had
only
half
of
the
frac
completed.
Remaining
stages
to
be
completed
at
a
later
date.
(3)
Jericho
Federal
#2-5H-TF
had
less
than
50%
of
the
stages
frac’d
correctly
due
to
mechanical
problems
with
the
stimulation
sleeves.
Bakken
Shale -
Non-operated Activity
Mountrail County Sample 2010 Wells
6
7
4
2
5
3
1
Non-Operated 2010 Sample Drilling Results
9
Map
#
Well Name
Spacing
(Acres)
Frac
Stages
24-hour IP
(1)
Bbls/d
30 Day Avg.
Bbls/d
60 Day Avg.
Bbls/d
1
Atlantis Federal #1-34-35H
1,280
40
1,424
1,179
1,018
2
Cannonball Federal #1-27-34H
(2)
1,280
19
1,517
871
637
3
Jericho #2-5H-TF
(3)
640
21
310
235
203
4
Lunker
Federal #1-33-4H
1,280
40
650
356
413
5
Sauger
Federal #1-22H
640
21
1,597
1,231
1,020
6
Tarantula #1-16H
640
21
1,010
623
494
7
Shad Federal #1-2-3H
1,280
41
1,034
569
471 |
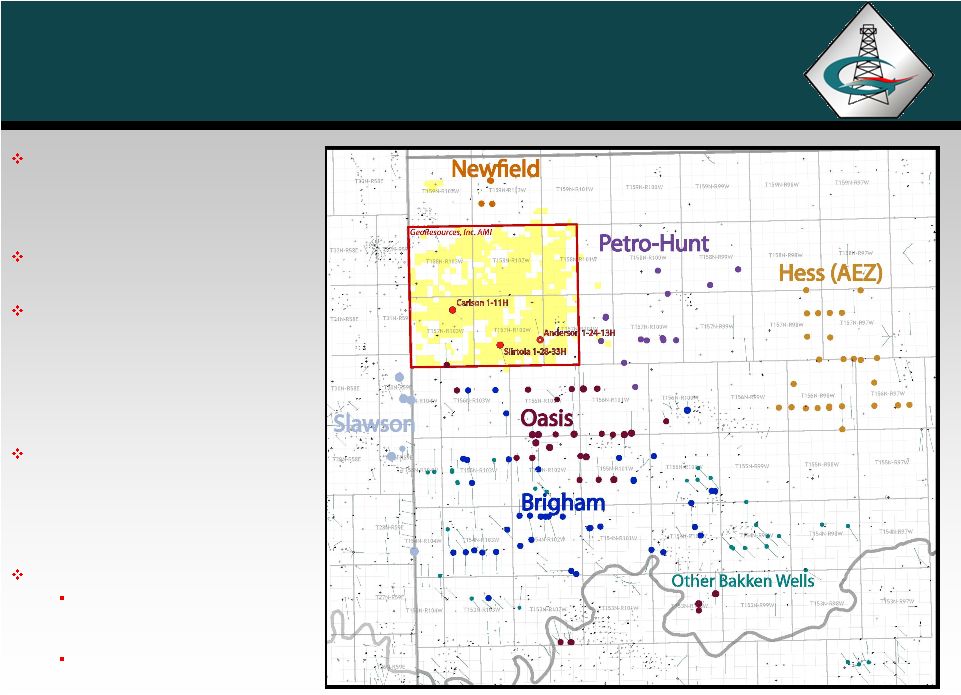 Bakken Shale -
Operated
24,000 Net Acres with 47.5% WI
and operations in Williams
County
Interests in 82 spacing units
First well, Carlson #1-11H (640
acre unit, short lateral) on
production at an IP of 685 bopd
and an estimated completed
well cost of $5.6 million
Second and third wells are 1280
units with long laterals; both are
waiting on frac; Siirtola 1-28-
33H, Anderson 1-24-13H
Positive Offsetting Activity
9 nearest southern offsets
have NDIC-reported initial
rates of 972-1,947 BOPD
4-5 rigs drilling within or
offsetting our AMI
10 |
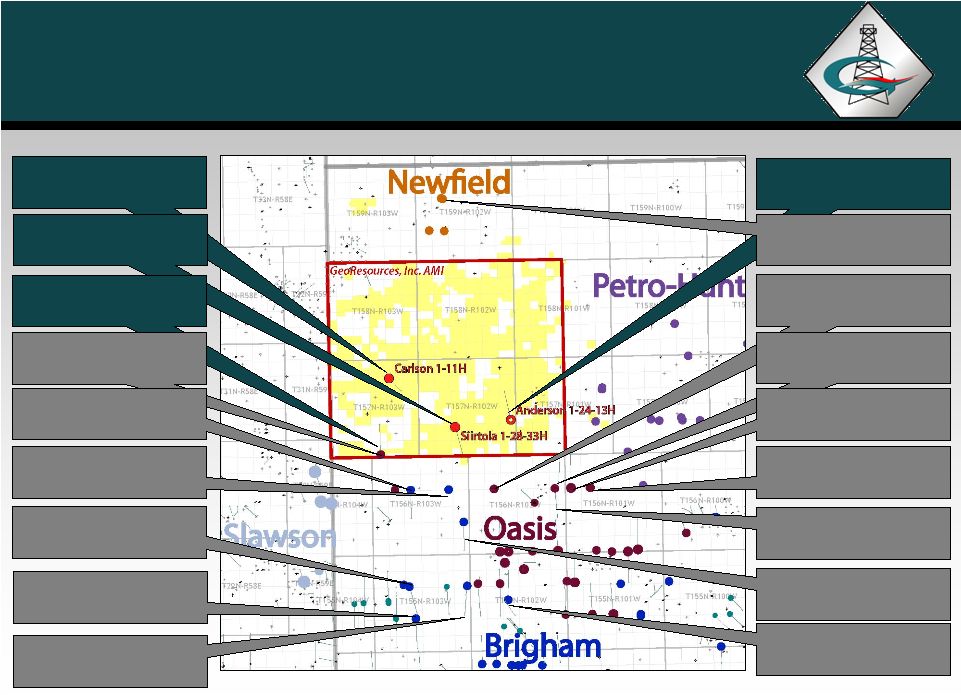 Bakken Shale -
Activity
11
11
Carlson 1-11H
IP: 685 Bo/d
(640 ac. unit -
short lateral)
Anderson 1-24-13H
Est. Frac in March 2011
Siirtola 1-28-33H
Est. Frac in February 2011
NFX: Christensen 159-102-17-
20-1H
Drilling
BEXP: Sukut 28-33
IP: 1,959 Boe/d
OAS: Grimstvedt 42-34H
Waiting on Compl. Results
GEOI WI = 3.3%
BEXP: Lee 16-21
IP: 1,544 Boe/d
OAS: Somerset 5602 12-17H
IP = 1,109 Boe/d,
Ellis 12-17H = 1,057 Boe/d
BEXP: Kalil Farm 14-23H &
McMaster 14-23H
Waiting on Compl. Results
OAS: Bean 5703-42-34
Waiting on Completion
Results
BEXP: Arnson 13-24
IP: 1,339 Boe/d
BEXP: BCD Farms 16-21
IP: 1,776 Boe/d
BEXP: Strand 16-9
IP: 2,265 Boe/d
OAS: Njos Federal
IP: 2,080 Boe/d
BEXP: Kalil 25-36#1H
IP: 1,586 Boe/d
OAS: Baffin 5601 12-18H
Drilling
OAS: Devon 5601 12-17H &
Glover 5601 12-17H
Waiting on Compl. Results
OAS: Sandaker 11-13H
IP: 1,407 Boe/d
Note: Carlson 1-11H well is the only 640 acre unit, short lateral well
referenced on the map. |
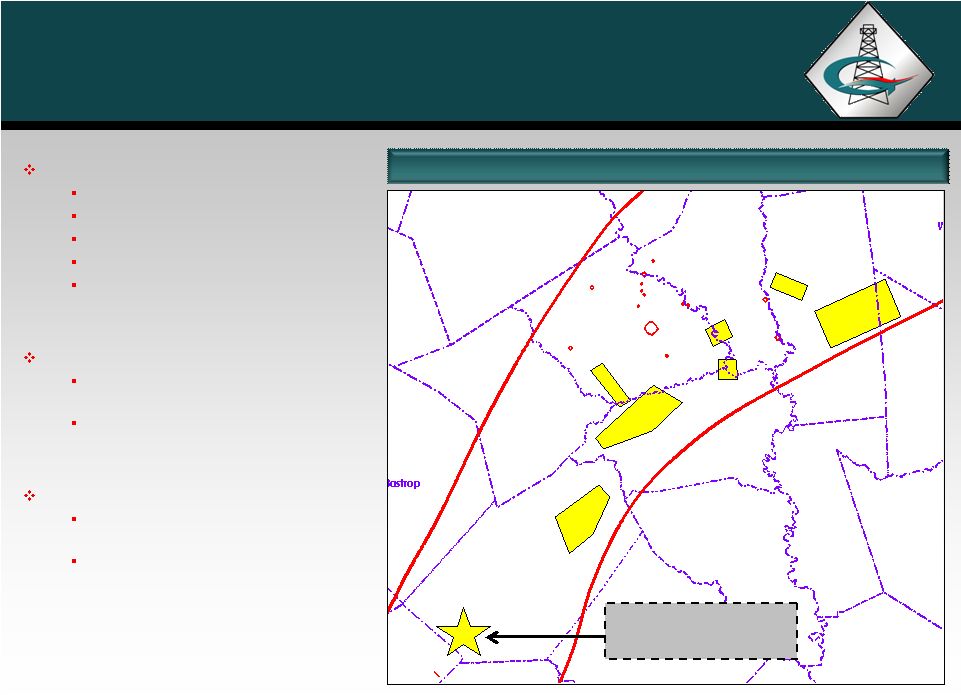
 Eagle Ford Shale
12
Eagle Ford Acreage has
increased to 21,000 net acres
Eagle Ford AMI
South West Fayette County
Ramshorn
Investments, Inc., an
affiliate of Nabors Industries, Ltd.
purchased a 50% interest
Made upfront cash payment
Will fund six horizontal wells
GEOI retains 50% WI and
operations
Joint commitment for additional
leasing
Eagle Ford Expansion
Acquired additional acreage in
Atascosa, Gonzales, & McMullen
counties
Note: Information, except for map, as of December 31, 2010.
GULF OF MEXICO |
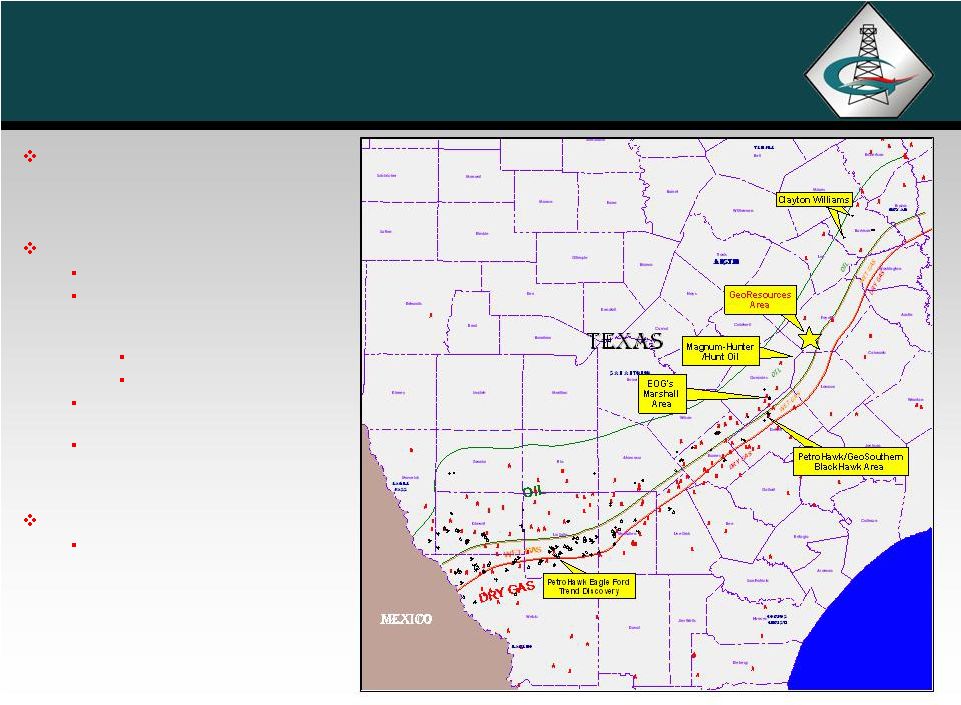
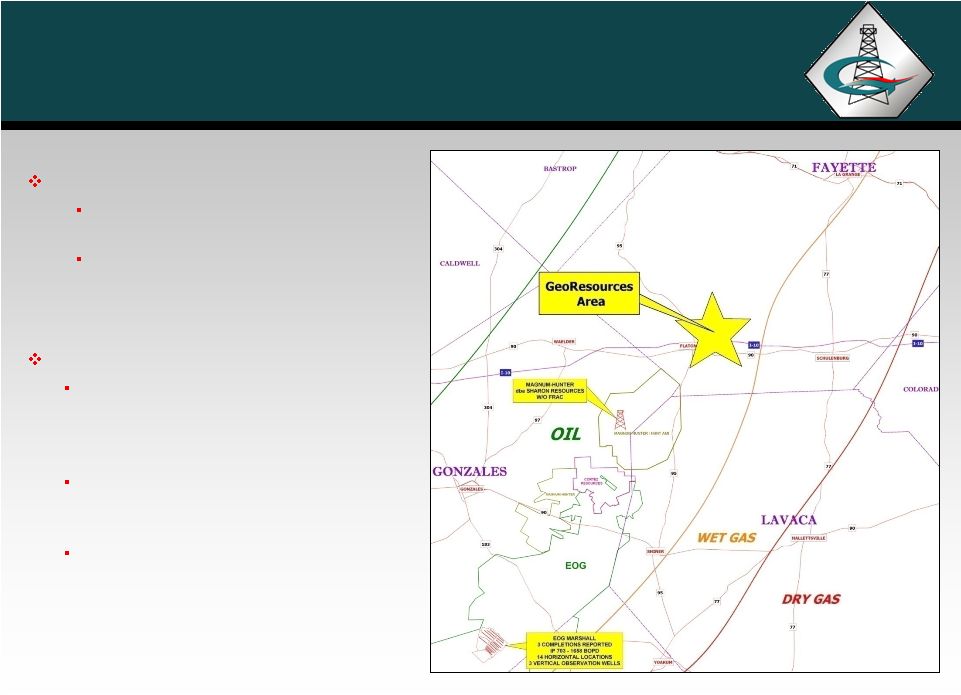 Eagle
Ford Shale 13
Volatile oil / gas condensate window
On strike with operator activity in
Gonzales Co.
Spud first well in Fayette County,
Flatonia East Unit #1-H, on January
10, 2011
Positive offset operator activity
Magnum Hunter has completed two
wells in Gonzales Co. with Initial
Production (IP) from 600 boepd to
1,335 boepd.
EOG has multiple completions in
Gonzales Co. with IPs ranging from
700 to 2,000 bopd.
Clayton Williams has completed 3 wells
to the NE with a 4th well completing
located in Burleson and Lee Co. IPs
range from 234 to 492 bopd. |
 Development Economics
(2)
(1)
Assumes Bakken
and Eagle Ford oil differentials of 15% and 5%, respectively. Natural gas
price held constant at $5/Mcf. (2)
EUR
refers
to
management’s
internal
estimates
of
reserves
potentially
recoverable
from
producing
wells.
These
EURs
are
not
classified
as
Proved
Reserves
under
the
SEC
definitions
and
as
such
are
not
included
in
the
current
reserve
report.
14
Bakken
Shale (Williams Co., North Dakota)
Eagle Ford Shale (Fayette Co., Texas)
350 MBO EUR
500 MBO EUR
700 MBO EUR
350 MBOE EUR
500 MBOE EUR
Well Assumptions
Drill & Completion cost ($M$)
$6,500
$6,500
$6,500
$7,000
$7,000
Lateral Length (feet)
10,000
10,000
10,000
5,000
5,000
WI
100%
100%
100%
100%
100%
NRI
80%
80%
80%
82.5%
82.5%
IP (Bopd)
500
800
1,100
500
1,000
Econ. @ $80/Bbl and $5/Mcf
(1)
NPV @ 10%
$2,812
$7,667
$12,034
$4,784
$10,591
IRR
25%
72%
89%
45%
237%
Payout (yrs)
3.0
1.3
1.2
1.8
0.9
ROI
2.2
3.3
4.9
2.4
3.5
Price
Sensitivity
(IRR)
(1)
$90/Bbl (WTI)
34%
91%
150%
57%
337%
$80/Bbl (WTI)
25%
72%
89%
45%
237%
$70/Bbl (WTI)
18%
55%
69%
33%
111%
$60/Bbl (WTI)
12%
40%
52%
23%
69% |
 Additional Assets |
 16
Giddings Field –
Austin Chalk
29,000 net acres
16 wells drilled
–
100% success
20 additional drilling locations
WI ranges from 37%
-
53%
Operating control
Majority of acreage Held-by-
Production
Eastern Giddings Development Area
Eastern acreage in Grimes and
Montgomery Counties is dry gas
Western acreage is liquids-rich gas
and condensate
Additional Upside Includes:
Eagle Ford, Georgetown and
Yegua
potential
Rate increase potential from slick
water fracture stimulations
16
APACHE
APACHE
APACHE
APACHE
APACHE
CWEI
CWEI
MAGNUM-HUNTER
Lee
Washington
Waller
Fayette
Austin
Colorado
Milam
Brazos
Grimes
Burleson
Giddings Field Acreage
Eagle Ford Area of
Mutual Interest |
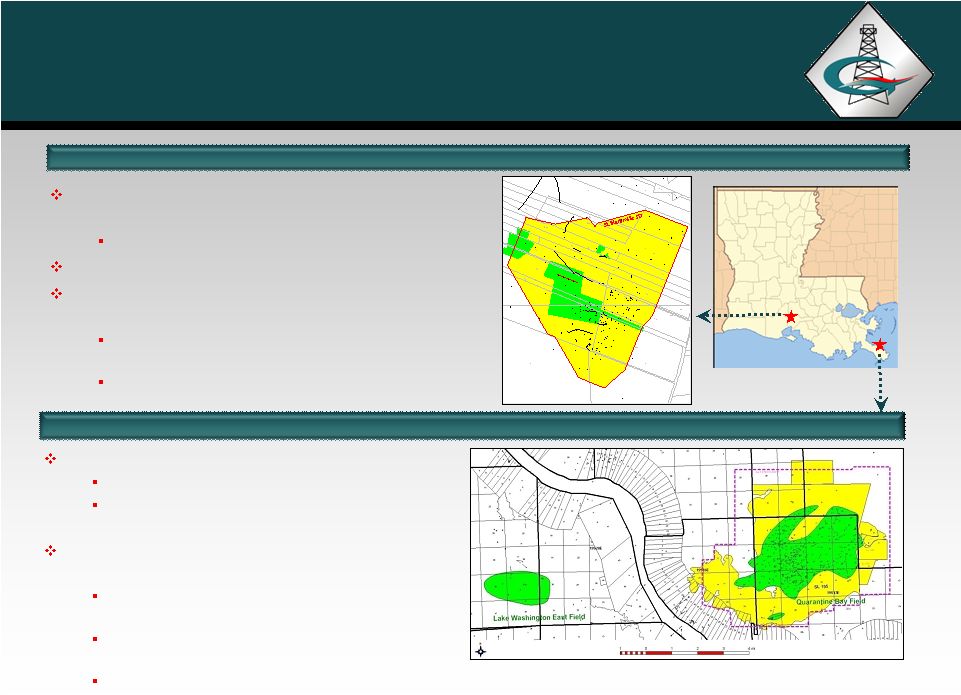 Louisiana -
St. Martinville
St. Martinville
& Quarantine Bay
& Quarantine Bay
2,585 net acres of HBP or leased (yellow),
534 net acres of owned minerals (green)
Average WI of 97% and NRI of 91%
November 2010 cash flow over $200,000
Multiple exploration and development
objectives from 3,000’
–
10,000’
Cumulative shallow production of 15.2
MMBO and 16.6 BCFG
Cumulative production over 125 Bcfe
at
10,000’
LOUISIANA
Quarantine Bay Field
St. Martinville
Field
14,000 gross acres (13,000 HBP)
33% WI below major field plays
Cumulative production of 180 MMBO and 285
BCF
Significant deep exploration potential (11-
25,000’); plus sub-salt potential
Pelican prospect: 1.3 MMBO + 10 BCFG at
~11,500’
Prospect DN: 16.0 MMBO + 40 BCFG at
~16,500’
Additional deeper prospects
126
1
1
1
2
3
4
5
3-1
2
1
1
2
1
1
2
1
2
3
3
3ST1
2
1
1
2
1
1
1
1
1
2
1
1
1
2
31
1
51
3
4
1
4111
211
1
1
131
221
1
1
1
1B
6A
1211
3
3
21
4
1
1
4
1
51
31
2
¹
1
1
9A
14A
15A
11A32A
10A
13A4A
12A17A24A46A
3A1A37A
5A
16A37A
7A
21
4C
1
2
1
3
1
2
2
1
1
1
5
7D
6D
8A
6
1
2
1
3
7
5
4
1C
1
1D
11²
¹
1
2A
18A31A
19A
1
20A
21A
22A
1
1
2
23A
1
8
9
3
2
10
11
1
3
¹1²
12
13
1
1
25A
1
2
3
1
14
4
15
16
1
1
2
17
6
1
6
2
18
1
234
3
19
¹
1E
20
4
26A39A
2
27A
¹234
28A
1
5E
21
2
1
29A
8D
1
1
2
30A
1
1D
²
²34
9D
33A
6
22
1
34A
35A
7
8
1
10D
4
38A
41A
36A
40A
1
5
7
42A
43A
1
1
7
8
9
2E
44A
1
1
45A
5
1
1
1
47A(2)
¹
6
48A52A
49A
50A
54
1
51A
1
²
7
53
1
A-53
17 |
 Financial Overview |
 Development Program
Project
Budgeted
Comments
Bakken
Operated
$29.5
18 wells + completions
of 2010 drilling
Non-Operated
21.0
Slawson 3 rig program
+ minor interest wells
Eagle Ford
15.8
6 Carried Interest wells
+ 7 additional wells
Giddings & LA
16.1
Giddings = 3 wells
LA = 8 wells
Acreage & Seismic
25.0
Other
6.6
Non-Operated Drilling
+ Operations Capital
TOTAL
$114.0
2011 Capital Budget
Budget recently increased to take
advantage of leasing success and strong
project inventory
2011 budget increased from $88 MM to
$114 MM
2012 budget estimated at $173 MM
Current project allocations favor lower-risk,
high cash flow oil projects
Project inventory allows flexibility
Weighted towards oil and liquids
Oil and gas projects in inventory
Exploration and development projects in
inventory
Held by long-term leases or production
Capital Allocations
($ in millions)
19 |
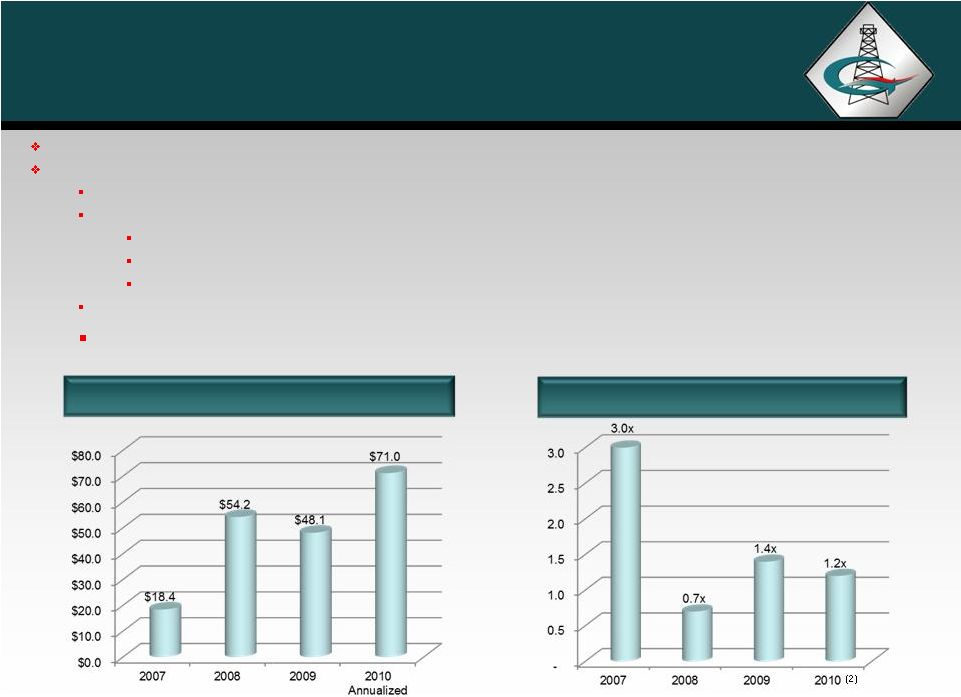 Debt / EBITDAX
EBITDAX
20
Can fund current CapEx
with cash flow and debt capacity
Conservative use of leverage to maintain strong balance sheet
$145 Million borrowing base
EBITDAX
(1)
:
3rd Quarter = $17.7 Million
YTD 2010 = $53.3 Million
Annualized = $71.0 Million
Total debt of $87.0 million December 2010.
No debt after January 2011 Equity Raise.
Strong Financial Position
($ in millions)
(1) EBITDAX is a non-GAAP financial measure. See reconciliation of net
income to EBITDAX following in Appendix. (2) December 2010 debt / Annualized 2010 EBITDAX.
(2) |
 Investment Highlights
Value Creation
Significant upside through Bakken
and Eagle Ford shale positions
Bakken
Shale
-
46,000
net
acres
Eagle
Ford
Shale
-
21,000
net
acres
Ongoing leasing program to further expand acreage
Solid proved reserve and production base
24
MMBOE
of
proved
reserves
(1)
with
bias
towards
liquids
High level of operating control
Additional upside identified in conventional assets
Strong financial position to execute development plans
Significant free cash flow from existing assets to invest in shale
development Unlevered balance sheet post offering
Experienced management and technical staff with large ownership stake
Successful track record of creating value and liquidity for shareholders
Board and management own approximately 21% of the company
(1)
Does not include interests in affiliated partnerships. Reserves based on strip
pricing as of 6/30/10. See Additional Disclosures in Appendix. 21
Cost effective operator with significant operating experience in unconventional resource plays
|
 Appendix |
 23
Management History
2004-
2007
Southern Bay Energy, LLC
Gulf Coast, Permian Basin
REVERSE MERGED INTO
GEORESOURCES, INC.
2000-2007
Chandler Energy, LLC
Williston Basin, Rockies
ACQUIRED BY
GEORESOURCES, INC.
1988-2000
Chandler Company
Rockies, Williston Basin
MERGED INTO
SHENANDOAH THEN SOLD
TO QUESTAR
1992-1996
Hampton Resources Corp
Gulf Coast
SOLD TO BELLWETHER
EXPLORATION
Preferred investors –
30% IRR
Initial investors –
7x return
1997-2001
Texoil
Inc.
Gulf Coast, Permian Basin
SOLD TO OCEAN ENERGY
Preferred investors –
2.5x return
Follow-on investors –
3x return
Initial investors –
10x return
2001-2004
AROC Inc.
Gulf Coast, Permian Basin, Mid-Con.
DISTRESSED ENTITY LIQUIDATED
FOR BENEFIT OF INITIAL
SHAREHOLDERS
Preferred
investors
–
17% IRR
Initial
investors
–
4x return
Track record of profitability and liquidity
Extensive industry and financial relationships
Significant technical and financial experience
Long-term repeat shareholders
Cohesive management and technical staff
Team has been together for up to 21
years through multiple entities |
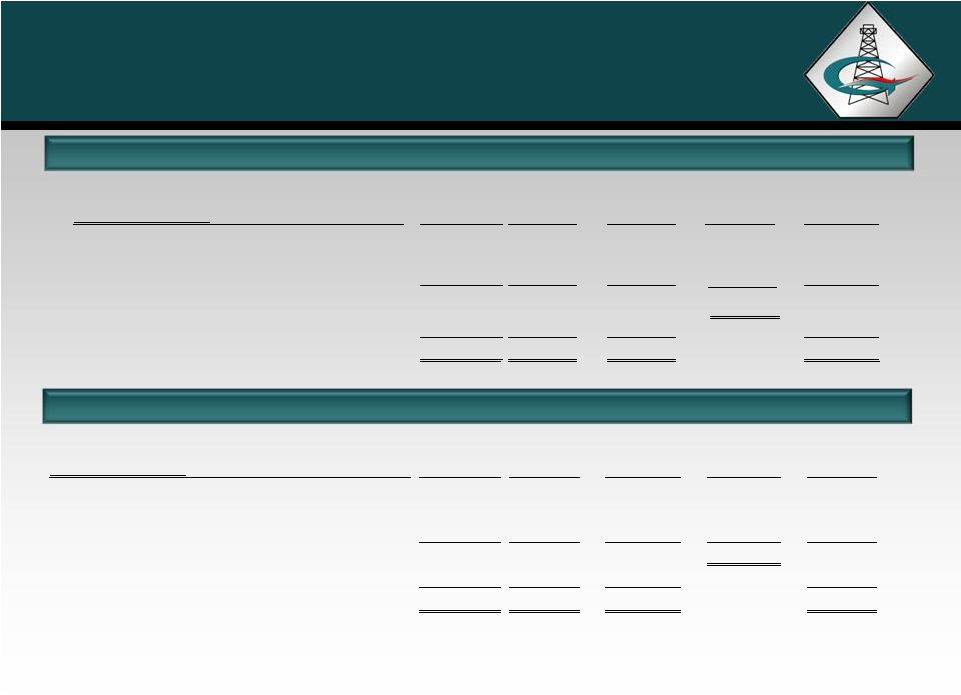 Proved
Reserves
–
SEC Pricing at 7/1/10
Proved Reserves -
Strip Pricing at 7/1/10
24
Proved Reserves
(1)
($ in millions)
Oil
Gas
Total
% of
Corporate Interests
MMBO
BCF
MMBOE
Total
PV-10
PDP
8.3
37.4
14.6
60.8%
$246.0
PDNP
2.1
5.4
3.0
12.5%
63.0
PUD
3.1
20.3
6.4
26.7%
74.8
Total Proved Corporate Interests
13.5
63.1
24.0
100.0%
383.8
Partnership Interests
0.1
9.1
1.6
16.8
Total Proved Corporate and Partnerships
13.6
72.2
25.6
$400.6
24
(1) As of July 1, 2010. PV-10% is a non-GAAP financial measure.
See reconciliation of SEC PV 10% to standardized measure in Appendix. See Additional Disclosures in Appendix.
($ in millions)
Oil
Gas
Total
% of
Corporate Interests
MMBO
BCF
MMBOE
Total
PV-10
PDP
8.4
35.1
14.2
61.5%
$209.9
PDNP
2.1
5.0
3.0
13.0%
54.3
PUD
3.0
17.0
5.9
25.5%
54.9
Total Proved Corporate Interests
13.5
57.1
23.1
100.0%
319.1
Partnership Interests
0.1
8.0
1.4
11.2
Total Proved Corporate and Partnerships
13.6
65.1
24.5
$330.2 |
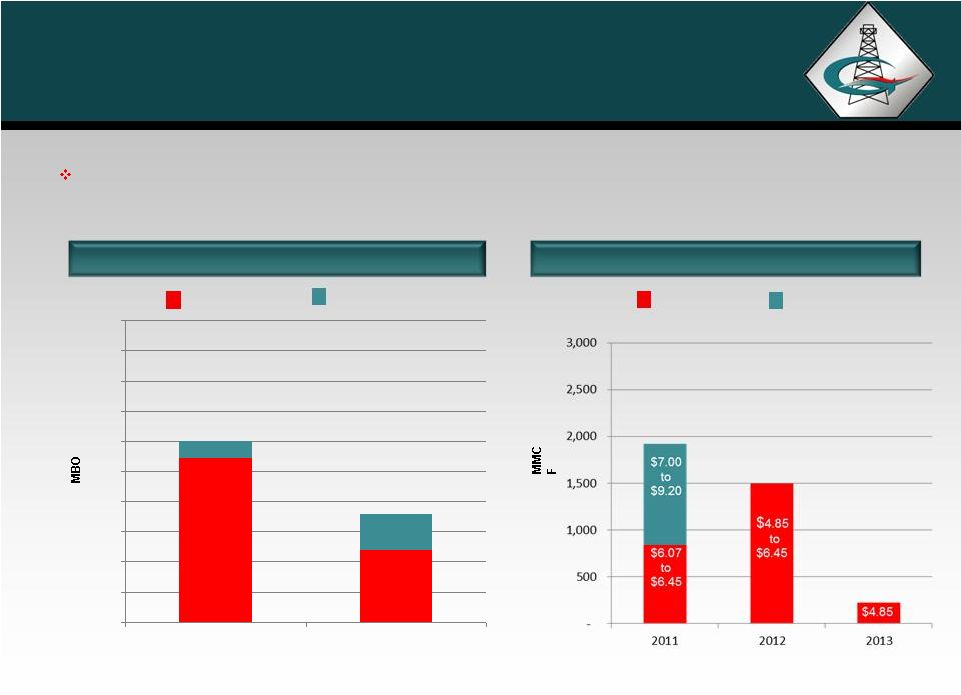 Natural Gas Hedges
Oil Hedges
Hedge Portfolio
GEOI uses commodity price risk management in order to execute its business plan
throughout commodity price cycles.
Swaps
Swaps
Collar
25
0
100
200
300
400
500
600
700
800
900
1000
2011
2012
$74.37
to
$88.45
$86.85
to
$87.22
$85.00 to
$106.08
Collar
$85 .00 to
$110.00 |
 26
Operating Performance
Historical Operating Data
Nine Months 2010
3rd Qtr. 2010
2009
2008
Key Data:
Average realized oil price ($/Bbl)
70.51
$
70.43
$
61.09
$
82.42
$
Avg. realized natural gas price ($/Mcf)
5.39
$
5.74
$
3.97
$
8.12
$
Oil production (MBbl)
780
276
851
743
Natural gas production (MMcf)
3,656
1,076
4,944
2,962
(millions except for per share amounts)
Total revenue
79.9
$
26.9
$
80.4
$
94.6
$
Net income before tax
27.4
$
10.3
$
14.8
$
21.3
$
Net income after tax
18.2
$
7.6
$
9.8
$
13.5
$
Earnings per share (diluted)
0.90
$
0.38
$
0.59
$
0.86
$
EBITDAX
(1)
53.2
$
17.7
$
48.2
$
54.2
$
26
(1) EBITDAX is a non-GAAP financial measure. See reconciliation of
net income to EBITDAX in Appendix. |
 As used herein,
EBITDAX is calculated as earnings before interest, income taxes, depreciation, depletion and amortization, and exploration expense and further
excludes non-cash compensation, impairments, hedge ineffectiveness and income or loss on
derivative contracts. EBITDAX should not be considered as an alternative to net income (as an
indicator of operating performance) or as an alternative to cash flow (as a measure of liquidity or ability to service debt obligations)
and is not in accordance with, nor superior to, generally accepted accounting principles(GAAP), but
provides additional information for evaluation of our operating performance.
27
EBITDAX Reconciliation
27
Nine Months
3rd Qtr.
Years Ended December 31,
(in millions)
2010
2010
2009
2008
Net income
18.2
7.6
9.8
13.5
Add back:
Interest expense
3.9
1.4
5.0
4.8
Income taxes
9.3
2.6
5.1
7.8
Depreciation, depletion and amortization
18.5
6.2
22.4
16.0
Hedge and derivative contracts
(1.0)
(0.6)
0.3
0.4
Noncash compensation
0.8
0.3
1.4
0.7
Exploration and impairments
3.5
0.2
4.2
10.9
EBITDAX
53.2
17.7
48.2
54.1
$
$
$
$
$
$
$
$ |
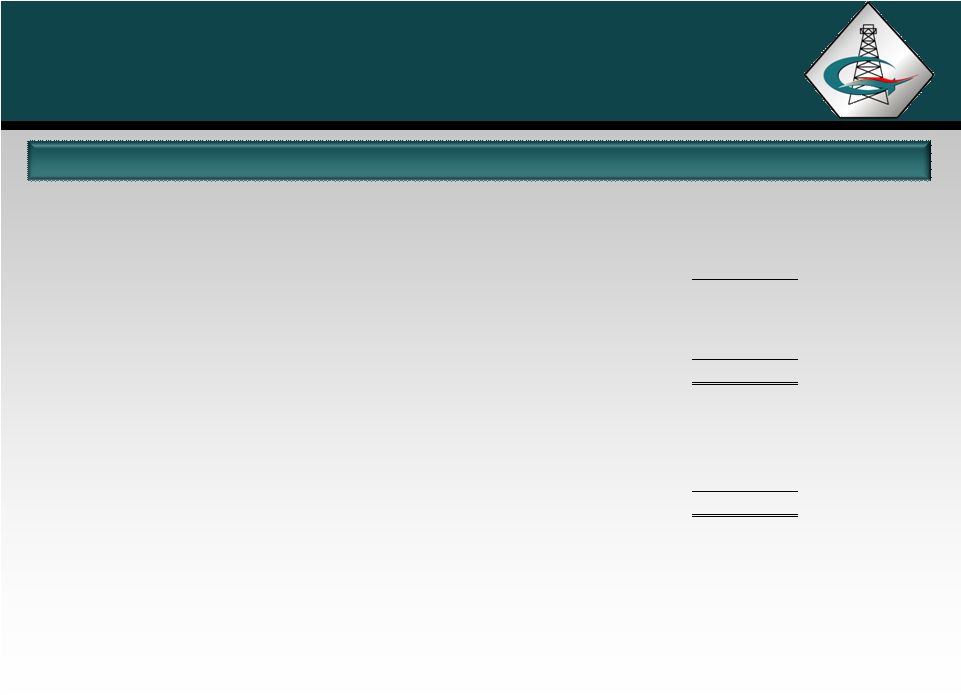 Standardized Measure
SEC PV-10 Reconciliation to Standardized Measure
(1)
(1)
PV-10%
is
not
a
measure
of
financial
or
operating
performance
under
GAAP,
nor
should
it
be
considered
in
isolation
or
as
a
substitute
for
the
standardized
measure
of
discounted
future
net
cash
flows
as
defined
under
GAAP.
Our
calculations
of
PV-10%
and
standardized
measure
of
discounted
future
net
cash
flows
at
July1,
2010
are
based
on
our
internal
reserve
estimates,
which
have
not been reviewed or audited by our independent reserve engineers.
(2)
Through two affiliated partnerships.
($ in millions)
7/1/2010
Direct interest in oil and gas reserves:
Present value of estimated future net revenues (PV-10%)
$319.1
Future income taxes at 10%
(77.6)
Standardized measure of discounted future net cash flows
$241.5
Indirect
interest
in
oil
and
gas
reserves:
(2)
Present value of estimated future net reserves (PV-10%)
$11.2
Future income taxes at 10%
(3.9)
Standardized measure of discounted future net cash flows
$7.3 |
 29
Additional Disclosures
29 |