Attached files
| file | filename |
|---|---|
| 8-K - FORM 8-K - Bristow Group Inc | d8k.htm |
 Third Quarter FY 2011 Earnings Presentation
Bristow Group Inc.
February 3, 2011
Exhibit 99.1 |
 Third quarter earnings call agenda
•
Introduction
(Linda
McNeill,
Investor
Relations
Manager)
•
CEO
Remarks
(Bill
Chiles,
President
and
CEO)
•
Financial
highlights
(Jonathan
Baliff,
SVP
and
CFO)
•
Operational
highlights
(Bill
Chiles,
President
and
CEO)
•
Questions
and
answers
2 |
 Forward-looking statements
This
presentation
may
contain
“forward-looking
statements”
within
the
meaning
of
the
Private
Securities
Litigation
Reform
Act
of
1995.
Forward-looking
statements
include
statements
about
our
future
business,
operations,
capital
expenditures,
fleet
composition,
capabilities
and
results;
modeling
information,
expected
operating
margins
and
other
financial
projections;
plans,
strategies
and
objectives
of
our
management,
including
our
plans
and
strategies
to
grow
earnings
and
our
business,
our
general
strategy
going
forward
and
our
business
model;
expected
actions
by
us
and
by
third
parties,
including
our
customers,
competitors
and
regulators;
our
use
of
excess
cash;
the
valuation
of
our
company
and
its
valuation
relative
to
relevant
financial
indices;
assumptions
underlying
or
relating
to
any
of
the
foregoing,
including
assumptions
regarding
factors
impacting
our
business,
financial
results
and
industry;
and
other
matters.
Our
forward-looking
statements
reflect
our
views
and
assumptions
on
the
date
of
this
presentation
regarding
future
events
and
operating
performance.
They
involve
known
and
unknown
risks,
uncertainties
and
other
factors,
many
of
which
may
be
beyond
our
control,
that
may
cause
actual
results
to
differ
materially
from
any
future
results,
performance
or
achievements
expressed
or
implied
by
the
forward-looking
statements.
These
risks,
uncertainties
and
other
factors
include
those
discussed
under
the
captions
“Risk
Factors”
and
“Management’s
Discussion
and
Analysis
of
Financial
Condition
and
Results
of
Operations”
in
our
Annual
Report
on
Form
10-K
for
the
year
ended
March
31,
2010
and
Quarterly
Report
on
Form
10-Q
for
the
quarter
ended
December
31,
2010.
We
do
not
undertake
any
obligation,
other
than
as
required
by
law,
to
update
or
revise
any
forward-looking
statements,
whether
as
a
result
of
new
information,
future
events
or
otherwise.
3 |
 Chief Executive comments
Bill
Chiles,
President
and
CEO |
 5
Operational safety review
Air Accident Rate* per 100,000 Flight Hours
(Fiscal Year)
1.17
0.78
0.78
0.00
0.53
0.00
0.00
1.00
2.00
2006
2007
2008
2009
2010
2011 YTD
FY11 Total Reportable Injury Rate per
200,000 manhours (cumulative)
0.32
0.16
0.52
0.40
0.32
0.39
0.33
0.34
0.34
0.00
0.50
1.00
A
M
J
J
A
S
O
N
D
J
F
M
FY11 Lost Work Case Rate per 200,000
manhours (cumulative)
0.00
0.00
0.21
0.16
0.13
0.16
0.14
0.13
0.15
0.00
0.50
A
M
J
J
A
S
O
N
D
J
F
M
* Includes commercial operations only |
 3Q
FY2011 highlights 6
•
YTD Earnings per share of $2.77
•
19.4% increase from 9 months ended 3QFY10
•
YTD Operating income of $139.9M
•
1.3% increase from 9 months ended 3QFY10
•
YTD EBITDA of $200M
•
Relatively flat from 9 months ended 3QFY10
•
Improving margins for most of our business units with strength in Europe, West
Africa and Other International.
•
Tax benefit in 3Q FY2011 primarily due to reversal of deferred tax balances
recorded in prior fiscal years ($0.45 and $0.47 EPS benefit in 3Q and YTD).
•
No aircraft sales.
•
3Q Earnings per share of $1.13
•
6.6% increase from 2QFY11
•
52.7% increase from 3QFY10
•
3Q Operating income of $46.6M
•
12.9% decrease from 2QFY11
•
17.4% increase 3QFY10
•
3Q EBITDA of $65.6M
•
12% decrease from 2QFY11
•
1.8% increase from 3QFY10 |
 •
Oil price strength continues for multiple reasons
•
Overall international Exploration & Production (E&P) capital
expenditure and operating expenditure growth
•
Recovered in calendar 2010, modest in 2011, and expanding in 2012
•
Balanced across non-U.S. geographies although U.S. is challenged
•
International deepwater exhibiting particularly robust activity
•
This E&P confidence is reflected in improved helicopter tender
activity, principally for FY 2012/2013 work
•
Although
activity
and
prospects
are
improving,
there
is
softness
in
aftermarket
for
helicopters
Current market environment
7 |
 Operational performance highlights
•
Europe
Revenue is higher year over year due to better contracting with better operational
margins due to efficiency gains and higher equity earnings
•
West Africa
Revenue down, but margins are intact through lower costs even though the lost
contract is not fully offset yet.
•
Australia
Revenue increased year over year; however, the competition refocused in recognition
of the increase in medium/long term opportunities. Higher compensation costs
drove lower EBITDA. •
Other International
Lider
performing well with cash dividend paid; however, near term still materializing at
a slower pace. Offset by brisk improvement in
other countries. Reduction in Mexico exposure with HC
restructuring. •
North America
Year
over
year
improvement
in
a
challenging
environment
with
sequential
weakness
intra
year.
8 |
 9
Consolidated Fleet Changes as of December 31, 2010
(1) Includes aircraft sales, net lease returns/commencements and operated
returns Q1 FY2011
Q2 FY2011
Q3 FY2011
Total
Fleet Count Beginning Period
390
384
379
390
Delivered
Agusta AW 139
1
1
2
4
Sikorsky S-92
1
1
Added
1
1
3
5
Removed
(1)
(7)
(6)
(4)
(17)
Total
384
379
378
378
|
 Financial highlights
Jonathan
Baliff,
SVP
and
CFO |
 Financial highlights –
Earnings per share summary
3Q FY10 to 3Q FY11 bridge
9 months Q3 FY10 to 9 months Q3 FY11 bridge
11
$0.74
$1.00
$1.21
$1.13
$1.13
$0.74
$0.26
$0.46
$0.25
$0.08
Q3FY2010
Operations
Taxes
Corporate and Other
FX Changes
Q3FY2011
$2.32
$2.63
$2.82
$2.77
$2.77
$2.32
$0.31
$0.68
$0.49
$0.05
9 Mos FY2010
Operations
Taxes
Corporate and Other
FX Changes
9 Mos FY2011 |
 Financial highlights –
EBITDA summary
3Q FY10 to 3Q FY11 bridge
12
9 months Q3 FY10 to 9 months Q3 FY11 bridge
$64.4
$69.6
$65.6
$65.6
$64.4
$12.4
$7.2
$4.0
Q3FY2010
Operations
Corporate and Other
FX Changes
Q3FY2011
$220.7
$204.6
$200.0
$200.0
$200.2
$20.5
$16.1
$4.6
9 Mos FY2010
Operations
Corporate and Other
FX Changes
9 Mos FY2011 |
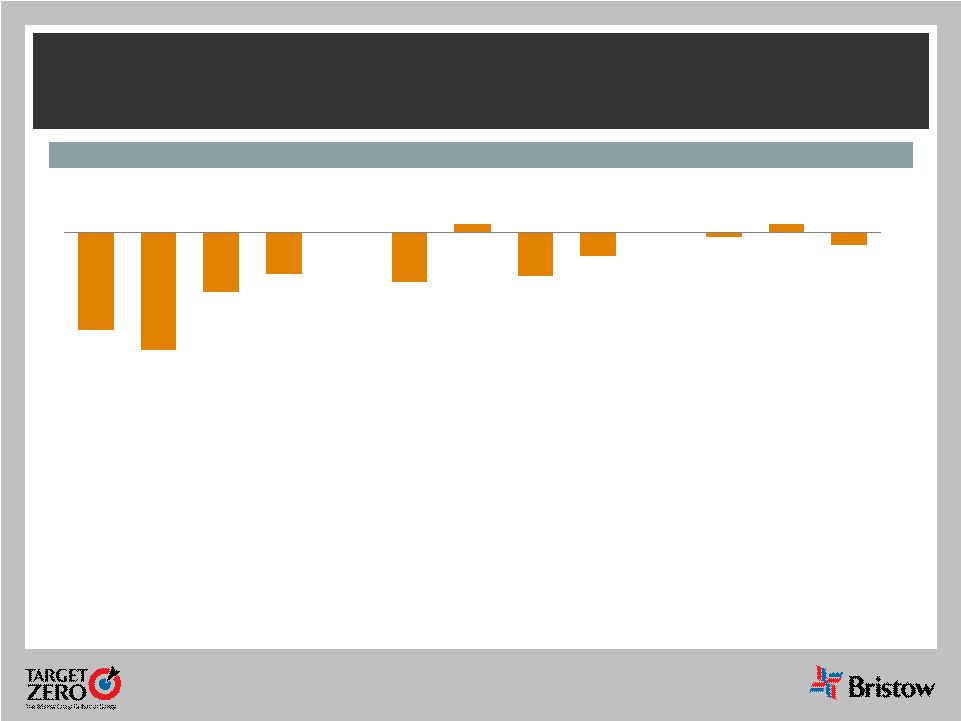 ($101)
($122)
($61)
($43)
($51)
$9
($45)
($24)
($4)
$9
($13)
Q1FY09
Q2FY09
Q3FY09
Q4FY09
Q1FY10
Q2FY10
Q3FY10
Q4FY10
Q1FY11
Q2FY11
Q3FY11
Historical cash flow from operations less all capex
13
Historical cash flow from operations less capex
($ millions)
•
Historically, Bristow has employed cash flow from operations with growth capital
expenditures •
Driven by fleet modernization catch-up with transitioning to new technology
medium and large aircraft.
•
Non-discretionary (aircraft maintenance and facilities) capital expenditures
have been far lower as a percentage of growth capital expenditures
•
In the future, we do not see the same level of capital spending in as short a
period of time |
 Our
new $375 million secured bank credit facility aligns well with our financial
strategy •
$175 million 5-year revolver and $200 million 5-year term loan with a
$100 million accordion feature
•
Term loan proceeds and revolver borrowings were used to repay $230
million 6 1/8% senior notes due 2013 on December 23, 2010; revolver
also used for general corporate purposes
•
Initial borrowing margin is LIBOR + 2.50%, but reverse flexing to 2.375%
after June 30, 2011 financials are provided to lenders
•
Leverage ratio pricing grid
•
Additional indebtedness subject to financial covenants
•
Enhanced capability for dividends and stock repurchases
•
Incurred one time charge of 11 cents due to early retirement
•
~$7 million pre-tax expected annual cash interest savings
at current LIBOR levels
14 |
 Total
capitalization $2.2 billion
(December 31, 2010)
$1.5 billion
Equity
Prudent balance sheet management
15
•
Cash on hand at December 31, 2010: $100.9 million
•
YTD FY11 EBITDAR
1
of $204.4 million
•
Undrawn borrowing capacity ($132 million revolving credit
facility)
•
Total liquidity
3
: $232.9 million
$726 million
Debt
Liquidity
1)
Earnings before interest, tax, depreciation, amortization and aircraft rental
expense 2)
Reconciliation in Appendix. Adjusted debt includes balance sheet debt,
unfunded pension liability and NPV of helicopter leases
3)
Total liquidity calculated as undrawn borrowing capacity plus cash on hand
Capital Structure
•
$175 million Revolver November 2015
•
$8 million in short-term borrowings and current portion of debt
•
$717.5 million in long-term debt
•
36
million shares of common stock
Leverage ratios
•
Adjusted Debt to Total Capital 37.4%
2
•
Adjusted Debt to EBITDAR 3.23:12 |
 Other financial information and guidance revisions
•
Capital allocation framework
•
Prudent balance sheet management is a core principle
•
Total liquidity maintained at $200-$250 million
•
Best risk/return opportunities attract Bristow capital
•
Balance shareholder return between capital appreciation
and regular return of
capital
•
Modeling information
•
Tax 17% –
21% (assuming revenue earned in the same regions and same mix)
•
SG & A Expense ~ $125-130 million
•
Depreciation and amortization expense ~ $85 million
•
Interest expense ~ $30-35 million
16 |
 Operational highlights
Bill
Chiles,
President
and
CEO |
 Quarterly changes
Quarter on quarter changes:
•
3%
increase
in
the
operating
income
in
Europe
is
due
to
higher
equity
earnings
from
our
military
training
unconsolidated
affiliate,
price
escalations
and
renegotiated
rates.
We
added
three
new
clients
since
the
prior
year
quarter
•
4%
decrease
in
the
operating
income
in
West
Africa
reflects
the
loss
of
a
major
client
in
this
market.
However,
lower
operating
expense
combined
with
the
addition
of
new
contracts lessened the impact
•
8%
decrease
in
the
operating
income
in
Australia
is
an
impact
of
higher
compensation
and
increased
depreciation
expense
•
9%
increase
in
the
operating
income
(from
$5.2M
to
$11.6M
Q
over
Q)
for
Other
International
Business
Unit
as
a
result
of
increased
revenue
in
Brazil,
the
Baltic
Sea,
Suriname,
Ghana
and
Russia.
•
No
change
in
the
operating
income
quarter
over
quarter
in
North
America
18
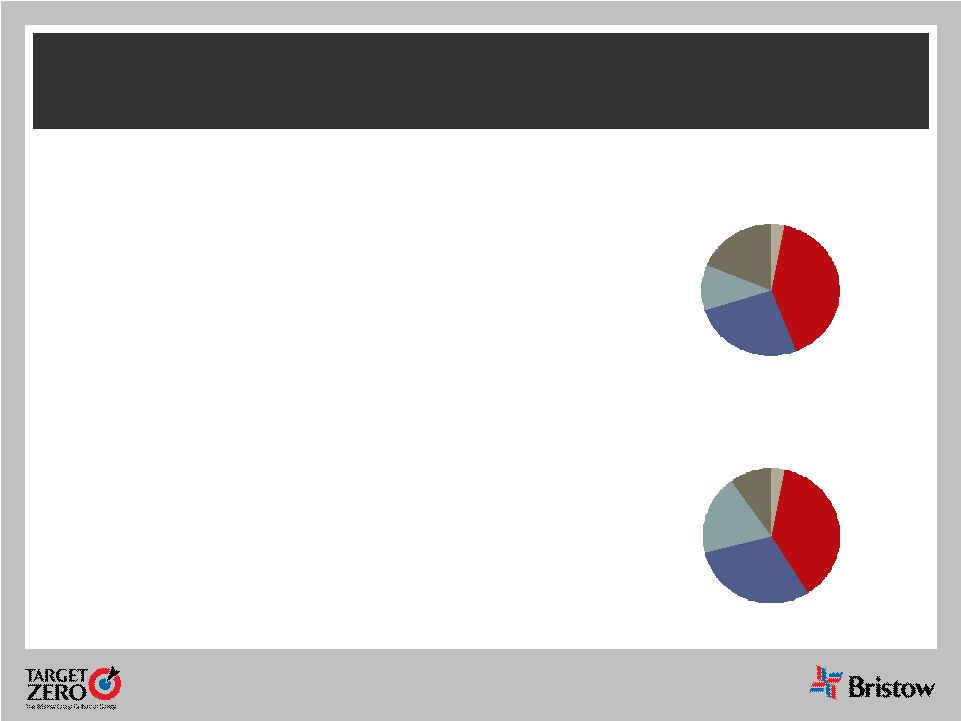
Operating Income* Q3 FY2011
North
America
3%
Europe
41%
West Africa
26%
Australia
11%
Other
International
19%
Operating Income* Q3 FY2010
North
America
3%
Europe
38%
West Africa
30%
Australia
19%
Other
International
10%
Operating income for Q3 2011 is $46.6M
Operating income for Q3 2010 is $39.7M
*
Excludes centralized operations, corporate, gain on sale of assets, and Bristow
Academy |
       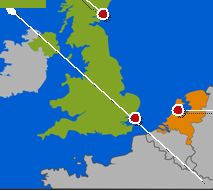 Europe (EBU)
UK
Netherlands
Norway
Norwich
Aberdeen
Scasta
Stavanger
Den Helder
Bergen
Hammerfest
•
Europe represents 42% of total revenue in Q3
FY11 and 41% of operating income
•
Operating margin 19.6% vs. 16.1% in prior year
quarter
•
Increase in activity with three new client
contracts commencing
•
Operational disruption due to severe weather in
December
•
FBH, unconsolidated JV, military training -
higher
equity earnings
•
Outlook:
•
Several major tender outstanding in UK,
Norway and Denmark for FY13
•
SAR-H award delayed
Operating margins expected for FY11 to
be ~ high teens
19 |
   West
Africa (WASBU) Nigeria
Lagos
Escravos
Port Harcourt
Warri
Eket
Calabar
20
•
Nigeria represents 17% of total revenue in Q3 FY11
and 26% of operating income
•
Operating margin 29.8% in Q3 FY11 vs. 25.5% Q3
prior year
•
Revenue of $53.7M decreased from $58.7M
•
Operating income of $16M increased from $14.9M
•
Lower operating expense
•
Increased competition and new entrants
Outlook:
•
Awaiting results of recent tenders
Operating margins expected in FY11 to be
~ mid twenties |
    Karratha
Exmouth
Learmonth
Varanus Is
Barrow Is
Australia (AUSBU)
Australia
Perth
Dongara
Essendon
Tooradin
Broome
Truscott
Darwin
BDI provide support
to the Republic of
Singapore Air Force
Oakey
•
Australia represented 13% of total revenue in
Q3 FY11 and 11% of operating income
•
Operating margin 17.2% vs. 24.5% for the prior
year quarter
•
Revenue of $41.4M increased from $38.2M
•
Operating income declined from $9.4M to
$7.1M
•
Higher compensation costs
•
Older under utilized aircraft to be sold or
redeployed
•
Outlook:
Increased competition in market place; loss of
Woodside as of May 31, 2011
Operating margins expected for FY11
to be ~ mid teens
21 |
 Other International (OIBU)
Consolidated in OIBU
Unconsolidated Affiliate
•
OIBU represented 13% of total revenue and 19% of
operating income for Q3FY11
•
Operating margin was 27.7% vs. 15.5% for the prior
year quarter
•
Revenue increased to $41.9 from $33.3M
•
Operating income to $11.6M from $5.2M
•
Increased revenue from Brazil, the Baltic Sea,
Suriname, Ghana and Russia
•
Brazil -
Lider: paid previously mentioned dividend
for 2009 of $1.4M, $0.8M net (7/12’s of the year)
•
Lider EBITDA was R$26M reias, which is in line
with previously stated run rate of R$8-10M
reias/month
•
Reducing exposure in Mexico
Outlook:
•
Tender activity in Ghana, Equatorial Guinea and
Libya
•
PAS dividend of $2.5 million expected in March
2011
Expect operating margins in FY11 to be
~high teens to lower twenties
22 |
 North America (NABU)
•
Represented 15% of total revenue and 3% of
operating income in Q3 FY11
•
Operating margin of 4.2% for Q3 FY11 up from
3.3% for the prior year quarter
•
Revenue of $45.6M flat from $45.7M
•
Operating income of $1.9M vs. $1.5M
•
Gulf of Mexico
•
Continues to be in a state of flux and
challenging market
•
Continues to redeploy aircraft to other
regions of the world
•
1 aircraft currently working for BP, down
from 3 at December 31 and 5 as of
September 30
Expect operating margins for FY11 to
be single digit for the rest of the year
23 |
 Summary
24
Open for Q and A
Bristow continues to deliver on our FY2011 promises with
third quarter earnings performance improving both year
over year and sequentially. Our medium to long term
outlook remains strong given better market dynamics |
 Appendix
25 |
 Organizational Chart -
as of December 31, 2010
Bristow
NABU
15
%*
U
.
S
.
GoM
–
89
/
7
Trinidad
–
8
/
1
Alaska
–
15
/
3
Mexico
–
21
/
5
Brazil
–
6
/
9
Lider
-
76
HC
-
12
UK
–
38
/
3
Netherlands
–
6
/
1
Norway
–
12
/
3
FBH
-
63
Nigeria
–
46
/
10
Australia
–
35
/
8
Other
–
10
/
1
Russia
–
7
/
3
Egypt
–
–
/
–
India
–
2
/
2
Turkmenistan
–
2
/
1
PAS
-
45
AUSBU
13
%
EBU
39
%
Florida
–
56
/
1
Louisiana
–
12
/
1
California
–
6
/
1
U
.
K
.
–
3
/
1
Malaysia
–
4
/
2
WASBU
17
%
OIBU
14
%
BRS Academy
2
%
Business
Unit
(*
%
of
FY10
Revenues)
Corporate
Region -
# of Aircraft / # of Bases
Joint
Venture
(No.
of
aircraft)
Key
Operated Aircraft
Bristow owns and/or operates
378 aircraft as of December 31,
2010
Affiliated Aircraft
Bristow affiliates and joint
ventures operate 196 aircraft
as of December 31, 2010
26 |
 Aircraft Fleet –
Medium and Large
As of December 31, 2010
Next Generation Aircraft
Mature Aircraft Models
Medium capacity 12-16 passengers
Large capacity 18-25 passengers
Aircraft
Type
No. of PAX
Engine
Consl
Unconsl
Total
Ordered
27
Medium Helicopters
AW139
12
Twin Turbine
7
4
11
-
Bell 212
12
Twin Turbine
3
22
25
-
Bell 412
13
Twin Turbine
40
46
86
-
EC155
13
Twin Turbine
4
-
4
-
Sikorsky S-76 A/A++
12
Twin Turbine
21
8
29
-
Sikorsky S-76 C/C++
12
Twin Turbine
51
25
76
3
126
105
231
3
Large Helicopters
AS332L Super Puma
18
Twin Turbine
30
-
30
-
Bell 214ST
18
Twin Turbine
3
-
3
-
EC225
25
Twin Turbine
15
-
15
3
Mil MI 8
20
Twin Turbine
7
-
7
-
Sikorsky S-61
18
Twin Turbine
2
-
2
-
Sikorsky S-92
19
Twin Turbine
23
1
24
3
80
1
81
6 |
 Aircraft Fleet –
Small, Training and Fixed
As of December 31, 2010 (continued)
Next Generation Aircraft
Mature Aircraft Models
Small capacity 4-7 passengers
Training capacity 2-6 passengers
28
Aircraft
Type
No. of PAX
Engine
Consl
Unconsl
Total
Ordered
Small Helicopters
Bell 206B
4
Turbine
2
2
4
-
Bell 206 L-3
6
Turbine
5
6
11
-
Bell 206 L-4
6
Turbine
31
2
33
-
Bell 407
6
Turbine
44
1
45
-
BK 117
7
Twin Turbine
2
-
2
-
BO-105
4
Twin Turbine
2
-
2
-
EC135
7
Twin Turbine
6
3
9
-
AS350
4
Turbine
-
36
36
-
Agusta 109
8
Twin Turbine
-
3
3
-
92
53
145
-
Training Helicopters
AS355
4
Twin Turbine
3
-
3
-
Bell 206B
6
Single Engine
9
-
9
-
Robinson R22
2
Piston
11
-
11
-
Robinson R44
2
Piston
2
-
2
-
Sikorsky 300CB/Cbi
2
Piston
51
-
51
-
Fixed Wing
1
-
1
-
77
-
77
-
-
Fixed Wing
3
37
40
-
Total
378
196
574
9 |
 EBITDA and EBITDAR Reconciliations
29
($ in millions)
2000
2001
2002
2003
2004
Income from continuing operations
$8.8
$27.9
$42.5
$40.3
$49.6
Income tax expense
3.8
13.3
19.1
17.5
18.5
Interest expense
18.5
18.4
15.8
14.9
16.8
Depreciation and amortization
32.0
33.1
33.9
37.5
39.4
EBITDA Subtotal
63.1
92.7
111.4
110.2
124.3
Aircraft rental expense
–
–
–
–
–
EBITDAR
$63.1
$92.7
$111.4
$110.2
$124.3
($ in millions)
2005
2006
2007
2008
2009
2010
Income from continuing operations
$49.2
$54.5
$72.5
$107.7
$125.5
$113.5
Income tax expense
$20.4
$14.7
$38.8
$44.5
$50.5
$29.0
Interest expense
$15.7
$14.7
$10.9
$23.8
$35.1
$42.4
Depreciation and amortization
40.5
42.1
42.5
54.1
65.5
74.7
EBITDA Subtotal
125.8
125.9
164.7
230.1
276.7
259.6
Aircraft rental expense
–
2.1
6.3
6.3
8.2
9.1
EBITDAR
$125.8
$128.0
$171.0
$236.4
$284.9
$268.7
March 31,
March 31,
($ in millions)
YTD FY10
YTD FY11
Income from continuing operations
$84.8
$102.1
Income tax expense
26.4
0.0
Interest expense
31.6
36.3
Depreciation and amortization
57.3
61.6
EBITDA Subtotal
200.2
200.0
Aircraft rental expense
7.0
4.4
EBITDAR
$207.2
$204.4
December 31, |
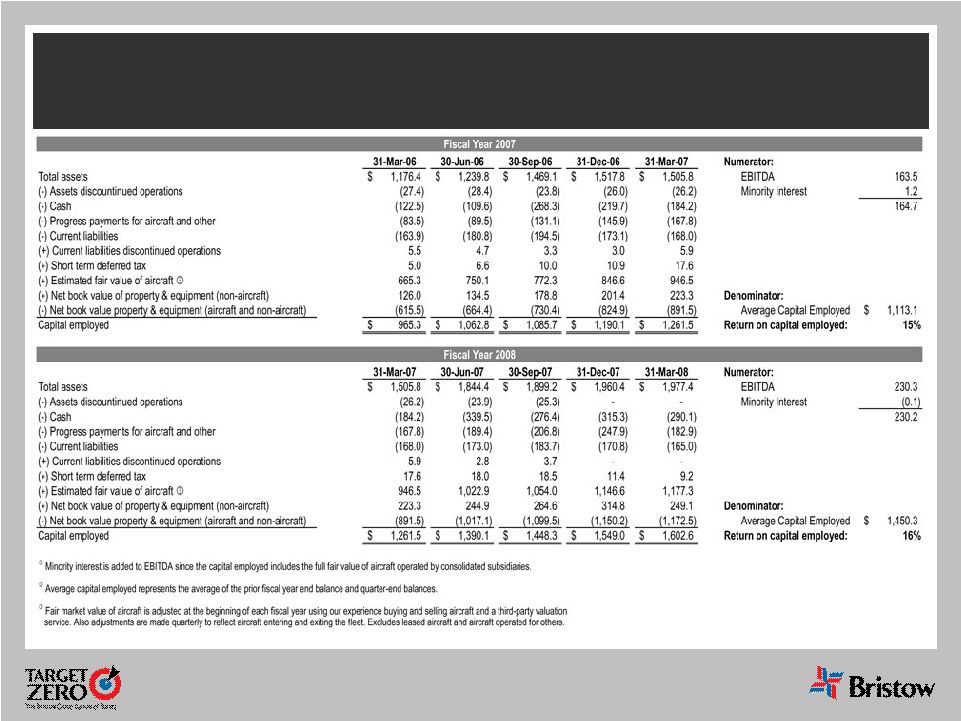 ROCE Reconciliation
30 |
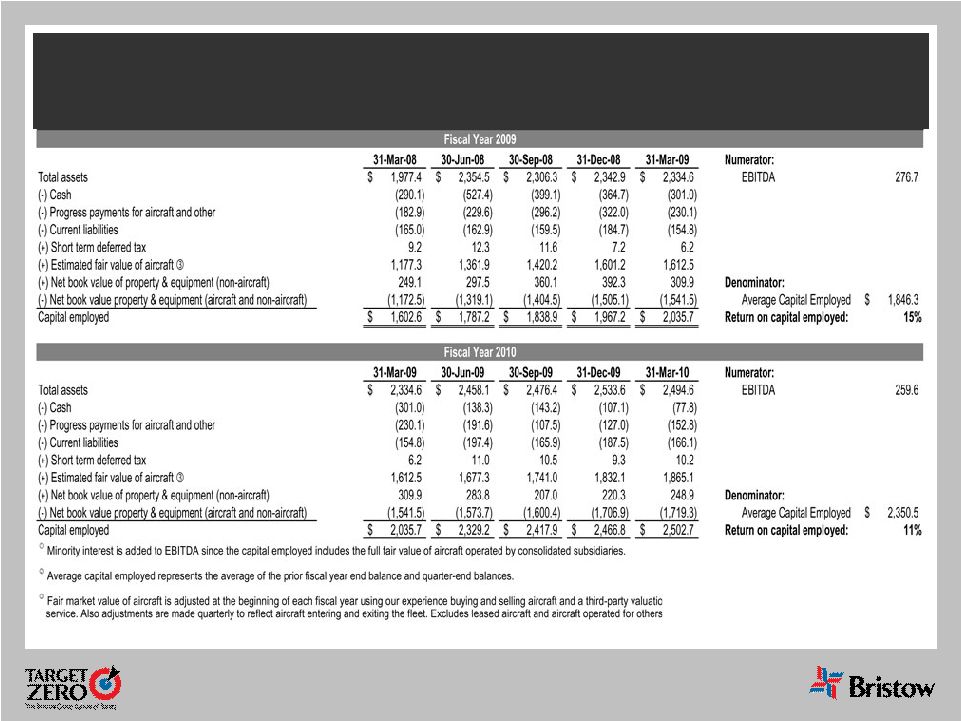 ROCE Reconciliation
31 |
 ROCE Reconciliation
32 |
 Leverage Reconciliation
33
Debt
Investment
Capital
Leverage
(a)
(b)
(c) = (a) + (b)
(a) / (c)
As of December 31, 2010
725.5
$
1,476.1
$
2,201.6
$
33.0%
Adjust for:
Unfunded Pension Liability
112.2
112.2
NPV of GE and Norsk Lease Obligations
42.6
42.6
Adjusted
880.3
$
(d)
1,476.1
$
2,356.4
$
37.4%
Calculation of debt to EBITDAR multiple
EBITDAR:
FY 2011
272.5
$
(e)
Annualized
363.4
$
= (d) / (e)
3.23:1 |
 Bristow Group Inc. (NYSE: BRS)
2000 West Sam Houston Parkway South
Suite 1700, Houston, Texas 77042
t
713.267.7600
f
713.267.7620
bristowgroup.com/investorrelations
Contact Us
34 |