Attached files
| file | filename |
|---|---|
| 8-K - FORM 8-K - SELECTIVE INSURANCE GROUP INC | f8k_020211.htm |
| EX-99 - EXHIBIT 99.1 - SELECTIVE INSURANCE GROUP INC | exh_991.htm |
|
Supplemental Investor Package
_______________________________________________
Fourth Quarter and
Full Year 2010
Investor Contact:
Jennifer DiBerardino
Senior Vice President, Investor Relations and Treasurer
Tel: 973-948-1364
jennifer.diberardino@selective.com
|
|
Selective Insurance Group, Inc.
|
||||||||||||||||||||||||
|
Selected Balance Sheet Data (unaudited)
|
||||||||||||||||||||||||
|
($ in thousands, except per share amounts)
|
||||||||||||||||||||||||
|
December 31,
|
December 31,
|
|||||||||||||||||||||||
|
2010
|
2009
|
|||||||||||||||||||||||
|
Unrealized/
|
Unrealized/
|
|||||||||||||||||||||||
|
Balance
|
Market
|
Unrecognized
|
Balance
|
Market
|
Unrecognized
|
|||||||||||||||||||
|
Sheet
|
Value
|
Gain/(Loss)
|
Sheet
|
Value
|
Gain/(Loss)
|
|||||||||||||||||||
|
Invested Assets:
|
||||||||||||||||||||||||
|
Corporate bonds1, 3
|
$ | 1,683,336 | 1,704,600 | 35,334 | $ | 1,138,957 | 1,158,453 | (13,259 | ) | |||||||||||||||
|
Government and municipal bonds3
|
1,873,730 | 1,894,436 | 77,913 | 2,207,315 | 2,217,627 | 72,329 | ||||||||||||||||||
|
Total bonds
|
3,557,066 | 3,599,036 | 113,247 | 3,346,272 | 3,376,080 | 59,070 | ||||||||||||||||||
|
Equities
|
69,636 | 69,636 | 11,597 | 80,264 | 80,264 | 15,874 | ||||||||||||||||||
|
Short-term investments
|
161,155 | 161,155 | - | 213,848 | 213,848 | - | ||||||||||||||||||
|
Other investments
|
137,865 | 137,865 | (4,982 | ) | 140,667 | 140,667 | (25,774 | ) | ||||||||||||||||
|
Total invested assets
|
3,925,722 | 3,967,692 | 119,862 | 3,781,051 | 3,810,859 | 49,170 | ||||||||||||||||||
|
Invested assets per $ of stockholders' equity
|
3.67 | 3.77 | ||||||||||||||||||||||
|
Total assets
|
5,231,772 | 5,114,827 | ||||||||||||||||||||||
|
Liabilities:
|
||||||||||||||||||||||||
|
Reserve for losses and loss expenses
|
2,830,058 | 2,745,799 | ||||||||||||||||||||||
|
Unearned premium reserve
|
823,596 | 844,847 | ||||||||||||||||||||||
|
Total liabilities
|
4,160,663 | 4,112,452 | ||||||||||||||||||||||
|
Stockholders' equity
|
1,071,109 | 1,002,375 | ||||||||||||||||||||||
|
Total debt to capitalization ratio
|
19.7 | % | 21.5 | % | ||||||||||||||||||||
|
Adjusted total debt to capitalization ratio 2
|
14.0 | % | 15.6 | % | ||||||||||||||||||||
|
Book value per share
|
19.95 | 18.83 | ||||||||||||||||||||||
|
Book value per share excluding
|
||||||||||||||||||||||||
|
unrealized gain or loss on bond portfolio
|
19.09 | 18.47 | ||||||||||||||||||||||
|
NPW per insurance segment employee
|
761 | 766 | ||||||||||||||||||||||
|
Statutory premiums to surplus ratio
|
1.3 | x | 1.5 | x | ||||||||||||||||||||
|
Statutory surplus
|
1,073,025 | 981,955 | ||||||||||||||||||||||
|
1 Includes mortgage-backed and asset-backed securities.
|
||||||||||||||||||||||||
|
2 The adjusted debt to capitalization ratio reflects an estimated equity treatment of 75% applied to our $100 million Junior Subordinated Notes issued September 25, 2006.
|
||||||||||||||||||||||||
|
3 Certain prior year amounts were reclassified to conform with current year presentation.
|
||||||||||||||||||||||||
|
Selective Insurance Group, Inc.
|
|||||||||||||||||||||||||||||||||
|
Selected Income Statement Data (unaudited)
|
|||||||||||||||||||||||||||||||||
|
December 2010
|
Three Months Ended December 31,
|
Twelve Months Ended December 31,
|
|||||||||||||||||||||||||||||||
|
($ in thousands, except per share amounts)
|
2010
|
2009
|
2010
|
2009
|
|||||||||||||||||||||||||||||
|
Per diluted share
|
Per diluted share
|
Per diluted share
|
Per diluted share
|
||||||||||||||||||||||||||||||
|
Consolidated
|
|||||||||||||||||||||||||||||||||
|
Revenue
|
$ | 394,089 | $ | 389,802 | $ | 1,564,621 | $ | 1,514,018 | |||||||||||||||||||||||||
|
Operating income
|
26,284 | 0.48 | 25,327 | 0.47 | 73,925 | 1.35 | 74,538 | 1.39 | |||||||||||||||||||||||||
|
Net realized losses, after tax
|
(2,478 | ) | (0.05 | ) | (3,683 | ) | (0.07 | ) | (4,604 | ) | (0.08 | ) | (29,880 | ) | (0.56 | ) | |||||||||||||||||
|
Income from continuing operations
|
23,806 | 0.43 | 21,644 | 0.40 | 69,321 | 1.27 | 44,658 | 0.83 | |||||||||||||||||||||||||
|
Loss on discontinued operations, after tax
|
(31 | ) | - | (1,064 | ) | (0.02 | ) | (3,780 | ) | (0.07 | ) | (8,260 | ) | (0.15 | ) | ||||||||||||||||||
|
Net income
|
23,775 | 0.43 | 20,580 | 0.38 | 65,541 | 1.20 | 36,398 | 0.68 | |||||||||||||||||||||||||
|
Operating return on equity
|
9.7 | % | 10.2 | % | 7.1 | % | 7.9 | % | |||||||||||||||||||||||||
|
Insurance Operations
|
|||||||||||||||||||||||||||||||||
|
Gross premiums written
|
364,047 | 367,296 | 1,659,669 | 1,679,926 | |||||||||||||||||||||||||||||
|
Net premiums written
|
301,812 | 304,891 | 1,390,541 | 1,422,655 | |||||||||||||||||||||||||||||
|
Net premiums earned
|
353,497 | 352,957 | 1,416,598 | 1,431,047 | |||||||||||||||||||||||||||||
|
Underwriting (loss) gain
|
- before tax
|
(468 | ) | (542 | ) | (22,167 | ) | 2,385 | |||||||||||||||||||||||||
|
- after tax
|
(305 | ) | (0.01 | ) | (353 | ) | (0.01 | ) | (14,409 | ) | (0.26 | ) | 1,550 | 0.03 | |||||||||||||||||||
|
GAAP combined ratio
|
100.1 | % | 100.2 | % | 101.6 | % | 99.8 | % | |||||||||||||||||||||||||
|
Commercial lines
|
|||||||||||||||||||||||||||||||||
|
Net premiums earned
|
290,148 | 296,884 | 1,174,282 | 1,214,952 | |||||||||||||||||||||||||||||
|
GAAP combined ratio
|
97.9 | % | 98.6 | % | 100.1 | % | 98.8 | % | |||||||||||||||||||||||||
|
Personal lines
|
|||||||||||||||||||||||||||||||||
|
Net premiums earned
|
63,349 | 56,074 | 242,316 | 216,095 | |||||||||||||||||||||||||||||
|
GAAP combined ratio
|
110.2 | % | 108.5 | % | 108.5 | % | 105.6 | % | |||||||||||||||||||||||||
|
Investments
|
|||||||||||||||||||||||||||||||||
|
Net investment income
|
- before tax
|
41,471 | 39,801 | 145,708 | 118,471 | ||||||||||||||||||||||||||||
|
- after tax
|
31,001 | 0.56 | 30,333 | 0.57 | 111,059 | 2.04 | 95,725 | 1.79 | |||||||||||||||||||||||||
|
Effective tax rate
|
25.2 | % | 23.8 | % | 23.8 | % | 19.2 | % | |||||||||||||||||||||||||
|
Annual after-tax yield on investment portfolio
|
2.9 | % | 2.6 | % | |||||||||||||||||||||||||||||
|
Annual after-tax, after-interest expense yield
|
2.6 | % | 2.3 | % | |||||||||||||||||||||||||||||
|
Invested assets per $ of stockholders' equity
|
3.67 | 3.77 | |||||||||||||||||||||||||||||||
|
Other expenses (net of other income)
|
|||||||||||||||||||||||||||||||||
|
Interest expense
|
- before tax
|
(4,560 | ) | (4,768 | ) | (18,616 | ) | (19,386 | ) | ||||||||||||||||||||||||
|
- after tax
|
(2,964 | ) | (0.05 | ) | (3,099 | ) | (0.06 | ) | (12,100 | ) | (0.22 | ) | (12,601 | ) | (0.24 | ) | |||||||||||||||||
|
Other - after tax
|
$ | (1,448 | ) | (0.02 | ) | $ | (1,554 | ) | (0.03 | ) | $ | (10,625 | ) | (0.21 | ) | $ | (10,136 | ) | (0.19 | ) | |||||||||||||
|
Diluted weighted avg. shares outstanding
|
54,894 | 53,639 | 54,504 | 53,397 | |||||||||||||||||||||||||||||
Selective Insurance Group, Inc. and Consolidated Subsidiaries
GAAP Investment Income
(unaudited)
($ in thousands)
|
For the three months ended
|
%
|
Year to Date
|
%
|
||||||||||||||||||||||
|
December
|
December
|
Increase
|
December
|
December
|
Increase
|
||||||||||||||||||||
|
2010
|
2009
|
(Decrease)
|
2010
|
2009
|
(Decrease)
|
||||||||||||||||||||
|
Investment Income:
|
|||||||||||||||||||||||||
|
Interest:
|
|||||||||||||||||||||||||
|
Fixed Maturity Securities
|
33,076 | 34,902 | (5.2 | ) | 130,990 | 141,882 | (7.7 | ) | |||||||||||||||||
|
Short-term
|
70 | 112 | (37.5 | ) | 437 | 1,273 | (65.7 | ) | |||||||||||||||||
|
Alternative Investments
|
9,191 | 5,018 | 83.2 | 20,313 | (21,726 | ) | 193.5 | ||||||||||||||||||
|
Dividends
|
959 | 786 | 22.0 | 2,238 | 2,348 | (4.7 | ) | ||||||||||||||||||
|
Changes in Fair Value
|
- | - | N/M | - | 262 | (100.0 | ) | ||||||||||||||||||
|
Miscellaneous
|
45 | 50 | (10.0 | ) | 139 | 343 | (59.5 | ) | |||||||||||||||||
| 43,341 | 40,868 | 6.1 | 154,117 | 124,382 | 23.9 | ||||||||||||||||||||
|
Investment Expense
|
1,870 | 1,067 | 75.3 | 8,409 | 5,911 | 42.3 | |||||||||||||||||||
|
Net Investment Income Before Tax
|
41,471 | 39,801 | 4.2 | 145,708 | 118,471 | 23.0 | |||||||||||||||||||
|
Tax
|
10,470 | 9,468 | 10.6 | 34,649 | 22,746 | 52.3 | |||||||||||||||||||
|
Net Investment Income After Tax
|
$ | 31,001 | 30,333 | 2.2 | $ | 111,059 | 95,725 | 16.0 | |||||||||||||||||
|
Net Investment Income per Share
|
$ | 0.56 | 0.57 | (1.8 | ) | $ | 2.04 | 1.79 | 14.0 | ||||||||||||||||
|
Effective Tax Rate
|
25.2 | % | 23.8 | % | 23.8 | % | 19.2 | % | |||||||||||||||||
|
Average Yields :
|
|||||||||||||||||||||||||
|
Fixed Maturity Securities:
|
|||||||||||||||||||||||||
|
Pre Tax
|
3.59 | % | 4.24 | % | |||||||||||||||||||||
|
After Tax
|
2.80 | % | 3.33 | % | |||||||||||||||||||||
|
Portfolio:
|
|||||||||||||||||||||||||
|
Pre Tax
|
3.78 | % | 3.24 | % | |||||||||||||||||||||
|
After Tax
|
2.88 | % | 2.61 | % | |||||||||||||||||||||
|
For the three months ended
|
Year to date:
|
||||||||||||||||||||||||
|
December
|
December
|
December
|
December
|
||||||||||||||||||||||
|
Net Realized Gains (Losses)
|
2010 | 2009 | 2010 | 2009 | |||||||||||||||||||||
|
Fixed Maturities
|
(86 | ) | (9,085 | ) | (14,898 | ) | (47,123 | ) | |||||||||||||||||
|
Equity Securities
|
1,464 | 3,417 | 12,999 | 3,192 | |||||||||||||||||||||
|
Other Investments
|
(5,184 | ) | - | (5,184 | ) | (2,039 | ) | ||||||||||||||||||
|
Total
|
(3,812 | ) | (5,668 | ) | (7,083 | ) | (45,970 | ) | |||||||||||||||||
|
Net of Tax
|
(2,478 | ) | (3,683 | ) | (4,604 | ) | (29,880 | ) | |||||||||||||||||
Selective Insurance Group, Inc. and Consolidated Subsidiaries
Investment Yield and Effective Tax Rate Portfolio Breakdown
December 31, 2010
($ in thousands)
(unaudited)
| Q4 2010 |
FY 2010
|
|||||||||||||||||||
|
Market
Value
|
Yield
|
Effective
Tax Rate
|
Yield
|
Effective
Tax Rate
|
||||||||||||||||
|
($)
|
(%)
|
(%)
|
(%)
|
(%)
|
||||||||||||||||
|
Fixed Maturities Securities:
|
||||||||||||||||||||
|
State & Municipal T/E
|
1,383,746 | 0.9 | 3.8 | 3.6 | 3.6 | |||||||||||||||
|
State & Municipal Tax
|
62,435 | 1.3 | 35.0 | 5.0 | 35.0 | |||||||||||||||
|
State & Municipal
|
1,446,181 | 0.9 | 5.8 | 3.6 | 5.7 | |||||||||||||||
|
Government (1)
|
448,255 | 0.8 | 35.0 | 2.6 | 35.0 | |||||||||||||||
|
Corporate
|
1,075,789 | 0.9 | 35.0 | 3.8 | 35.0 | |||||||||||||||
|
ABS's
|
60,661 | 1.1 | 35.0 | 4.2 | 35.0 | |||||||||||||||
|
MBS's
|
568,150 | 1.0 | 35.0 | 4.1 | 35.0 | |||||||||||||||
|
Total Debt Securities
|
3,599,036 | 0.9 | 22.7 | 3.6 | 22.1 | |||||||||||||||
|
Equity Securities
|
69,636 | 1.4 | 19.3 | 2.8 | 18.1 | |||||||||||||||
|
Short-term Investments
|
161,155 | 0.0 | 35.0 | 0.2 | 35.0 | |||||||||||||||
|
Other Investments
|
||||||||||||||||||||
|
Alternative Investments (2)
|
135,110 | 6.1 | 35.0 | 14.1 | 35.0 | |||||||||||||||
|
Other
|
2,755 | 0.0 | 0.0 | 0.0 | 0.0 | |||||||||||||||
| 3,967,692 | 1.1 | 25.2 | 3.8 | 23.8 | ||||||||||||||||
(1) Includes U.S Gov't with market value of $423.7 million and Foreign Gov't with market value of $24.6 million.
(2) Alternative Investments are not carried at market value, they are carried under the equity method.
|
Selective Insurance Group, Inc.
|
||||||||||||||||||||||||||||||||||||||||||||
|
2010 Statutory Results by Line of Business
|
||||||||||||||||||||||||||||||||||||||||||||
|
4th Qtr 2010 (unaudited)
|
||||||||||||||||||||||||||||||||||||||||||||
|
($ in thousands)
|
||||||||||||||||||||||||||||||||||||||||||||
|
Net
|
Net
|
Underwriting
|
Dividends to
|
|||||||||||||||||||||||||||||||||||||||||
|
Premiums
|
Percent
|
Premiums
|
Percent
|
Loss
|
LAE
|
Expense
|
Policyholders
|
Combined Ratio
|
Combined Ratio
|
Underwriting
|
||||||||||||||||||||||||||||||||||
|
Written
|
Change
|
Earned
|
Change
|
Ratio
|
Ratio
|
Ratio
|
Ratio
|
2010
|
2009
|
Gain/(Loss)
|
||||||||||||||||||||||||||||||||||
|
Personal Lines:
|
||||||||||||||||||||||||||||||||||||||||||||
|
Homeowners
|
$ | 25,136 | 20.4 | % | $ | 23,699 | 20.1 | % | 66.4 | % | 6.8 | % | 31.4 | % | 0.0 | % | 104.6 | % | 99.8 | % | $ | (1,546 | ) | |||||||||||||||||||||
|
Auto
|
35,219 | 8.0 | % | 36,471 | 6.9 | % | 79.5 | % | 7.7 | % | 30.2 | % | 0.0 | % | 117.4 | % | 117.7 | % | (5,984 | ) | ||||||||||||||||||||||||
|
Other (including flood)
|
3,376 | 8.4 | % | 3,179 | 43.3 | % | 59.8 | % | (9.1 | )% | (21.0 | )% | 0.0 | % | 29.7 | % | 26.3 | % | 2,278 | |||||||||||||||||||||||||
|
Total
|
$ | 63,731 | 12.6 | % | $ | 63,349 | 13.0 | % | 73.6 | % | 6.5 | % | 28.0 | % | 0.0 | % | 108.1 | % | 107.1 | % | $ | (5,252 | ) | |||||||||||||||||||||
|
Commercial Lines:
|
||||||||||||||||||||||||||||||||||||||||||||
|
Commercial property
|
$ | 40,977 | (6.3 | )% | $ | 49,064 | (1.7 | )% | 40.9 | % | 4.7 | % | 40.4 | % | 0.3 | % | 86.3 | % | 76.2 | % | $ | 9,973 | ||||||||||||||||||||||
|
Workers compensation
|
49,869 | 3.6 | % | 62,566 | 1.3 | % | 79.2 | % | 13.8 | % | 29.7 | % | 1.1 | % | 123.8 | % | 130.1 | % | (11,122 | ) | ||||||||||||||||||||||||
|
General liability
|
66,088 | (7.2 | )% | 84,037 | (4.6 | )% | 45.7 | % | 17.4 | % | 37.9 | % | 0.0 | % | 101.0 | % | 100.1 | % | 5,978 | |||||||||||||||||||||||||
|
Auto
|
57,685 | (6.7 | )% | 70,564 | (4.5 | )% | 60.7 | % | 7.0 | % | 31.3 | % | 0.2 | % | 99.2 | % | 99.6 | % | 4,601 | |||||||||||||||||||||||||
|
BOP
|
17,192 | 1.3 | % | 16,422 | 2.2 | % | 52.6 | % | 13.6 | % | 33.3 | % | 0.0 | % | 99.5 | % | 126.6 | % | (169 | ) | ||||||||||||||||||||||||
|
Bonds
|
4,006 | (5.0 | )% | 4,928 | 6.2 | % | 10.0 | % | (4.0 | )% | 68.0 | % | 0.0 | % | 74.0 | % | 100.7 | % | 1,909 | |||||||||||||||||||||||||
|
Other
|
2,264 | 2.5 | % | 2,566 | 3.7 | % | (0.4 | )% | 0.2 | % | 45.7 | % | 0.0 | % | 45.5 | % | 49.4 | % | 1,537 | |||||||||||||||||||||||||
|
Total
|
$ | 238,081 | (4.1 | )% | $ | 290,148 | (2.3 | )% | 55.1 | % | 11.2 | % | 35.3 | % | 0.3 | % | 101.9 | % | 103.3 | % | $ | 12,706 | ||||||||||||||||||||||
|
Grand Total
|
$ | 301,812 | (1.0 | )% | $ | 353,496 | 0.2 | % | 58.4 | % | 10.4 | % | 33.7 | % | 0.3 | % | 102.8 | % | 103.7 | % | $ | 7,454 | ||||||||||||||||||||||
|
Note: Some amounts may not foot due to rounding.
|
||||||||||||||||||||||||||||||||||||||||||||
| 2010 | 2009 | |||||||||||||||||||||||||||||||||||||||||||
|
Losses Paid
|
$ | 195,666 | $ | 185,896 | ||||||||||||||||||||||||||||||||||||||||
|
LAE Paid
|
39,958 | 40,841 | ||||||||||||||||||||||||||||||||||||||||||
|
Total Paid
|
$ | 235,624 | $ | 226,737 | ||||||||||||||||||||||||||||||||||||||||
|
Selective Insurance Group, Inc.
|
||||||||||||||||||||||||||||||||||||||||||||
|
2010 Statutory Results by Line of Business
|
||||||||||||||||||||||||||||||||||||||||||||
|
December 2010 YTD (unaudited)
|
||||||||||||||||||||||||||||||||||||||||||||
|
($ in thousands)
|
||||||||||||||||||||||||||||||||||||||||||||
|
Net
|
Net
|
Underwriting
|
Dividends to
|
|||||||||||||||||||||||||||||||||||||||||
|
Premiums
|
Percent
|
Premiums
|
Percent
|
Loss
|
LAE
|
Expense
|
Policyholders
|
Combined Ratio
|
Combined Ratio
|
Underwriting
|
||||||||||||||||||||||||||||||||||
|
Written
|
Change
|
Earned
|
Change
|
Ratio
|
Ratio
|
Ratio
|
Ratio
|
2010
|
2009
|
Gain/(Loss)
|
||||||||||||||||||||||||||||||||||
|
Personal Lines:
|
||||||||||||||||||||||||||||||||||||||||||||
|
Homeowners
|
$ | 96,792 | 20.0 | % | $ | 87,862 | 20.2 | % | 69.5 | % | 7.4 | % | 31.7 | % | 0.0 | % | 108.6 | % | 105.5 | % | $ | (10,386 | ) | |||||||||||||||||||||
|
Auto
|
147,497 | 8.6 | % | 141,962 | 6.5 | % | 73.3 | % | 10.6 | % | 29.7 | % | 0.0 | % | 113.6 | % | 110.7 | % | $ | (20,920 | ) | |||||||||||||||||||||||
|
Other (including flood)
|
12,376 | 9.0 | % | 12,493 | 28.8 | % | 58.1 | % | (15.7 | )% | (37.2 | )% | 0.0 | % | 5.2 | % | 16.1 | % | 11,795 | |||||||||||||||||||||||||
|
Total
|
$ | 256,666 | 12.6 | % | $ | 242,316 | 12.1 | % | 71.1 | % | 8.1 | % | 27.2 | % | 0.0 | % | 106.4 | % | 104.4 | % | $ | (19,511 | ) | |||||||||||||||||||||
|
Commercial Lines:
|
||||||||||||||||||||||||||||||||||||||||||||
|
Commercial property
|
$ | 194,382 | (2.7 | )% | $ | 199,252 | 0.8 | % | 51.5 | % | 4.3 | % | 37.9 | % | 0.0 | % | 93.7 | % | 83.9 | % | $ | 14,357 | ||||||||||||||||||||||
|
Workers compensation
|
237,409 | (5.5 | )% | 250,456 | (4.9 | )% | 79.7 | % | 15.2 | % | 27.7 | % | 1.6 | % | 124.2 | % | 107.6 | % | (56,955 | ) | ||||||||||||||||||||||||
|
General liability
|
323,276 | (8.2 | )% | 336,475 | (7.2 | )% | 44.4 | % | 17.1 | % | 35.0 | % | (0.1 | )% | 96.4 | % | 102.9 | % | 16,682 | |||||||||||||||||||||||||
|
Auto
|
281,365 | (5.6 | )% | 291,495 | (3.0 | )% | 52.4 | % | 8.0 | % | 29.8 | % | 0.0 | % | 90.2 | % | 98.2 | % | 31,721 | |||||||||||||||||||||||||
|
BOP
|
66,079 | 1.7 | % | 65,260 | 4.2 | % | 68.1 | % | 13.7 | % | 34.2 | % | 0.0 | % | 116.0 | % | 116.4 | % | (10,701 | ) | ||||||||||||||||||||||||
|
Bonds
|
19,142 | 2.5 | % | 19,243 | 4.3 | % | 13.8 | % | 3.7 | % | 61.6 | % | 0.0 | % | 79.1 | % | 93.4 | % | 4,087 | |||||||||||||||||||||||||
|
Other
|
10,236 | 2.8 | % | 10,115 | 4.7 | % | 1.3 | % | 0.3 | % | 45.0 | % | 0.0 | % | 46.6 | % | 46.5 | % | 5,349 | |||||||||||||||||||||||||
|
Total
|
$ | 1,131,890 | (5.3 | )% | $ | 1,172,296 | (3.5 | )% | 55.6 | % | 11.7 | % | 33.2 | % | 0.3 | % | 100.8 | % | 99.8 | % | $ | 4,539 | ||||||||||||||||||||||
|
Grand Total
|
$ | 1,388,556 | (2.4 | )% | $ | 1,414,612 | (1.1 | )% | 58.2 | % | 11.1 | % | 32.0 | % | 0.3 | % | 101.6 | % | 100.5 | % | $ | (14,972 | ) | |||||||||||||||||||||
|
Note: Some amounts may not foot due to rounding.
|
||||||||||||||||||||||||||||||||||||||||||||
| 2010 | 2009 | |||||||||||||||||||||||||||||||||||||||||||
|
Losses Paid
|
$ | 784,641 | $ | 757,916 | ||||||||||||||||||||||||||||||||||||||||
|
LAE Paid
|
154,661 | 157,034 | ||||||||||||||||||||||||||||||||||||||||||
|
Total Paid
|
$ | 939,302 | $ | 914,950 | ||||||||||||||||||||||||||||||||||||||||
|
Consolidated Balance Sheets
|
||||||||
|
December 31,
|
Unaudited
|
|||||||
|
($ in thousands, except share amounts)
|
2010
|
2009
|
||||||
|
ASSETS
|
||||||||
|
Investments:
|
||||||||
|
Fixed maturity securities, held-to-maturity – at carry value
|
||||||||
|
(fair value: $1,256,294 – 2010; $1,740,211 – 2009)
|
$ | 1,214,324 | 1,710,403 | |||||
|
Fixed maturity securities, available-for-sale – at fair value
|
||||||||
|
(amortized cost: $2,285,988 – 2010; $1,616,456 – 2009)
|
2,342,742 | 1,635,869 | ||||||
|
Equity securities, available-for-sale – at fair value
|
||||||||
|
(cost of: $58,039 – 2010; $64,390 – 2009)
|
69,636 | 80,264 | ||||||
|
Short-term investments (at cost which approximates fair value)
|
161,155 | 213,848 | ||||||
|
Other investments
|
137,865 | 140,667 | ||||||
|
Total investments
|
3,925,722 | 3,781,051 | ||||||
|
Cash
|
645 | 811 | ||||||
|
Interest and dividends due or accrued
|
37,007 | 34,651 | ||||||
|
Premiums receivable, net of allowance for uncollectible
|
||||||||
|
accounts of: $4,691 – 2010; $5,880 – 2009
|
414,105 | 446,577 | ||||||
|
Reinsurance recoverable, net
|
318,752 | 276,018 | ||||||
|
Prepaid reinsurance premiums
|
110,327 | 105,522 | ||||||
|
Current federal income tax
|
11,200 | 17,662 | ||||||
|
Deferred federal income tax
|
93,234 | 111,038 | ||||||
|
Property and equipment – at cost, net of accumulated
|
||||||||
|
depreciation and amortization of: $151,704 – 2010; $141,251 – 2009
|
41,775 | 46,287 | ||||||
|
Deferred policy acquisition costs
|
209,627 | 218,601 | ||||||
|
Goodwill
|
7,849 | 7,849 | ||||||
|
Other assets
|
61,529 | 68,760 | ||||||
|
Total assets
|
$ | 5,231,772 | 5,114,827 | |||||
|
LIABILITIES AND STOCKHOLDERS’ EQUITY
|
||||||||
|
Liabilities:
|
||||||||
|
Reserve for losses and loss expenses
|
$ | 2,830,058 | 2,745,799 | |||||
|
Unearned premiums
|
823,596 | 844,847 | ||||||
|
Notes payable
|
262,333 | 274,606 | ||||||
|
Accrued salaries and benefits
|
100,933 | 103,802 | ||||||
|
Other liabilities
|
143,743 | 143,398 | ||||||
|
Total liabilities
|
$ | 4,160,663 | 4,112,452 | |||||
|
Stockholders’ Equity:
|
||||||||
|
Preferred stock of $0 par value per share:
|
||||||||
|
Authorized shares 5,000,000; no shares issued or outstanding
|
$ | - | - | |||||
|
Common stock of $2 par value per share
|
||||||||
|
Authorized shares: 360,000,000
|
||||||||
|
Issued: 96,362,667 – 2010; 95,822,959 – 2009
|
192,725 | 191,646 | ||||||
|
Additional paid-in capital
|
244,613 | 231,933 | ||||||
|
Retained earnings
|
1,176,155 | 1,138,978 | ||||||
|
Accumulated other comprehensive income (loss)
|
7,024 | (12,460 | ) | |||||
|
Treasury stock – at cost (shares: 42,686,204 – 2010; 42,578,779 – 2009)
|
(549,408 | ) | (547,722 | ) | ||||
|
Total stockholders’ equity
|
1,071,109 | 1,002,375 | ||||||
|
Commitments and contingencies
|
||||||||
|
Total liabilities and stockholders’ equity
|
$ | 5,231,772 | 5,114,827 | |||||
|
Consolidated Statements of Income
|
||||||||
|
Fourth Quarter
|
||||||||
|
Unaudited
|
||||||||
|
($ in thousands, except share amounts)
|
2010
|
2009
|
||||||
|
Revenues:
|
||||||||
|
Net premiums earned
|
$ | 353,497 | 352,957 | |||||
|
Net investment income earned
|
41,471 | 39,801 | ||||||
|
Net realized losses:
|
||||||||
|
Net realized investment (losses) gains
|
(3,385 | ) | 5,931 | |||||
|
Other-than-temporary impairments
|
101 | (18,717 | ) | |||||
|
Other-than-temporary impairments on fixed maturity securities
|
||||||||
|
recognized in other comprehensive income
|
(528 | ) | 7,118 | |||||
|
Total net realized losses
|
(3,812 | ) | (5,668 | ) | ||||
|
Other income
|
2,933 | 2,712 | ||||||
|
Total revenues
|
394,089 | 389,802 | ||||||
|
Expenses:
|
||||||||
|
Losses and loss expenses incurred
|
242,976 | 238,630 | ||||||
|
Policy acquisition costs
|
111,902 | 115,276 | ||||||
|
Interest expense
|
4,560 | 4,768 | ||||||
|
Other expenses
|
5,250 | 5,034 | ||||||
|
Total expenses
|
364,688 | 363,708 | ||||||
|
Income from continuing operations, before federal income tax
|
29,401 | 26,094 | ||||||
|
Federal income tax expense:
|
||||||||
|
Current
|
(3,152 | ) | (233 | ) | ||||
|
Deferred
|
8,747 | 4,683 | ||||||
|
Total federal income tax expense
|
5,595 | 4,450 | ||||||
|
Net income from continuing operations
|
23,806 | 21,644 | ||||||
|
Income from discontinued operations, net of tax of $64 – 2009
|
- | 110 | ||||||
|
Loss on disposal of discontinued operations, net of tax of $(16) – 2010;
|
||||||||
| $(631) – 2009 | (31 | ) | (1,174 | ) | ||||
|
Total discontinued operations, net of tax
|
(31 | ) | (1,064 | ) | ||||
|
Net income
|
23,775 | 20,580 | ||||||
|
Earnings per share:
|
||||||||
|
Basic net income from continuing operations
|
0.44 | 0.41 | ||||||
|
Basic net loss from discontinued operations
|
- | (0.02 | ) | |||||
|
Basic net income
|
$ | 0.44 | 0.39 | |||||
|
Diluted net income from continuing operations
|
$ | 0.43 | 0.40 | |||||
|
Diluted net loss from discontinued operations
|
- | (0.02 | ) | |||||
|
Diluted net income
|
0.43 | 0.38 | ||||||
|
Dividends to stockholders
|
$ | 0.13 | 0.13 | |||||
|
Consolidated Statements of Income
|
||||||||||||
|
December 31,
|
||||||||||||
|
Unaudited
|
||||||||||||
|
($ in thousands, except share amounts)
|
2010
|
2009
|
2008
|
|||||||||
|
Revenues:
|
||||||||||||
|
Net premiums earned
|
$ | 1,416,598 | 1,431,047 | 1,504,187 | ||||||||
|
Net investment income earned
|
145,708 | 118,471 | 131,032 | |||||||||
|
Net realized losses:
|
||||||||||||
|
Net realized investment gains
|
10,575 | 9,446 | 3,648 | |||||||||
|
Other-than-temporary impairments
|
(16,225 | ) | (64,184 | ) | (53,100 | ) | ||||||
|
Other-than-temporary impairments on fixed maturity securities recognized in
|
||||||||||||
|
other comprehensive income
|
(1,433 | ) | 8,768 | - | ||||||||
|
Total net realized losses
|
(7,083 | ) | (45,970 | ) | (49,452 | ) | ||||||
|
Other income
|
9,398 | 10,470 | 4,172 | |||||||||
|
Total revenues
|
1,564,621 | 1,514,018 | 1,589,939 | |||||||||
|
Expenses:
|
||||||||||||
|
Losses and loss expenses incurred
|
982,118 | 971,905 | 1,011,544 | |||||||||
|
Policy acquisition costs
|
458,045 | 457,424 | 485,702 | |||||||||
|
Interest expense
|
18,616 | 19,386 | 20,508 | |||||||||
|
Other expenses
|
23,886 | 26,117 | 32,018 | |||||||||
|
Total expenses
|
1,482,665 | 1,474,832 | 1,549,772 | |||||||||
|
Income from continuing operations, before federal income tax
|
81,956 | 39,186 | 40,167 | |||||||||
|
Federal income tax expense (benefit):
|
||||||||||||
|
Current
|
5,323 | 3,585 | 21,995 | |||||||||
|
Deferred
|
7,312 | (9,057 | ) | (25,929 | ) | |||||||
|
Total federal income tax expense (benefit)
|
12,635 | (5,472 | ) | (3,934 | ) | |||||||
|
Net income from continuing operations
|
69,321 | 44,658 | 44,101 | |||||||||
|
Loss from discontinued operations, net of tax of $(4,042) – 2009;
|
||||||||||||
|
$(438) – 2008
|
- | (7,086 | ) | (343 | ) | |||||||
|
Loss on disposal of discontinued operations, net of tax of $(2,035) – 2010;
|
||||||||||||
|
$(631) – 2009
|
(3,780 | ) | (1,174 | ) | - | |||||||
|
Total discontinued operations, net of tax
|
(3,780 | ) | (8,260 | ) | (343 | ) | ||||||
|
Net income
|
65,541 | 36,398 | 43,758 | |||||||||
|
Earnings per share:
|
||||||||||||
|
Basic net income from continuing operations
|
1.30 | 0.84 | 0.85 | |||||||||
|
Basic net loss from discontinued operations
|
(0.07 | ) | (0.15 | ) | (0.01 | ) | ||||||
|
Basic net income
|
$ | 1.23 | 0.69 | 0.84 | ||||||||
|
Diluted net income from continuing operations
|
$ | 1.27 | 0.83 | 0.83 | ||||||||
|
Diluted net loss from discontinued operations
|
(0.07 | ) | (0.15 | ) | (0.01 | ) | ||||||
|
Diluted net income
|
1.20 | 0.68 | 0.82 | |||||||||
|
Dividends to stockholders
|
$ | 0.52 | 0.52 | 0.52 | ||||||||
|
Consolidated Statements of Stockholders’ Equity
|
||||||||||||||||||||||||
|
December 31,
|
||||||||||||||||||||||||
|
Unaudited
|
||||||||||||||||||||||||
|
($ in thousands, except share amounts)
|
2010
|
2009
|
2008
|
|||||||||||||||||||||
|
Common stock:
|
||||||||||||||||||||||||
|
Beginning of year
|
$ | 191,646 | 190,527 | 189,306 | ||||||||||||||||||||
|
Dividend reinvestment plan
|
||||||||||||||||||||||||
|
(shares: 106,437– 2010; 123,880 – 2009; 81,200 – 2008)
|
213 | 248 | 162 | |||||||||||||||||||||
|
Convertible debentures
|
||||||||||||||||||||||||
|
(shares: 45,759 – 2008)
|
- | - | 92 | |||||||||||||||||||||
|
Stock purchase and compensation plans
|
||||||||||||||||||||||||
|
(shares: 433,271 – 2010; 435,571 – 2009; 483,619 – 2008)
|
866 | 871 | 967 | |||||||||||||||||||||
|
End of year
|
192,725 | 191,646 | 190,527 | |||||||||||||||||||||
|
Additional paid-in capital:
|
||||||||||||||||||||||||
|
Beginning of year
|
231,933 | 217,195 | 192,627 | |||||||||||||||||||||
|
Dividend reinvestment plan
|
1,465 | 1,514 | 1,677 | |||||||||||||||||||||
|
Convertible debentures
|
- | - | 645 | |||||||||||||||||||||
|
Stock purchase and compensation plans
|
11,215 | 13,224 | 22,246 | |||||||||||||||||||||
|
End of year
|
244,613 | 231,933 | 217,195 | |||||||||||||||||||||
|
Retained earnings:
|
||||||||||||||||||||||||
|
Beginning of year
|
1,138,978 | 1,128,149 | 1,105,946 | |||||||||||||||||||||
|
Cumulative-effect adjustment due to fair value election
|
||||||||||||||||||||||||
|
under ASC 825, net of deferred income tax
|
- | - | 6,210 | |||||||||||||||||||||
|
Cumulative-effect adjustment due to adoption of other-
|
||||||||||||||||||||||||
|
than-temporary impairment guidance under ASC 320,
|
||||||||||||||||||||||||
|
net of deferred income tax
|
- | 2,380 | - | |||||||||||||||||||||
|
Net income
|
65,541 | 65,541 | 36,398 | 36,398 | 43,758 | 43,758 | ||||||||||||||||||
|
Cash dividends to stockholders ($0.52 per share – 2010;
|
||||||||||||||||||||||||
|
2009; and 2008)
|
(28,364 | ) | (27,949 | ) | (27,765 | ) | ||||||||||||||||||
|
End of year
|
1,176,155 | 1,138,978 | 1,128,149 | |||||||||||||||||||||
|
Accumulated other comprehensive income (loss):
|
||||||||||||||||||||||||
|
Beginning of year
|
(12,460 | ) | (100,666 | ) | 86,043 | |||||||||||||||||||
|
Cumulative-effect adjustment due to fair value election
|
||||||||||||||||||||||||
|
under ASC 825, net of deferred income tax
|
- | - | (6,210 | ) | ||||||||||||||||||||
|
Cumulative-effect adjustment due to adoption of other-
|
||||||||||||||||||||||||
|
than-temporary impairment guidance under ASC 320,
|
||||||||||||||||||||||||
|
net of deferred income tax
|
- | (2,380 | ) | - | ||||||||||||||||||||
|
Other comprehensive income (loss), increase (decrease) in:
|
||||||||||||||||||||||||
|
Unrealized gains (losses) on investment securities:
|
||||||||||||||||||||||||
|
Non-credit portion of other-than-temporary
|
||||||||||||||||||||||||
|
impairment losses recognized in other
|
||||||||||||||||||||||||
|
comprehensive income, net of deferred income tax
|
3,416 | (5,629 | ) | - | ||||||||||||||||||||
|
Other net unrealized gains (losses) on investment
|
||||||||||||||||||||||||
|
securities, net of deferred income tax
|
21,113 | 92,183 | (142,685 | ) | ||||||||||||||||||||
|
Total unrealized gains (losses) on investment
|
||||||||||||||||||||||||
|
securities
|
24,529 | 24,529 | 86,554 | 86,554 | (142,685 | ) | (142,685 | ) | ||||||||||||||||
|
Defined benefit pension plans, net of deferred income tax
|
(5,045 | ) | (5,045 | ) | 4,032 | 4,032 | (37,814 | ) | (37,814 | ) | ||||||||||||||
|
End of year
|
7,024 | (12,460 | ) | (100,666 | ) | |||||||||||||||||||
|
Comprehensive income (loss)
|
85,025 | 126,984 | (136,741 | ) | ||||||||||||||||||||
|
Treasury stock:
|
||||||||||||||||||||||||
|
Beginning of year
|
(547,722 | ) | (544,712 | ) | (497,879 | ) | ||||||||||||||||||
|
Acquisition of treasury stock
|
||||||||||||||||||||||||
|
(shares: 107,425 – 2010; 191,858 – 2009;
|
||||||||||||||||||||||||
|
2,039,027 – 2008)
|
(1,686 | ) | (3,010 | ) | (46,833 | ) | ||||||||||||||||||
|
End of year
|
(549,408 | ) | (547,722 | ) | (544,712 | ) | ||||||||||||||||||
|
Total stockholders’ equity
|
$ | 1,071,109 | 1,002,375 | 890,493 | ||||||||||||||||||||
|
Consolidated Statements of Cash Flows
|
||||||||||||
|
December 31,
|
||||||||||||
|
Unaudited
|
||||||||||||
|
($ in thousands, except share amounts)
|
2010
|
2009
|
2008
|
|||||||||
|
Operating Activities
|
||||||||||||
|
Net Income
|
$ | 65,541 | 36,398 | 43,758 | ||||||||
|
Adjustments to reconcile net income to net cash provided by operating activities:
|
||||||||||||
|
Depreciation and amortization
|
31,770 | 28,593 | 28,552 | |||||||||
|
Loss on disposal of discontinued operations
|
3,780 | 1,174 | - | |||||||||
|
Stock-based compensation expense
|
12,355 | 11,036 | 17,215 | |||||||||
|
Undistributed (income) loss of equity method investments
|
(8,712 | ) | 21,726 | 13,753 | ||||||||
|
Net realized losses
|
7,083 | 45,970 | 49,452 | |||||||||
|
Postretirement life curtailment benefit
|
- | (4,217 | ) | - | ||||||||
|
Deferred tax expense (benefit)
|
7,312 | (9,057 | ) | (26,665 | ) | |||||||
|
Unrealized (gain) loss on trading securities
|
- | (262 | ) | 8,129 | ||||||||
|
Goodwill impairment on discontinued operations
|
- | 12,214 | 4,000 | |||||||||
|
Changes in assets and liabilities:
|
||||||||||||
|
Increase in reserves for losses and loss expenses, net of reinsurance recoverables
|
41,526 | 60,619 | 103,016 | |||||||||
|
Decrease in unearned premiums, net of prepaid reinsurance and advance premiums
|
(26,661 | ) | (8,028 | ) | (10,766 | ) | ||||||
|
Decrease (increase) in net federal income tax recoverable
|
8,497 | 5,339 | (22,092 | ) | ||||||||
|
Decrease in premiums receivable
|
32,472 | 34,317 | 15,469 | |||||||||
|
Decrease (increase) in deferred policy acquisition costs
|
8,974 | (6,282 | ) | 14,115 | ||||||||
|
(Increase) decrease in interest and dividends due or accrued
|
(2,361 | ) | 1,918 | (431 | ) | |||||||
|
Decrease in accrued salaries and benefits
|
(19,251 | ) | (15,020 | ) | (3,100 | ) | ||||||
|
(Decrease) increase in accrued insurance expenses
|
(4,470 | ) | 2,240 | (15,880 | ) | |||||||
|
Purchase of trading securities
|
- | - | (6,587 | ) | ||||||||
|
Sale of trading securities
|
- | 2,831 | 21,002 | |||||||||
|
Other-net
|
1,330 | 6,050 | 8,233 | |||||||||
|
Net adjustments
|
93,644 | 191,161 | 197,415 | |||||||||
|
Net cash provided by operating activities
|
159,185 | 227,559 | 241,173 | |||||||||
|
Investing Activities
|
||||||||||||
|
Purchase of fixed maturity securities, held-to-maturity
|
- | (158,827 | ) | - | ||||||||
|
Purchase of fixed maturity securities, available-for-sale
|
(1,007,679 | ) | (1,041,277 | ) | (587,430 | ) | ||||||
|
Purchase of equity securities, available-for-sale
|
(71,192 | ) | (79,455 | ) | (70,651 | ) | ||||||
|
Purchase of other investments
|
(20,673 | ) | (16,298 | ) | (53,089 | ) | ||||||
|
Purchase of short-term investments
|
(1,741,738 | ) | (1,956,164 | ) | (2,204,107 | ) | ||||||
|
Sale of subsidiary
|
978 | (12,538 | ) | - | ||||||||
|
Sale of fixed maturity securities, held-to-maturity
|
- | 5,820 | - | |||||||||
|
Sale of fixed maturity securities, available-for-sale
|
190,438 | 538,769 | 152,655 | |||||||||
|
Sale of short-term investments
|
1,794,434 | 1,940,427 | 2,196,162 | |||||||||
|
Redemption and maturities of fixed maturity securities, held-to-maturity
|
319,835 | 282,310 | 4,652 | |||||||||
|
Redemption and maturities of fixed maturity securities, available-for-sale
|
298,171 | 122,403 | 294,342 | |||||||||
|
Sale of equity securities, available-for-sale
|
98,015 | 137,244 | 102,313 | |||||||||
|
Distributions from other investments
|
22,406 | 25,596 | 26,164 | |||||||||
|
Purchase of property and equipment
|
(6,522 | ) | (8,207 | ) | (8,083 | ) | ||||||
|
Net cash used in investing activities
|
(123,527 | ) | (220,197 | ) | (147,072 | ) | ||||||
|
Financing Activities
|
||||||||||||
|
Dividends to stockholders
|
(26,056 | ) | (26,296 | ) | (25,804 | ) | ||||||
|
Acquisition of treasury stock
|
(1,686 | ) | (3,010 | ) | (46,833 | ) | ||||||
|
Principal payment of notes payable
|
(12,300 | ) | (12,300 | ) | (12,300 | ) | ||||||
|
Proceeds from borrowings
|
- | 13,000 | - | |||||||||
|
Net proceeds from stock purchase and compensation plans
|
4,962 | 4,612 | 8,222 | |||||||||
|
Excess tax benefits from share-based payment arrangements
|
(744 | ) | (1,200 | ) | 1,628 | |||||||
|
Principal payments of convertible bonds
|
- | - | (8,754 | ) | ||||||||
|
Net cash used in financing activities
|
(35,824 | ) | (25,194 | ) | (83,841 | ) | ||||||
|
Net (decrease) increase in cash and cash equivalents
|
(166 | ) | (17,832 | ) | 10,260 | |||||||
|
Net (decrease) increase in cash and cash equivalents from discontinued operations
|
- | (15,037 | ) | 8,619 | ||||||||
|
Net (decrease) increase in cash from continuing operations
|
(166 | ) | (2,795 | ) | 1,641 | |||||||
|
Cash from continuing operations, beginning of year
|
811 | 3,606 | 1,965 | |||||||||
|
Cash from continuing operations, end of year
|
$ | 645 | 811 | 3,606 | ||||||||
Selective Insurance Group, Inc.
Combined Insurance Company Subsidiaries
Unaudited Statutory Balance Sheets
($ in thousands)
|
Dec-31
|
Dec-31
|
|||||||
|
2010
|
2009
|
|||||||
|
ASSETS
|
||||||||
|
Bonds
|
$ | 3,482,204 | 3,289,336 | |||||
|
Common stocks
|
69,636 | 80,264 | ||||||
|
Affiliated mortgage loan
|
38,785 | 39,408 | ||||||
|
Other investments
|
174,067 | 176,983 | ||||||
|
Short-term investments
|
111,021 | 165,957 | ||||||
|
Total investments
|
3,875,713 | 3,751,948 | ||||||
|
Cash on hand and in banks
|
(30,343 | ) | (29,110 | ) | ||||
|
Interest and dividends due and accrued
|
37,172 | 34,808 | ||||||
|
Premiums receivable
|
410,809 | 443,223 | ||||||
|
Reinsurance recoverable on paid losses and expenses
|
5,013 | 4,408 | ||||||
|
Federal income tax recoverable
|
- | 1,608 | ||||||
|
Deferred tax recoverable
|
133,100 | 119,377 | ||||||
|
EDP equipment
|
1,409 | 2,134 | ||||||
|
Equities and deposits in pools and associations
|
6,681 | 4,886 | ||||||
|
Receivable for sold securities
|
16,738 | 19,655 | ||||||
|
Other assets
|
30,164 | 29,747 | ||||||
|
Total assets
|
$ | 4,486,456 | 4,382,684 | |||||
|
LIABILITIES
|
||||||||
|
Reserve for losses
|
$ | 2,111,557 | 2,072,376 | |||||
|
Reinsurance payable on paid loss and loss expense
|
1,030 | 1,011 | ||||||
|
Reserve for loss expenses
|
401,508 | 399,457 | ||||||
|
Unearned premiums
|
713,268 | 739,325 | ||||||
|
Reserve for commissions payable
|
43,590 | 49,237 | ||||||
|
Ceded balances payable
|
12,835 | 9,856 | ||||||
|
Federal income tax payable
|
1,645 | - | ||||||
|
Premium and other taxes payable
|
23,466 | 22,283 | ||||||
|
Borrowed money
|
13,018 | 13,016 | ||||||
|
Reserve for dividends to policyholders
|
2,390 | 3,718 | ||||||
|
Reserves for unauthorized reinsurance
|
1,811 | 1,013 | ||||||
|
Payable for securities
|
5,028 | - | ||||||
|
Funds withheld on account of others
|
7,015 | 6,261 | ||||||
|
Accrued salaries and benefits
|
61,353 | 66,847 | ||||||
|
Other liabilities
|
13,917 | 16,329 | ||||||
|
Total liabilities
|
3,413,431 | 3,400,729 | ||||||
|
POLICYHOLDERS' SURPLUS
|
||||||||
|
Capital
|
28,325 | 28,325 | ||||||
|
Aggregate write-ins for special surplus funds
|
40,521 | 33,951 | ||||||
|
Paid in surplus
|
255,792 | 255,792 | ||||||
|
Unassigned surplus
|
748,387 | 663,887 | ||||||
|
Total policyholders' surplus
|
1,073,025 | 981,955 | ||||||
|
Total liabilities and policyholders' surplus
|
$ | 4,486,456 | 4,382,684 | |||||
Selective Insurance Group, Inc.
Combined Insurance Company Subsidiaries
Unaudited Statutory Statements Of Income
($ in thousands)
| Three Months Ended | Twelve Months Ended | |||||||||||||||||||||||||||||||
| December | December | |||||||||||||||||||||||||||||||
|
UNDERWRITING
|
2010
|
2009
|
2010
|
2009
|
||||||||||||||||||||||||||||
|
Net premiums written
|
$ | 301,812 | 304,891 | 1,388,556 | 1,422,655 | |||||||||||||||||||||||||||
|
Net premiums earned
|
353,497 | 352,957 | 1,414,612 | 1,431,047 | ||||||||||||||||||||||||||||
|
Net losses paid
|
195,666 | 185,896 | 784,641 | 757,916 | ||||||||||||||||||||||||||||
|
Change in reserve for losses
|
10,910 | 10,559 | 39,181 | 40,428 | ||||||||||||||||||||||||||||
|
Net losses incurred
|
206,576 | 58.4 | % | 196,455 | 55.7 | % | 823,822 | 58.2 | % | 798,344 | 55.8 | % | ||||||||||||||||||||
|
Net loss expenses paid
|
39,958 | 40,841 | 154,661 | 157,034 | ||||||||||||||||||||||||||||
|
Change in reserve for loss expenses
|
(3,230 | ) | 1,595 | 2,051 | 16,662 | |||||||||||||||||||||||||||
|
Net loss expenses incurred
|
36,728 | 10.4 | % | 42,436 | 12.0 | % | 156,712 | 11.1 | % | 173,696 | 12.1 | % | ||||||||||||||||||||
|
Net underwriting expenses incurred
|
103,578 | 34.3 | % | 110,432 | 36.2 | % | 449,620 | 32.3 | % | 465,723 | 32.7 | % | ||||||||||||||||||||
|
Total deductions
|
346,882 | 349,323 | 1,430,154 | 1,437,763 | ||||||||||||||||||||||||||||
|
Statutory underwriting (loss) / gain
|
6,615 | 3,634 | (15,542 | ) | (6,716 | ) | ||||||||||||||||||||||||||
|
Net loss from premium balances charged off
|
(1,057 | ) | (1,044 | ) | (5,142 | ) | (4,490 | ) | ||||||||||||||||||||||||
|
Finance charges and other income
|
2,907 | 2,735 | 9,590 | 10,455 | ||||||||||||||||||||||||||||
|
Total other income
|
1,850 | -0.6 | % | 1,691 | -0.6 | % | 4,448 | -0.3 | % | 5,965 | -0.4 | % | ||||||||||||||||||||
|
Policyholders' dividends incurred
|
(1,011 | ) | 0.3 | % | (1,372 | ) | 0.4 | % | (3,878 | ) | 0.3 | % | (3,640 | ) | 0.3 | % | ||||||||||||||||
|
Total underwriting (loss) / gain
|
7,454 | 102.8 | % | 3,953 | 103.7 | % | (14,972 | ) | 101.6 | % | (4,391 | ) | 100.5 | % | ||||||||||||||||||
|
INVESTMENT
|
||||||||||||||||||||||||||||||||
|
Net investment income earned
|
39,362 | 37,329 | 138,021 | 133,309 | ||||||||||||||||||||||||||||
|
Net realized (loss) / gain
|
(15,909 | ) | 2,337 | (19,282 | ) | (39,055 | ) | |||||||||||||||||||||||||
|
Total income before income tax
|
30,907 | 43,619 | 103,767 | 89,863 | ||||||||||||||||||||||||||||
|
Federal income tax expense (benefit)
|
(456 | ) | 2,653 | 16,848 | 20,015 | |||||||||||||||||||||||||||
|
Net income
|
$ | 31,363 | 40,966 | 86,919 | 69,848 | |||||||||||||||||||||||||||
|
Policyholders' Surplus
|
||||||||||||||||||||||||||||||||
|
Surplus, beginning of period
|
$ | 1,034,321 | 903,488 | 981,955 | 884,431 | |||||||||||||||||||||||||||
|
Net income
|
31,363 | 40,966 | 86,919 | 69,848 | ||||||||||||||||||||||||||||
|
Change in deferred tax
|
2,941 | (10,666 | ) | 2,169 | 3,972 | |||||||||||||||||||||||||||
|
Change in unrealized gains / (losses)
|
12,506 | 33 | 26,198 | (11,212 | ) | |||||||||||||||||||||||||||
|
Dividends to stockholders
|
(12,002 | ) | - | (48,010 | ) | (24,518 | ) | |||||||||||||||||||||||||
|
Paid in surplus
|
- | - | - | 20,000 | ||||||||||||||||||||||||||||
|
Change in cum. effect of acctg principle
|
- | - | - | 2,540 | ||||||||||||||||||||||||||||
|
Change in reserve for unauthorized
|
(798 | ) | 404 | (798 | ) | 404 | ||||||||||||||||||||||||||
|
Change in non-admitted assets
|
(4,263 | ) | 11,034 | 14,851 | (265 | ) | ||||||||||||||||||||||||||
|
Change in additional admitted deferred tax
|
5,550 | 33,951 | 6,570 | 33,951 | ||||||||||||||||||||||||||||
|
Change in minimum pension liability
|
3,407 | 3,512 | 3,407 | 3,512 | ||||||||||||||||||||||||||||
|
Surplus adjustments
|
- | (767 | ) | (236 | ) | (708 | ) | |||||||||||||||||||||||||
|
Net change in surplus for period
|
38,704 | 78,467 | 91,070 | 97,524 | ||||||||||||||||||||||||||||
|
Surplus, end of period
|
$ | 1,073,025 | 981,955 | 1,073,025 | 981,955 | |||||||||||||||||||||||||||
|
Statutory underwriting (loss) / gain :
|
$ | 7,454 | 3,953 | (14,972 | ) | (4,391 | ) | |||||||||||||||||||||||||
|
Adjustments under GAAP:
|
||||||||||||||||||||||||||||||||
|
Deferred policy acquisition costs
|
(8,963 | ) | (5,093 | ) | (8,974 | ) | 6,283 | |||||||||||||||||||||||||
|
Other, net
|
1,041 | 598 | 1,779 | 493 | ||||||||||||||||||||||||||||
|
GAAP underwriting (loss) / gain:
|
$ | (468 | ) | (542 | ) | (22,167 | ) | 2,385 | ||||||||||||||||||||||||
|
Note: Some amounts or ratios may not foot due to rounding
|
||||||||||||||||||||||||||||||||
|
Selective Insurance Group, Inc. and Consolidated Subsidiaries
|
|||||||||||||||||||||||||||||||||
|
Alternative Investments
|
|||||||||||||||||||||||||||||||||
|
as of December 31, 2010
|
|||||||||||||||||||||||||||||||||
|
(unaudited)
|
|||||||||||||||||||||||||||||||||
|
Paid in
|
|||||||||||||||||||||||||||||||||
|
Inception
|
Original
|
Contributed
|
Remaining
|
Total
|
Current
|
YTD
|
DPI(2)
|
TVPI(3)
|
|||||||||||||||||||||||||
|
Fund
|
Year
|
Commitment
|
Capital
|
Commitment
|
Distributions(1)
|
Market Value
|
Income
|
Ratio
|
Ratio
|
||||||||||||||||||||||||
|
Real Estate
|
|||||||||||||||||||||||||||||||||
|
LEH RE II
|
2005
|
20,000,000 | 17,379,077 | 2,620,923 | 7,516,650 | 10,757,410 | 467,000 | 0.43 | 1.05 | ||||||||||||||||||||||||
|
GS Whitehall 2007
|
2007
|
15,000,000 | 14,250,000 | - | 2,533,307 | - | (1,399,443 | ) | 0.18 | 0.18 | |||||||||||||||||||||||
|
LEH RE III
|
2008
|
15,000,000 | 6,837,113 | 8,162,887 | 58,228 | 3,434,083 | (440,394 | ) | 0.01 | 0.51 | |||||||||||||||||||||||
|
Total - Real Estate
|
50,000,000 | 38,466,190 | 10,783,810 | 10,108,185 | 14,191,493 | (1,372,837 | ) | 0.26 | 0.63 | ||||||||||||||||||||||||
|
Mezzanine Financing
|
|||||||||||||||||||||||||||||||||
|
GS Mezz III
|
2003
|
10,000,000 | 4,362,674 | - | 10,314,718 | - | 253,647 | 2.36 | 2.36 | ||||||||||||||||||||||||
|
LEH Euro Mezz
|
2004
|
9,000,000 | 9,000,000 | - | 12,355,149 | 1,908,910 | (431,003 | ) | 1.37 | 1.58 | |||||||||||||||||||||||
|
GS Mezz 2006
|
2006
|
15,000,000 | 9,771,217 | - | 9,218,019 | - | 3,106,880 | 0.94 | 0.94 | ||||||||||||||||||||||||
|
GS Mezz V
|
2007
|
25,000,000 | 9,747,331 | 15,252,669 | 4,465,931 | 8,320,753 | 878,234 | 0.46 | 1.31 | ||||||||||||||||||||||||
|
Total - Mezz. Financing
|
59,000,000 | 32,881,222 | 15,252,669 | 36,353,817 | 10,229,663 | 3,807,758 | 1.11 | 1.42 | |||||||||||||||||||||||||
|
Distressed Debt
|
|||||||||||||||||||||||||||||||||
|
Varde LP
|
1997
|
4,000,000 | 4,000,000 | - | 12,146,213 | - | 16,619 | 3.04 | 3.04 | ||||||||||||||||||||||||
|
Varde VIII
|
2006
|
10,000,000 | 10,000,000 | - | - | 11,516,005 | (261,120 | ) | - | 1.15 | |||||||||||||||||||||||
|
GS Distressed Opp III
|
2007
|
15,000,000 | 10,389,138 | 4,610,862 | 512,894 | 8,916,134 | 1,492,268 | 0.05 | 0.91 | ||||||||||||||||||||||||
|
Total - Distressed Debt
|
29,000,000 | 24,389,138 | 4,610,862 | 12,659,107 | 20,432,139 | 1,247,767 | 0.52 | 1.36 | |||||||||||||||||||||||||
|
Private Equity
|
|||||||||||||||||||||||||||||||||
|
Prospector
|
1997
|
5,000,000 | 5,000,000 | - | 13,965,078 | 411,444 | (82,867 | ) | 2.79 | 2.88 | |||||||||||||||||||||||
|
Trilantic Capital Partners III
|
2004
|
10,000,000 | 9,099,872 | 900,128 | 9,911,240 | 4,651,020 | 1,546,259 | 1.09 | 1.60 | ||||||||||||||||||||||||
|
NB Co-Invest
|
2006
|
15,000,000 | 11,889,961 | 3,110,039 | 4,527,018 | 9,561,893 | 1,931,091 | 0.38 | 1.18 | ||||||||||||||||||||||||
|
GS PEP Asia
|
2007
|
7,000,000 | 2,589,319 | - | 1,203,640 | 0 | 115,145 | 0.46 | 0.46 | ||||||||||||||||||||||||
|
Trilantic Capital Partners IV
|
2007
|
11,098,351 | 6,785,670 | 4,312,681 | 374,573 | 6,976,825 | 1,048,477 | 0.06 | 1.08 | ||||||||||||||||||||||||
|
Total - Private Equity
|
48,098,351 | 35,364,822 | 8,322,848 | 29,981,549 | 21,601,181 | 4,558,105 | 0.85 | 1.46 | |||||||||||||||||||||||||
|
Private Equity, Secondary Market
|
|||||||||||||||||||||||||||||||||
|
NB SOF
|
2005
|
12,000,000 | 11,100,506 | 899,494 | 5,377,440 | 7,303,448 | 822,525 | 0.48 | 1.14 | ||||||||||||||||||||||||
|
GS Vintage IV
|
2007
|
20,000,000 | 15,674,444 | 4,325,556 | 3,842,962 | 13,849,876 | 3,102,897 | 0.25 | 1.13 | ||||||||||||||||||||||||
|
NB SOF II
|
2008
|
12,000,000 | 5,195,909 | 6,804,091 | 837,111 | 5,556,132 | 865,033 | 0.16 | 1.23 | ||||||||||||||||||||||||
|
GS Vintage V
|
2008
|
10,000,000 | 3,863,279 | - | 2,941,822 | - | 480,849 | 0.76 | 0.76 | ||||||||||||||||||||||||
|
Total - Pvt. Eq. Sec. Mkt.
|
54,000,000 | 35,834,138 | 12,029,141 | 12,999,336 | 26,709,456 | 5,271,303 | 0.36 | 1.11 | |||||||||||||||||||||||||
|
Energy/Power Generation
|
|||||||||||||||||||||||||||||||||
|
ArcLight I
|
2002
|
15,000,000 | 13,344,495 | 1,655,505 | 27,358,382 | 1,294,534 | 168,807 | 2.05 | 2.15 | ||||||||||||||||||||||||
|
ArcLight II
|
2003
|
15,000,000 | 12,704,508 | 2,295,492 | 18,484,819 | 6,059,986 | 2,337,132 | 1.45 | 1.93 | ||||||||||||||||||||||||
|
ArcLight III
|
2006
|
15,000,000 | 12,962,206 | 2,037,794 | 3,998,052 | 14,054,385 | 1,600,582 | 0.31 | 1.39 | ||||||||||||||||||||||||
|
Quintana Energy
|
2006
|
10,000,000 | 7,765,984 | 2,234,016 | 392,978 | 7,292,352 | 879,075 | 0.05 | 0.99 | ||||||||||||||||||||||||
|
ArcLight IV
|
2007
|
10,000,000 | 7,009,043 | 2,990,957 | 3,557,137 | 6,859,171 | 1,453,314 | 0.51 | 1.49 | ||||||||||||||||||||||||
|
Total - Energy/Power Generation
|
65,000,000 | 53,786,236 | 11,213,764 | 53,791,368 | 35,560,428 | 6,438,910 | 1.00 | 1.66 | |||||||||||||||||||||||||
|
Venture Capital
|
|||||||||||||||||||||||||||||||||
|
Venture V
|
2001
|
10,000,000 | 8,600,000 | 1,400,000 | 2,054,791 | 6,385,674 | 362,134 | 0.24 | 0.98 | ||||||||||||||||||||||||
|
Total - Venture Capital
|
10,000,000 | 8,600,000 | 1,400,000 | 2,054,791 | 6,385,674 | 362,134 | 0.24 | 0.98 | |||||||||||||||||||||||||
|
TOTAL - ALTERNATIVE INVESTMENTS
|
$ | 315,098,351 | 229,321,746 | 63,613,094 | 157,948,152 | 135,110,034 | 20,313,140 | 0.69 | 1.28 | ||||||||||||||||||||||||
|
(1) Includes sales proceeds, if applicable.
|
|||||||||||||||||||||||||||||||||
|
(2) Distributed to paid in ratio
|
|||||||||||||||||||||||||||||||||
|
(3) Total value to paid in ratio
|
|||||||||||||||||||||||||||||||||
Selective Insurance Group, Inc. and Consolidated Subsidiaries
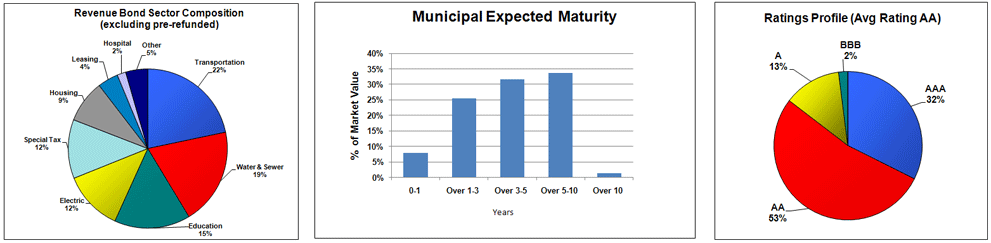
Municipal Bond Portfolio
State and Repayment Source Composition
December 31, 2010
($s in thousands)
(unaudited)
Exposure = 63% Held-to-Maturity; 37% Available-for-Sale
|
Repayment Source Composition by State %s
|
||||||||||||||||||||||||||||||||||||||||
|
Market Values
|
||||||||||||||||||||||||||||||||||||||||
|
State
|
Revenue
|
% of
State
|
General
Obligation
(GO)-Local
|
% of
State
|
General
Obligation
(GO)-State
|
% of
State
|
TX -
Permanent
School Fund
(PSF)
|
% of
State
|
Total
|
% of
Total
|
||||||||||||||||||||||||||||||
|
TX
|
63,934 | 54 | % | 52,622 | 45 | % | 1,030 | 1 | % | - | 0 | % | 117,586 | 8 | % | |||||||||||||||||||||||||
|
TX-PSF
|
- | 0 | % | - | 0 | % | - | 0 | % | 48,542 | 100 | % | 48,542 | 3 | % | |||||||||||||||||||||||||
|
WA
|
45,792 | 50 | % | 45,417 | 50 | % | - | 0 | % | - | 0 | % | 91,209 | 6 | % | |||||||||||||||||||||||||
|
AZ
|
68,206 | 91 | % | 6,778 | 9 | % | - | 0 | % | - | 0 | % | 74,984 | 5 | % | |||||||||||||||||||||||||
|
FL
|
69,463 | 99 | % | - | 0 | % | 509 | 1 | % | - | 0 | % | 69,972 | 5 | % | |||||||||||||||||||||||||
|
NC
|
27,624 | 41 | % | 40,324 | 59 | % | - | 0 | % | - | 0 | % | 67,948 | 5 | % | |||||||||||||||||||||||||
|
NY
|
66,826 | 100 | % | - | 0 | % | - | 0 | % | - | 0 | % | 66,826 | 5 | % | |||||||||||||||||||||||||
|
OH
|
37,547 | 64 | % | 13,764 | 23 | % | 7,367 | 13 | % | - | 0 | % | 58,678 | 4 | % | |||||||||||||||||||||||||
|
IL
|
38,529 | 66 | % | 20,003 | 34 | % | - | 0 | % | - | 0 | % | 58,532 | 4 | % | |||||||||||||||||||||||||
|
MN
|
12,555 | 24 | % | 5,255 | 10 | % | 35,480 | 67 | % | - | 0 | % | 53,290 | 4 | % | |||||||||||||||||||||||||
|
CO
|
22,755 | 45 | % | 26,375 | 52 | % | 1,591 | 3 | % | - | 0 | % | 50,721 | 3 | % | |||||||||||||||||||||||||
|
Pre-refunded
|
52,839 | 56 | % | 28,779 | 31 | % | 12,525 | 13 | % | - | 0 | % | 94,143 | 7 | % | |||||||||||||||||||||||||
|
Other
|
410,264 | 69 | % | 116,516 | 20 | % | 66,970 | 11 | % | - | 0 | % | 593,750 | 41 | % | |||||||||||||||||||||||||
|
Grand Total
|
916,334 | 63 | % | 355,833 | 25 | % | 125,472 | 9 | % | 48,542 | 3 | % | 1,446,181 | 100 | % | |||||||||||||||||||||||||
Selective Insurance Group, Inc. and Consolidated Subsidiaries
Structured Securities
December 31, 2010
($ in thousands)
(unaudited)
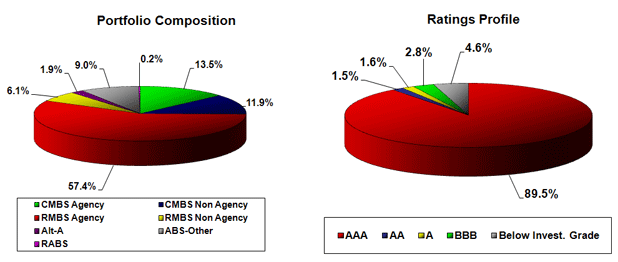
|
Market Value
|
628,811
|
|
Unrealized/Unrecognized Gain/(Losses)
|
10,043
|
|
Held to Maturity (HTM)
|
24%
|
|
Available for Sale (AFS)
|
76%
|
|
Structured Security Portfolio Average Rating
|
AA+
|
|
Structured Security % of Total Portfolio
|
17%
|
Selective Insurance Group, Inc. and Consolidated Subsidiaries
Residential Mortgage Backed (RMBS) and Residential ABS (RABS) Securities
December 31, 2010
($ in thousands)
(unaudited)
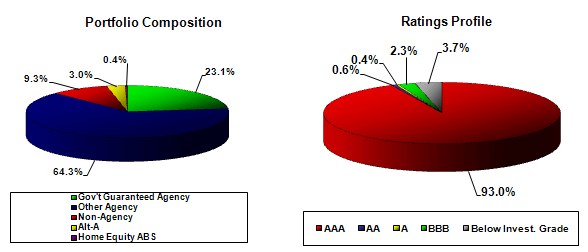
|
Market Value
|
413,064
|
|
Unrealized/Unrecognized Gain/(Losses)
|
8,367
|
|
Held to Maturity (HTM)
|
22%
|
|
Available for Sale (AFS)
|
78%
|
|
RMBS & RABS Portfolio Average Rating
|
AA+
|
|
RMBS & RABS % of Total Portfolio
|
11.5%
|
Selective Insurance Group, Inc. and Consolidated Subsidiaries
Commercial Mortgage Backed (CMBS) Securities
December 31, 2010
($ in thousands)
(unaudited)
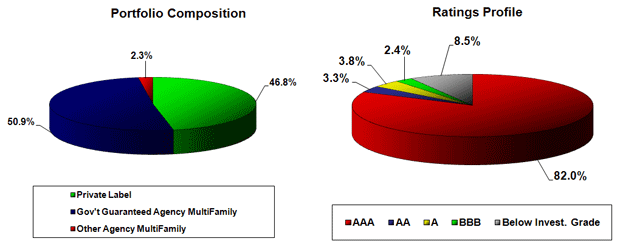
|
Market Value
|
159,404
|
|
Unrealized/Unrecognized Gain/(Losses)
|
1,121
|
|
Held to Maturity (HTM)
|
34%
|
|
Available for Sale (AFS)
|
66%
|
|
CMBS Portfolio Average Rating
|
AA
|
|
CMBS % of Total Portfolio
|
4.4%
|
|
Selective Insurance Group, Inc. and Consolidated Subsidiaries
|
||||||||||||
|
Credit Quality of Available-for-Sale Fixed Maturity Securities
|
||||||||||||
|
December 31, 2010
|
||||||||||||
|
($ in millions)
|
||||||||||||
|
(unaudited)
|
||||||||||||
|
Fair Value
|
Unrealized
Gain (Loss)
|
Average
Credit
Quality
|
||||||||||
|
AFS Fixed Maturity Portfolio:
|
||||||||||||
|
U.S. government obligations1
|
$ | 320.5 | 8.1 |
AAA
|
||||||||
|
Foreign government obligations
|
19.0 | - |
AA
|
|||||||||
|
State and municipal obligations
|
533.9 | 21.9 |
AA+
|
|||||||||
|
Corporate securities
|
993.7 | 19.9 | A | |||||||||
|
Mortgage-backed securities ("MBS")
|
426.9 | 6.7 |
AA+
|
|||||||||
|
Asset-backed securities ("ABS")2
|
48.7 | 0.2 |
AAA
|
|||||||||
|
Total AFS fixed maturity portfolio
|
$ | 2,342.7 | 56.8 |
AA
|
||||||||
|
State and Municipal Obligations:
|
||||||||||||
|
Government obligations
|
$ | 289.6 | 11.1 |
AA+
|
||||||||
|
Special revenue obligations
|
244.3 | 10.8 |
AA
|
|||||||||
|
Total state and municipal obligations
|
$ | 533.9 | 21.9 |
AA+
|
||||||||
|
Corporate Securities:
|
||||||||||||
|
Financial
|
$ | 289.9 | 4.5 | A+ | ||||||||
|
Industrials
|
77.0 | 3.6 | A- | |||||||||
|
Utilities
|
56.5 | 0.2 |
BBB+
|
|||||||||
|
Consumer discretion
|
98.9 | 1.1 | A- | |||||||||
|
Consumer staples
|
101.6 | 2.1 | A- | |||||||||
|
Health care
|
138.0 | 4.1 |
AA-
|
|||||||||
|
Materials
|
57.0 | 0.8 | A- | |||||||||
|
Energy
|
49.5 | 1.2 | A | |||||||||
|
Information technology
|
51.5 | 0.4 | A+ | |||||||||
|
Telecommunications services
|
50.5 | 0.2 | A- | |||||||||
|
Other
|
23.3 | 1.7 |
AA+
|
|||||||||
|
Total corporate securities
|
$ | 993.7 | 19.9 | A | ||||||||
|
Mortgage-backed securities:
|
||||||||||||
|
Government Guaranteed Agency CMBS
|
$ | 71.9 | 3.3 |
AAA
|
||||||||
|
Non-agency CMBS
|
32.6 | (2.1 | ) | A- | ||||||||
|
Government Guaranteed Agency RMBS
|
91.1 | 3.0 |
AAA
|
|||||||||
|
Other Agency RMBS
|
183.6 | 3.8 |
AAA
|
|||||||||
|
Non-agency RMBS
|
38.3 | (1.0 | ) |
BBB
|
||||||||
|
Alternative-A ("Alt-A") RMBS
|
9.4 | (0.3 | ) |
AAA
|
||||||||
|
Total MBS
|
$ | 426.9 | 6.7 |
AA+
|
||||||||
|
Asset-backed securities:
|
||||||||||||
|
ABS
|
$ | 47.8 | 0.2 |
AAA
|
||||||||
|
Sub-prime ABS2,3
|
0.9 | - | D | |||||||||
|
Total ABS
|
$ | 48.7 | 0.2 |
AAA
|
||||||||
|
1 U.S. Government includes coporate securities fully guaranteed by the FDIC.
|
|||||
|
2 We define sub-prime exposure as exposure to direct and indirect investments in non-agency residential mortgages with average FICO® scores below 650.
|
|||||
|
3 Sub-prime ABS includes one security which is currently expected to default on its obligations according to the rating agencies.
|
|||||
|
Selective Insurance Group, Inc. and Consolidated Subsidiaries
|
||||||||||||||||||||||||
|
Credit Quality of Held-to-Maturity Securities
|
||||||||||||||||||||||||
|
December 31, 2010
|
||||||||||||||||||||||||
|
($ in millions)
|
||||||||||||||||||||||||
|
(unaudited)
|
||||||||||||||||||||||||
|
Fair Value
|
Carry Value
|
Unrecognized
Holding
Gain (Loss)
|
Unrealized
Gain (Loss)
in
Accumulated
Other
Comprehensive
Income
|
Total
Unrealized /
Unrecognized
Gain (Loss)
|
Average
Credit
Quality
|
|||||||||||||||||||
|
HTM Fixed Maturity Portfolio:
|
||||||||||||||||||||||||
|
U.S. government obligations1
|
$ | 103.1 | 98.1 | 5.0 | 4.7 | 9.7 |
AAA
|
|||||||||||||||||
|
Foreign government obligations
|
5.6 | 5.6 | - | 0.3 | 0.3 |
AA+
|
||||||||||||||||||
|
State and municipal obligations
|
912.3 | 896.6 | 15.7 | 22.2 | 37.9 |
AA
|
||||||||||||||||||
|
Corporate securities
|
82.1 | 72.7 | 9.4 | (4.0 | ) | 5.4 | A- | |||||||||||||||||
|
Mortgage-backed securities ("MBS")
|
141.3 | 130.8 | 10.5 | (6.3 | ) | 4.2 |
AAA
|
|||||||||||||||||
|
Asset-backed securities ("ABS")
|
11.9 | 10.5 | 1.4 | (2.4 | ) | (1.0 | ) | A | ||||||||||||||||
|
Total HTM fixed maturity portfolio
|
$ | 1,256.3 | 1,214.3 | 42.0 | 14.5 | 56.5 |
AA
|
|||||||||||||||||
|
State and Municipal Obligations:
|
||||||||||||||||||||||||
|
Government obligations
|
$ | 240.3 | 236.8 | 3.5 | 9.7 | 13.2 |
AA
|
|||||||||||||||||
|
Special revenue obligations
|
672.0 | 659.8 | 12.2 | 12.5 | 24.7 |
AA
|
||||||||||||||||||
|
Total state and municipal obligations
|
$ | 912.3 | 896.6 | 15.7 | 22.2 | 37.9 |
AA
|
|||||||||||||||||
|
Corporate Securities:
|
||||||||||||||||||||||||
|
Financial
|
$ | 23.5 | 20.0 | 3.5 | (2.5 | ) | 1.0 | A- | ||||||||||||||||
|
Industrials
|
22.8 | 19.4 | 3.4 | (1.2 | ) | 2.2 | A | |||||||||||||||||
|
Utilities
|
16.9 | 16.1 | 0.8 | (0.1 | ) | 0.7 |
BBB
|
|||||||||||||||||
|
Consumer discretion
|
7.7 | 7.1 | 0.6 | 0.2 | 0.8 |
AA-
|
||||||||||||||||||
|
Consumer staples
|
5.4 | 4.9 | 0.5 | (0.1 | ) | 0.4 | A | |||||||||||||||||
|
Materials
|
2.1 | 1.9 | 0.2 | (0.1 | ) | 0.1 |
BBB-
|
|||||||||||||||||
|
Energy
|
3.7 | 3.3 | 0.4 | (0.2 | ) | 0.2 |
BB+
|
|||||||||||||||||
|
Total corporate securities
|
$ | 82.1 | 72.7 | 9.4 | (4.0 | ) | 5.4 | A- | ||||||||||||||||
|
Mortgage-backed securities:
|
||||||||||||||||||||||||
|
Government guaranteed agency CMBS
|
$ | 9.2 | 8.9 | 0.3 | - | 0.3 |
AAA
|
|||||||||||||||||
|
Other agency CMBS
|
3.6 | 3.6 | - | - | - |
AAA
|
||||||||||||||||||
|
Non-agency CMBS
|
42.1 | 35.0 | 7.1 | (7.4 | ) | (0.3 | ) |
AA+
|
||||||||||||||||
|
Government guaranteed agency RMBS
|
4.5 | 4.0 | 0.5 | (0.1 | ) | 0.4 |
AAA
|
|||||||||||||||||
|
Other agency RMBS
|
81.8 | 79.2 | 2.6 | 1.2 | 3.8 |
AAA
|
||||||||||||||||||
|
Non-agency RMBS
|
0.1 | 0.1 | - | - | - |
BBB
|
||||||||||||||||||
|
Total mortgage-backed securities
|
$ | 141.3 | 130.8 | 10.5 | (6.3 | ) | 4.2 |
AAA
|
||||||||||||||||
|
Asset-backed securities:
|
||||||||||||||||||||||||
|
ABS
|
$ | 9.1 | 8.0 | 1.1 | (0.9 | ) | 0.2 | A- | ||||||||||||||||
|
Alt-A ABS
|
2.8 | 2.5 | 0.3 | (1.5 | ) | (1.2 | ) |
AA-
|
||||||||||||||||
|
Total ABS
|
$ | 11.9 | 10.5 | 1.4 | (2.4 | ) | (1.0 | ) | A | |||||||||||||||
|
1 U.S. Government includes coporate securities fully guaranteed by the FDIC.
|
||||||||||||||||||||||||