Attached files
| file | filename |
|---|---|
| 8-K - FORM 8-K - ManpowerGroup Inc. | form_8k.htm |
| EX-99.3 - OPERATING UNIT RESULTS - ManpowerGroup Inc. | exhibit_99-3.htm |
| EX-99.1 - PRESS RELEASE DATED FEBRUARY 2, 2011 - ManpowerGroup Inc. | exhibit_99-1.htm |
Exhibit 99.2

2011 February 2
2010 4th Quarter
Manpower Inc.

Manpower Inc. 2010 4th Quarter Results
February 2011
2
This presentation includes forward-looking
statements, including earnings projections
which are subject to risks and uncertainties.
Actual results might differ materially from
those projected in the forward-looking
statements. Additional information
concerning factors that could cause actual
results to materially differ from those in the
forward-looking statements is contained in
the Company’s Annual Report on Form 10-K
dated December 31, 2009, which information
is incorporated herein by reference, and
such other factors as may be described from
time to time in the Company’s SEC filings.
Forward-Looking Statement

Manpower Inc. 2010 4th Quarter Results
February 2011
3
42% CC
N/A
N/A
18%
22% CC
760 bps
Operating Loss ($343M)
OP Margin (6.6%)
Revenue $5.2B
Gross Margin 17.4%
EPS ($4.29)
30 bps
Q4 Highlights
Throughout this presentation, the difference between reported variances and Constant Currency (CC) variances
represents the impact of currency on our financial results. Constant Currency is further explained on our Web site.
represents the impact of currency on our financial results. Constant Currency is further explained on our Web site.
Consolidated Financial Highlights
Excluding
Non-recurring
Items
Items
As
Reported
(1)
(1) Excludes non-recurring items for 2010 as set forth on page 4, and reorganization expenses in 2009.
18%
22% CC
30 bps
110%
122% CC
100 bps
38%
N/A
N/A

Manpower Inc. 2010 4th Quarter Results
February 2011
4
Q4 Non-Recurring Items
($ in millions, except per share amounts)
($ in millions, except per share amounts)
(1) Includes reorganization charges for Jefferson Wells ($6.1M), France ($7.6M) and Right Management ($16.8M).
(2) Includes goodwill and intangible asset impairment charges for Jefferson Wells ($32.9M) and Right Management
($395.9M).
($395.9M).

Manpower Inc. 2010 4th Quarter Results
February 2011
5
Consolidated Gross Margin Change

Manpower Inc. 2010 4th Quarter Results
February 2011
6
SG&A Expense Sequential Bridge - Q4 vs. Q3
(in millions of USD)

Manpower Inc. 2010 4th Quarter Results
February 2011
7
46% CC
Americas Segment
(22% of Revenue)
(22% of Revenue)
Q4 Financial Highlights
47%
OUP Margin
2.1%
280 bps
Revenue
$1.1B
OUP
$24M
Operating Unit Profit (OUP) is the measure that we use to evaluate segment performance. OUP is equal to segment
revenues less direct costs and branch and national headquarters operating costs.
revenues less direct costs and branch and national headquarters operating costs.
(1) Included in these amounts is the US, which had revenue of $777M (+62%) and OUP of $14M. On an
organic basis, US revenue was $563M and OUP was $4M. Included in the US is Jefferson Wells, which
had revenue of $44M and OUP of -$9M, including $6.1M of reorganization charges.
organic basis, US revenue was $563M and OUP was $4M. Included in the US is Jefferson Wells, which
had revenue of $44M and OUP of -$9M, including $6.1M of reorganization charges.
(2) On an organic basis, Americas revenue increased 19% in USD (18% in CC).
(3) Excludes the impact of the reorganization charges of $6.1M in 2010 and $1.1M in 2009.
(1)
N/A
N/A
46% CC
47%
230 bps
(2)
(2)
Excluding
Non-recurring
Items
Items
As
Reported
(3)
N/A
N/A
Manpower Inc. 2010 4th Quarter Results
February 2011
8
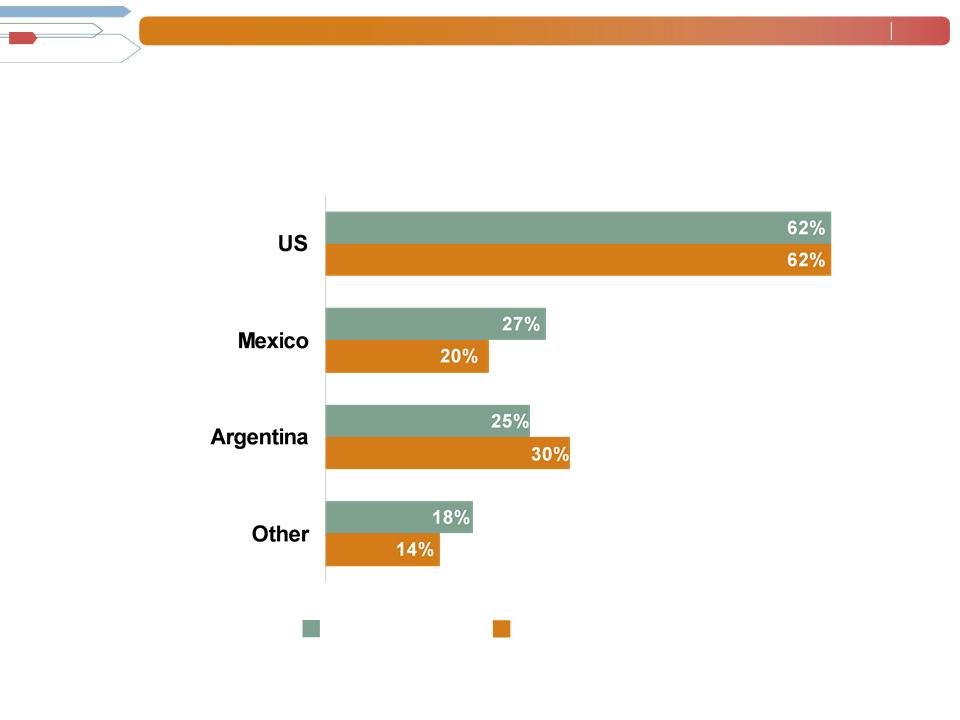
Americas - Q4 Revenue Growth YoY
Revenue Growth - CC
Revenue Growth
% of Segment
Revenue
69%
11%
6%
14%
(1) On an organic basis, US revenue (including Jefferson Wells) was $563M (+18%).
(1)
Manpower Inc. 2010 4th Quarter Results
February 2011
9
France Segment
(27% of Revenue)
(27% of Revenue)
19% CC
Q4 Financial Highlights
10%
OUP Margin
0.8%
70 bps
Revenue
$1.4B
OUP
$12M
19% CC
10%
40 bps
Excluding
Non-recurring
Items
Items
As
Reported
157% CC
138%
119% CC
101%
(1) Excludes the impact of $7.6M of reorganization charges in 2010, and $4.7M of reorganization charges in
2009.
2009.
(1)

Manpower Inc. 2010 4th Quarter Results
February 2011
10
EMEA Segment
(38% of Revenue)
(38% of Revenue)
19% CC
Q4 Financial Highlights
13%
OUP Margin
4.1%
160 bps
Revenue
$2.0B
OUP
$82M
19% CC
13%
190 bps
Excluding
Non-recurring
Items
Items
As
Reported
128% CC
116%
95% CC
85%
(1) Excludes the impact of the reorganization charges of $6.4M in 2009.
(1)
Manpower Inc. 2010 4th Quarter Results
February 2011
11
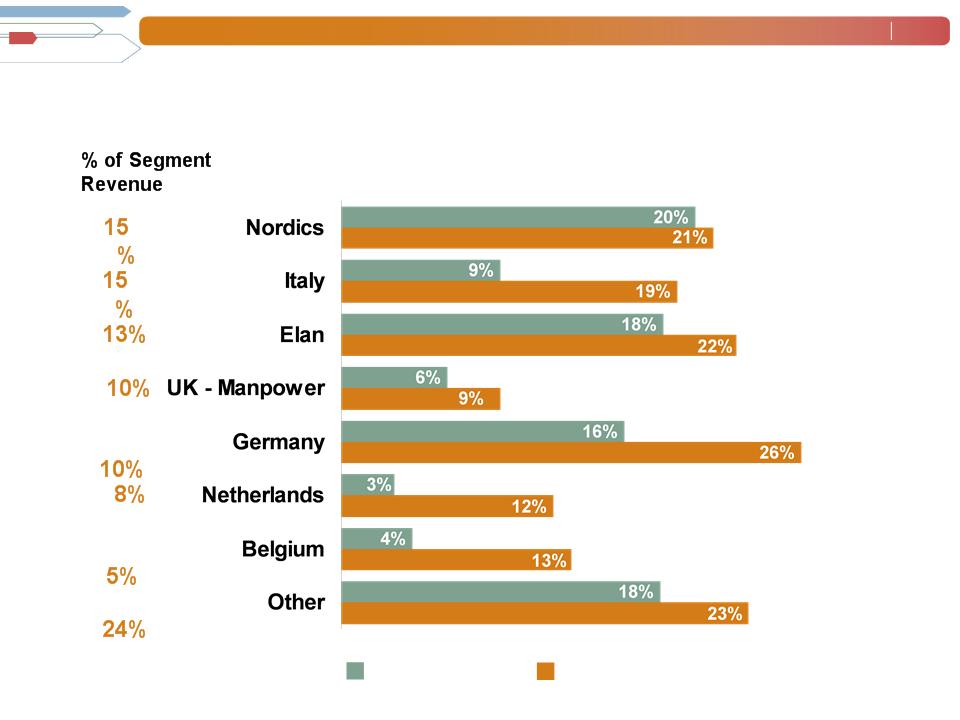
EMEA - Q4 Revenue Growth YoY
Revenue Growth - CC
Revenue Growth

Manpower Inc. 2010 4th Quarter Results
February 2011
12
Asia Pacific Segment
(11% of Revenue)
(11% of Revenue)
16% CC
Q4 Financial Highlights
26%
OUP Margin
1.7%
10 bps
Revenue
$588M
OUP
$10M
16% CC
26%
20 bps
Excluding
Non-recurring
Items
Items
As
Reported
32% CC
42%
25% CC
34%
(1) Excludes the impact of the reorganization charges of $0.4M in 2009.
(1)

Manpower Inc. 2010 4th Quarter Results
February 2011
13
Asia Pacific - Q4 Revenue Growth YoY
Revenue Growth - CC
Revenue Growth
% of Segment
Revenue
47%
29%
24%

Manpower Inc. 2010 4th Quarter Results
February 2011
14
Right Management Segment
(2% of Revenue)
(2% of Revenue)
32% CC
Q4 Financial Highlights
33%
OUP Margin
(19%)
1600 bps
Revenue
$87M
OUP
($17M)
32% CC
33%
3540 bps
Excluding
Non-recurring
Items
Items
As
Reported
N/A
N/A
(1) Excludes the impact of the reorganization charges of $16.8M in 2010.
(1)
N/A
N/A

Manpower Inc. 2010 4th Quarter Results
February 2011
15
Cash Flow Summary - Full Year
2010
2009
Cash from Operations
182
414
Capital Expenditures
(58)
(35)
Free Cash Flow
124
379
($ in millions)
Other
(28)
Change in Cash
(242)
141
(26)
Change in Debt
(270)
(227)
Effect of Exchange Rate Changes
(18)
37
Acquisitions of Businesses,
net of cash acquired
(22)
(15)
Share Repurchases
(35)
-

Manpower Inc. 2010 4th Quarter Results
February 2011
16
Balance Sheet Highlights
Total Debt
($ in millions)
Total Debt to
Total Capitalization
Total Debt
Net Debt
2010
2010

Manpower Inc. 2010 4th Quarter Results
February 2011
17
(b)
(b)
Credit Facilities as of December 31, 2010
($ in millions)
($ in millions)
(a)
(a)
This $400M agreement requires, as of December 31, that we comply with a Debt-to-EBITDA ratio of less than 5.25 to 1 and a fixed charge
coverage ratio of greater than 1.25 to 1. As defined in the agreement, we had a Debt-to-EBITDA ratio of 1.60 and a fixed charge coverage
ratio of 2.41 as of December 31, 2010. As of December 31, there were $2.2M of standby letters of credit issued under the agreement.
coverage ratio of greater than 1.25 to 1. As defined in the agreement, we had a Debt-to-EBITDA ratio of 1.60 and a fixed charge coverage
ratio of 2.41 as of December 31, 2010. As of December 31, there were $2.2M of standby letters of credit issued under the agreement.
Represents subsidiary uncommitted lines of credit & overdraft facilities, which total $395.7M. Total subsidiary borrowings are limited to $300M
due to restrictions in our Revolving Credit Facility, with the exception of Q3 when subsidiary borrowings are limited to $600M.
due to restrictions in our Revolving Credit Facility, with the exception of Q3 when subsidiary borrowings are limited to $600M.
Interest
Rate
Maturity
Date
Total
Outstanding
Remaining
Available
Euro Notes:
- Euro 200M
4.86%
Jun 2013
267
-
- Euro 300M
4.58%
Jun 2012
401
-
Revolving Credit Agreement
2.81%
Nov 2012
-
398
368
Uncommitted lines and Other
Various
Various
30
Total Debt
698
766
Manpower Inc. 2010 4th Quarter Results
February 2011
18
First Quarter Outlook
Revenue
Americas
Up 39-41% in constant currency
France
Up 16-18% in constant currency
Up 8-10% in constant currency
Asia Pacific
Right Management
Down 21-23% in constant currency
Up 18-20% in constant currency
Total
Gross Profit Margin
17.0-17.2%
Operating Profit Margin
1.3-1.5%
Tax Rate
56% (39% excl. reclassification of
France business tax)
France business tax)
EPS
$0.26-$0.34
EMEA
Up 15-17% in constant currency

Manpower Inc. 2010 4th Quarter Results
February 2011
19
Strategic Priorities
To achieve our vision, better service our clients and candidates, and differentiate
ourselves from our competition, the Manpower group of companies will focus on:
ourselves from our competition, the Manpower group of companies will focus on:
Manpower Experience
• Candidate Experience
• Client Experience
Digital Strategy
• Direct Talent
• Direct Office
• Direct Time
Professional
• ICT, Engineering, Finance and
Accounting, Healthcare
Accounting, Healthcare
• Go-to-Market Strategy
• Enhanced Business Model
New Services & Sectors
• Manpower Business Solutions
-RPO (Recruitment Process Outsourcing)
-MSP (Managed Service Provider)
-TBO (Task Based Outsourcing)
-BTS (Borderless Talent Solutions)
• Workforce Strategy
• Government Sector

Manpower Inc. 2010 4th Quarter Results
February 2011
20
Questions?
Answers