Attached files
| file | filename |
|---|---|
| 8-K - FORM 8-K - MALVERN FEDERAL BANCORP INC | t69672_8k.htm |
| EX-99.1 - EXHIBIT 99.1 - MALVERN FEDERAL BANCORP INC | ex99-1.htm |
Exhibit 99.2
 |
Annual Meeting
February 3, 2011
M
A
L
V
E
R
N
|
 |
Forward-Looking Statements 3 2 Certain comments in this presentation contain certain forward looking statements (as defined in the Securities Exchange Act of 1934 and the regulations thereunder). Forward looking statements are not historical facts but instead represent only the beliefs, expectations or opinions of Malvern Federal Bancorp, Inc. and its management regarding future events, many of which, by their nature, are inherently uncertain. Forward looking statements may be identified by the use of such words as: “believe”, “expect”, “anticipate”, “intend”, “plan”, “estimate”, or words of similar meaning, or future or conditional terms such as “will”, “would”, “should”, “could”, “may”, “likely”, “probably”, or “possibly.” Forward looking statements include, but are not limited to, financial projections and estimates and their underlying assumptions; statements regarding plans, objectives and expectations with respect to future operations, products and services; and statements regarding future performance. Such statements are subject to certain risks, uncertainties and assumptions, many of which are difficult to predict and generally are beyond the control of Malvern Federal Bancorp, Inc. and its management, that could cause actual results to differ materially from those expressed in, or implied or projected by, forward looking statements. The following factors, among others, could cause actual results to differ materially from the anticipated results or other expectations expressed in the forward looking statements: (1) economic and competitive conditions which could affect the volume of loan originations, deposit flows and real estate values; (2) the levels of non-interest income and expense and the amount of loan losses; (3) competitive pressure among depository institutions increasing significantly; (4) changes in the interest rate environment causing reduced interest margins; (5) general economic conditions, either nationally or in the markets in which Malvern Federal Bancorp, Inc. is or will be doing business, being less favorable than expected; (6) political and social unrest, including acts of war or terrorism; or (7) legislation or changes in regulatory requirements adversely affecting the business in which Malvern Federal Bancorp, Inc. is engaged. Malvern Federal Bancorp, Inc. undertakes no obligation to update these forward looking statements to reflect events or circumstances that occur after the date on which such statements were made. For a more detailed description of the factors that may affect Malvern Federal Bancorp’s operating results or the outcomes described in these forward-looking statements, we refer you to our filings with the Securities and Exchange Commission, including our annual report on Form 10-K for the year ended September 30, 2010. Malvern Federal Bancorp assumes no obligation to update the forward-looking statements made during this presentation. For more information, please visit our Web site www.malvernfederal.com.
M
A
L
V
E
R
N
|
 |
Company Overview
M
A
L
V
E
R
N
M
A
L
V
E
R
N
|
 |
19
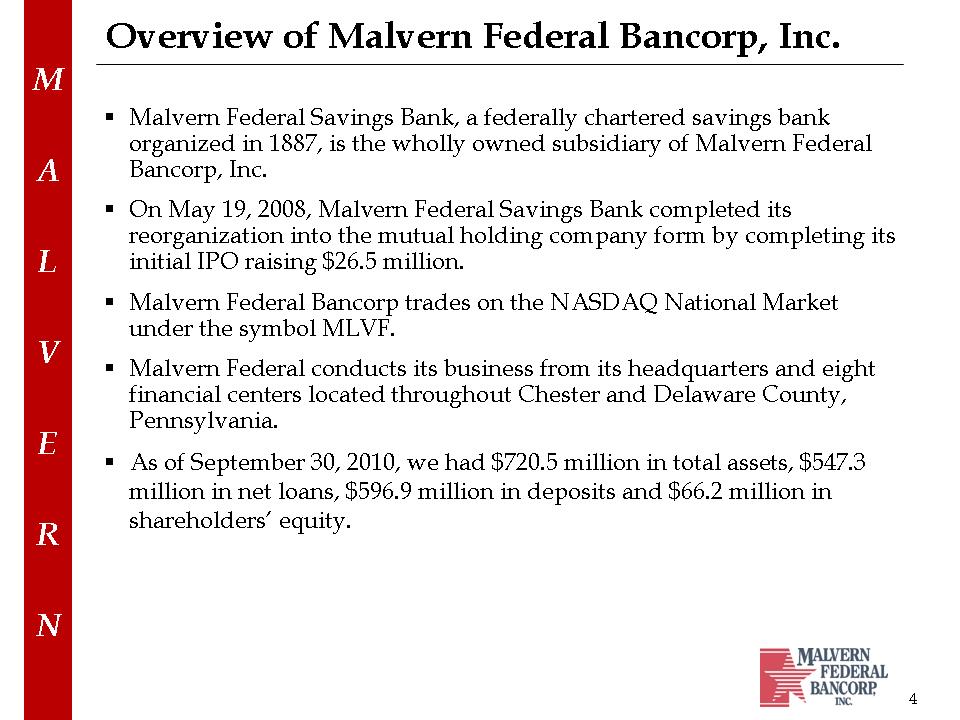
Overview of Malvern Federal Bancorp, Inc.
4
. Malvern Federal Savings Bank, a federally chartered savings bank
organized in 1887, is the wholly owned subsidiary of Malvern Federal
Bancorp, Inc.
. On May 19, 2008, Malvern Federal Savings Bank completed its
reorganization into the mutual holding company form by completing its
initial IPO raising $26.5 million.
. Malvern Federal Bancorp trades on the NASDAQ National Market
under the symbol MLVF.
. Malvern Federal conducts its business from its headquarters and eight
financial centers located throughout Chester and Delaware County,
Pennsylvania.
. As of September 30, 2010, we had $720.5 million in total assets, $547.3
million in net loans, $596.9 million in deposits and $66.2 million in
shareholders’ equity.
M
A
L
V
E
R
N
|
 |
6
Malvern Federal Savings Bank Branch Locations
.42 East Lancaster Ave.
Paoli
•Paoli Financial Center
34 East Lancaster Ave.
•Malvern Financial Center
100 West King Street
•Exton Financial Center
109 North Pottstown Pike
•Lionville Financial Center
537 West Uwchlan Ave.
•Coventry Financial Center
1000 Ridge Road
•Berwyn Financial Center
650 Lancaster Ave.
•Westtown Financial Center
100 Skiles Boulevard
•Concordville Financial Center
940 Baltimore Pike
5
M
A
L
V
E
R
N
Headquarters
Banking Offices
|
 |
12
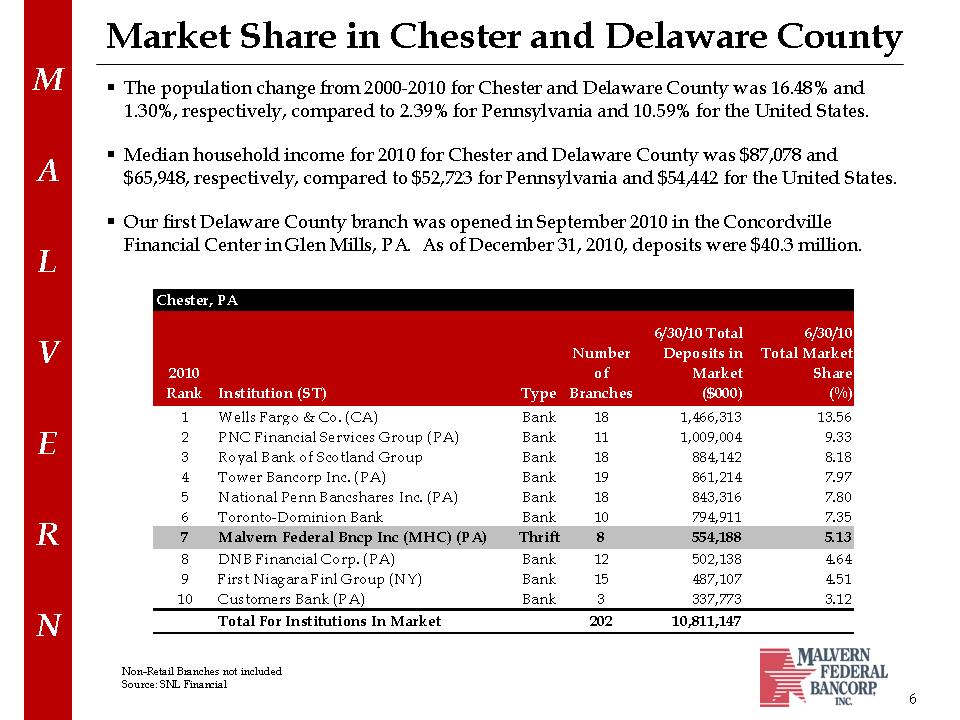
Market Share in Chester and Delaware County
6
Non-Retail Branches not included
Source: SNL Financial
. The population change from 2000-2010 for Chester and Delaware County was 16.48% and
1.30%, respectively, compared to 2.39% for Pennsylvania and 10.59% for the United States.
. Median household income for 2010 for Chester and Delaware County was $87,078 and
$65,948, respectively, compared to $52,723 for Pennsylvania and $54,442 for the United States.
. Our first Delaware County branch was opened in September 2010 in the Concordville
Financial Center in Glen Mills, PA. As of December 31, 2010, deposits were $40.3 million.
M
A
L
V
E
R
N
Chester, PA
2010
Rank Institution (ST) Type
Number
of
Branches
6/30/10 Total
Deposits in
Market
($000)
6/30/10
Total Market
Share
(%)
1 Wells Fargo & Co. (CA) Bank 18 1,466,313 13.56
2 PNC Financial Services Group (PA) Bank 11 1,009,004 9.33
3 Royal Bank of Scotland Group Bank 18 884,142 8.18
4 Tower Bancorp Inc. (PA) Bank 19 861,214 7.97
5 National Penn Bancshares Inc. (PA) Bank 18 843,316 7.80
6 Toronto-Dominion Bank Bank 10 794,911 7.35
7 Malvern Federal Bncp Inc (MHC) (PA) Thrift 8 554,188 5.13
8 DNB Financial Corp. (PA) Bank 12 502,138 4.64
9 First Niagara Finl Group (NY) Bank 15 487,107 4.51
10 Customers Bank (PA) Bank 3 337,773 3.12
Total For Institutions In Market 202 10,811,147
|
 |
19
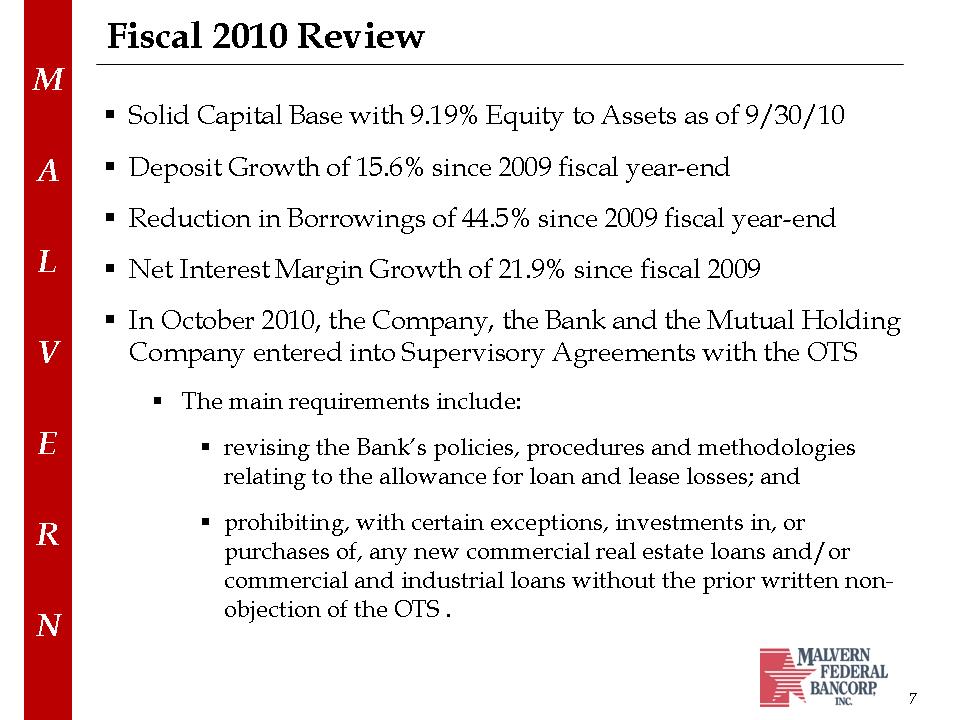
Fiscal 2010 Review
7
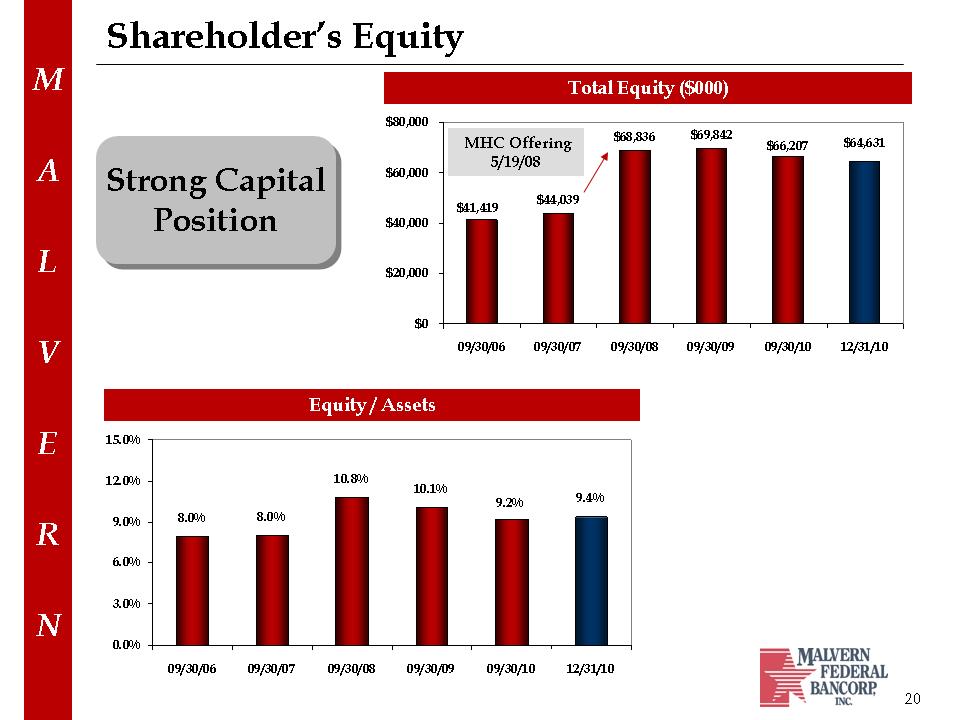
. Solid Capital Base with 9.19% Equity to Assets as of 9/30/10
. Deposit Growth of 15.6% since 2009 fiscal year-end
. Reduction in Borrowings of 44.5% since 2009 fiscal year-end
. Net Interest Margin Growth of 21.9% since fiscal 2009
. In October 2010, the Company, the Bank and the Mutual Holding
Company entered into Supervisory Agreements with the OTS
. The main requirements include:
. revising the Bank’s policies, procedures and methodologies
relating to the allowance for loan and lease losses; and
. prohibiting, with certain exceptions, investments in, or
purchases of, any new commercial real estate loans and/or
commercial and industrial loans without the prior written nonobjection
of the OTS .
M
A
L
V
E
R
N
|
 |
19
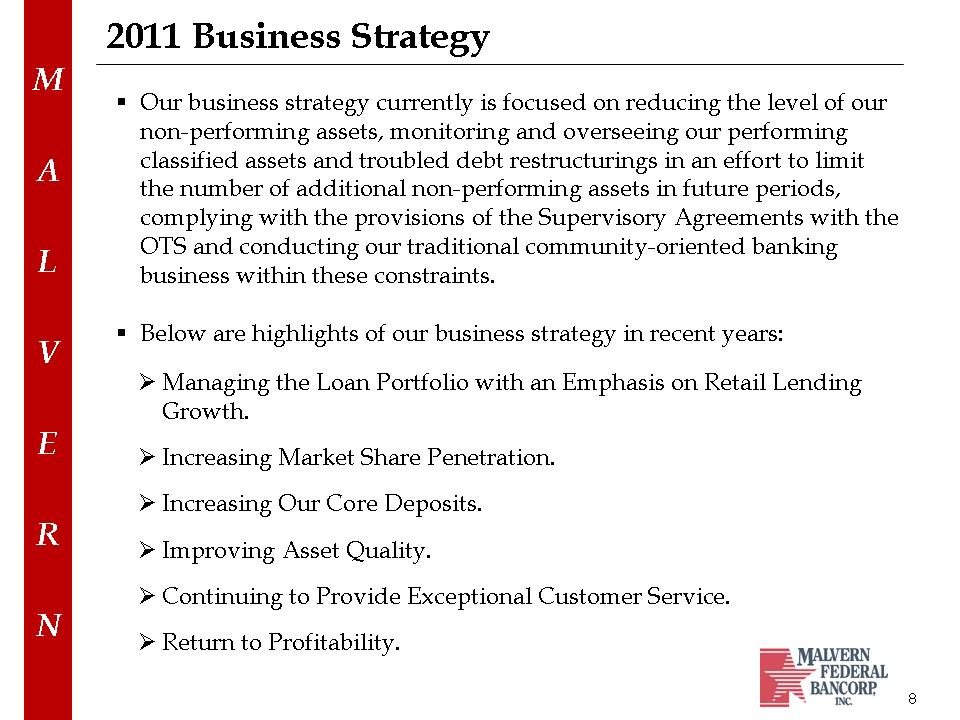
2011 Business Strategy
8
. Our business strategy currently is focused on reducing the level of our
non-performing assets, monitoring and overseeing our performing
classified assets and troubled debt restructurings in an effort to limit
the number of additional non-performing assets in future periods,
complying with the provisions of the Supervisory Agreements with the
OTS and conducting our traditional community-oriented banking
business within these constraints.
. Below are highlights of our business strategy in recent years:
M
A
L
V
E
R
N
. Managing the Loan Portfolio with an Emphasis on Retail Lending
Growth.
. Increasing Market Share Penetration.
. Increasing Our Core Deposits.
. Improving Asset Quality.
. Continuing to Provide Exceptional Customer Service.
. Return to Profitability.
|
 |
Financial Highlights
M
A
L
V
E
R
N
M
A
L
V
E
R
N
|
 |
9
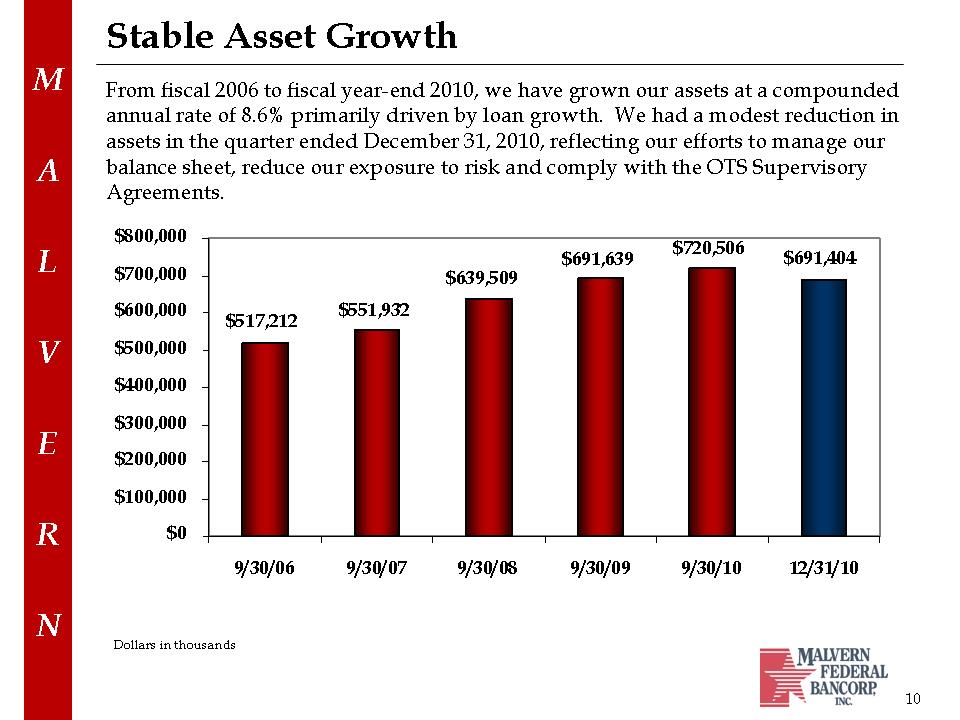
Stable Asset Growth
From fiscal 2006 to fiscal year-end 2010, we have grown our assets at a compounded
annual rate of 8.6% primarily driven by loan growth. We had a modest reduction in
assets in the quarter ended December 31, 2010, reflecting our efforts to manage our
balance sheet, reduce our exposure to risk and comply with the OTS Supervisory
Agreements.
10
M
A
L
V
E
R
N
$517,212 $551,932
$639,509
$691,639 $720,506 $691,404
$0
$100,000
$200,000
$300,000
$400,000
$500,000
$600,000
$700,000
$800,000
9/30/06 9/30/07 9/30/08 9/30/09 9/30/10 12/31/10
Dollars in thousands
|
 |
12
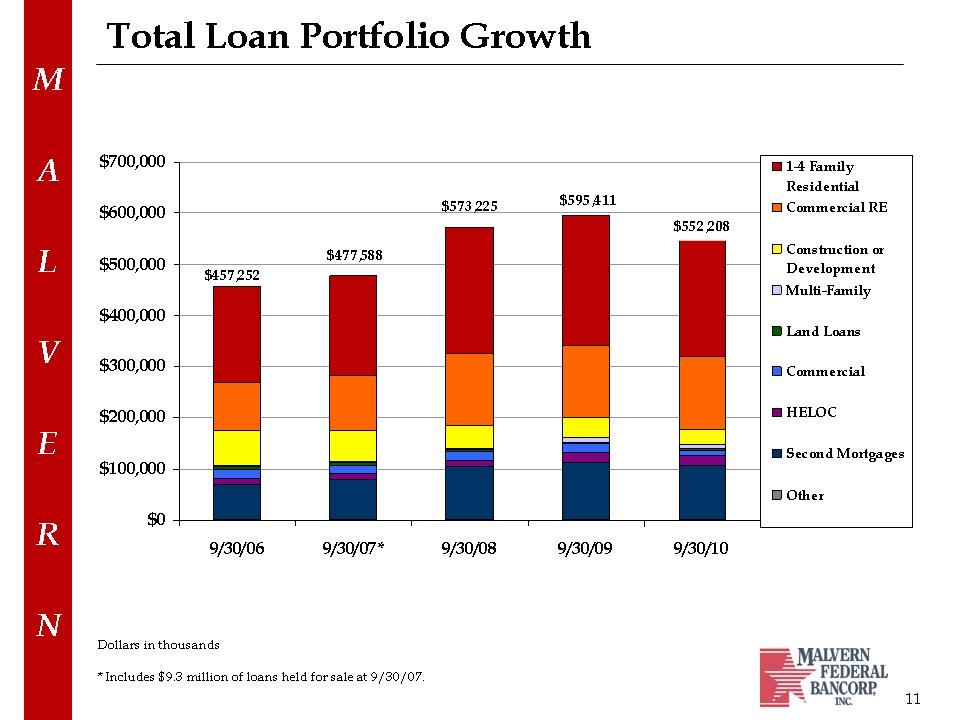
Total Loan Portfolio Growth
11
Dollars in thousands
* Includes $9.3 million of loans held for sale at 9/30/07.
M
A
L
V
E
R
N
$0
$100,000
$200,000
$300,000
$400,000
$500,000
$600,000
$700,000
9/30/06 9/30/07* 9/30/08 9/30/09 9/30/10
1-4 Family
Residential
Commercial RE
Construction or
Development
Multi-Family
Land Loans
Commercial
HELOC
SecondMortgages
Other
$552,208
$457,252
$477,588
$573,225 $595,411
2.38%
0.60% 0.51%
1.52%
3.60%
0.98%
2.61% 2.39%
0.66% 0.58%
0.00%
1.00%
2.00%
3.00%
4.00%
5.00%
09/30/06 09/30/07 09/30/08 09/30/09 09/30/10
MLVF Peer Average
|
 |
14
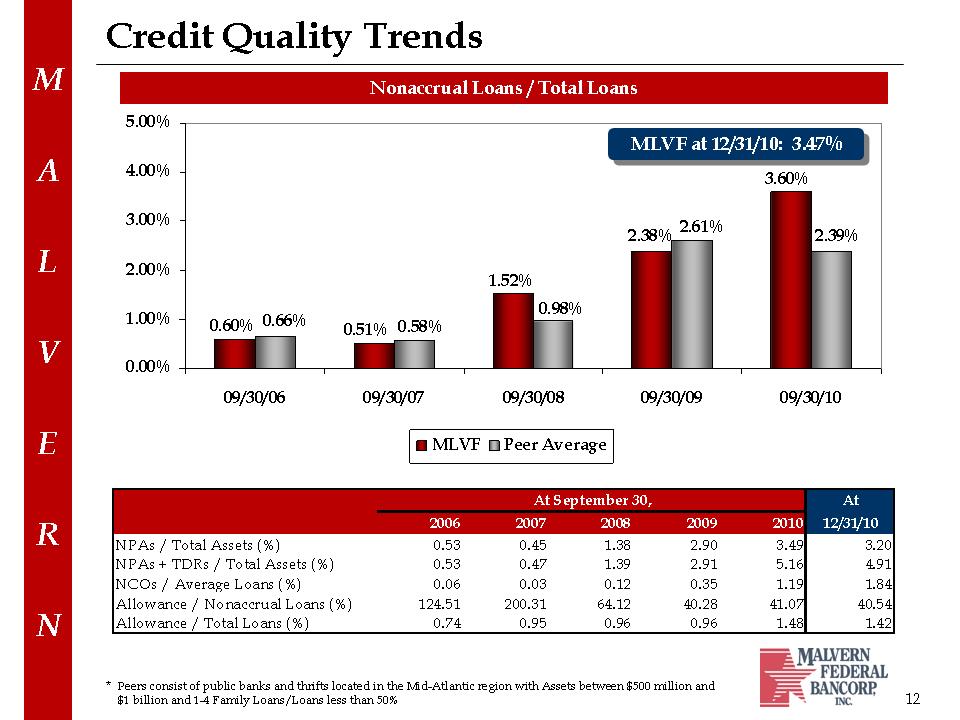
Credit Quality Trends
12
Nonaccrual Loans / Total Loans
* Peers consist of public banks and thrifts located in the Mid-Atlantic region with Assets between $500 million and
$1 billion and 1-4 Family Loans/Loans less than 50%
M
A
L
V
E
R
N
MMLLVVFFaatt1122//3311//1100:: 33.4.477%%
At
2006 2007 2008 2009 2010 12/31/10
NPAs / Total Assets (%) 0.53 0.45 1.38 2.90 3.49 3.20
NPAs + TDRs / Total Assets (%) 0.53 0.47 1.39 2.91 5.16 4.91
NCOs / Average Loans (%) 0.06 0.03 0.12 0.35 1.19 1.84
Allowance / Nonaccrual Loans (%) 124.51 200.31 64.12 40.28 41.07 40.54
Allowance / Total Loans (%) 0.74 0.95 0.96 0.96 1.48 1.42
At September 30,
|
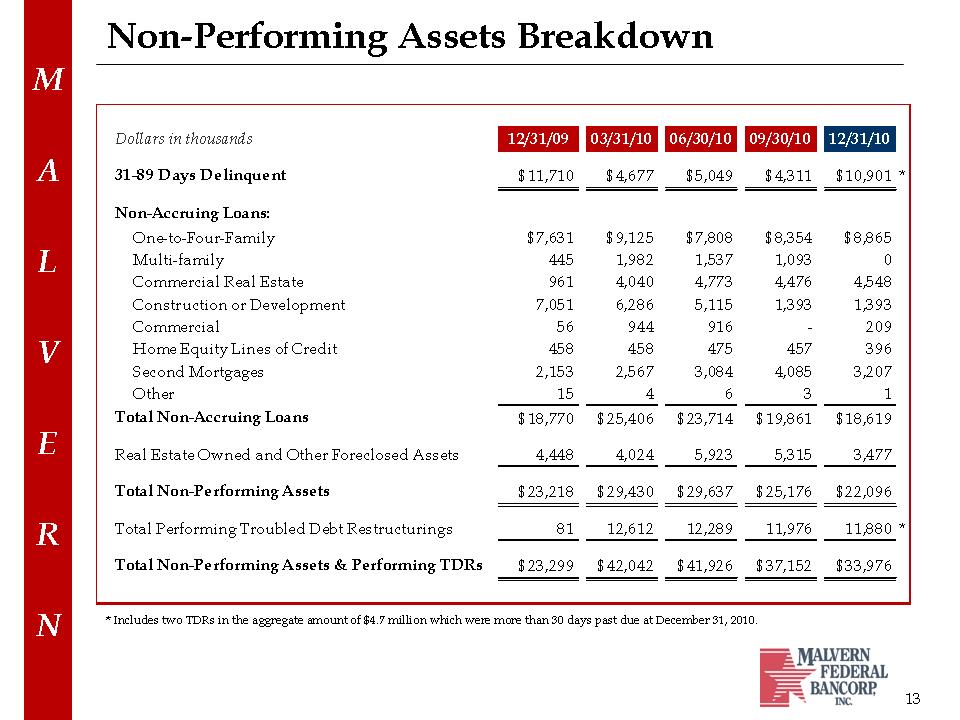 |
14
Non-Performing Assets Breakdown
13
M
A
L
V
E
R
N * Includes two TDRs in the aggregate amount of $4.7 million which were more than 30 days past due at December 31, 2010.
Dollars in thousands 12/31/09 03/31/10 06/30/10 09/30/10 12/31/10
31-89 Days Delinquent $11,710 $4,677 $5,049 $4,311 $10,901 *
Non-Accruing Loans:
One-to-Four-Family $7,631 $9,125 $7,808 $8,354 $8,865
Multi-family 445 1,982 1,537 1,093 0
Commercial Real Estate 961 4,040 4,773 4,476 4,548
Construction or Development 7,051 6,286 5,115 1,393 1,393
Commercial 56 944 916 - 209
Home Equity Lines of Credit 458 458 475 457 396
SecondMortgages 2,153 2,567 3,084 4,085 3,207
Other 15 4 6 3 1
TotalNon-Accruing Loans $18,770 $25,406 $23,714 $19,861 $18,619
Real Estate Owned and Other Foreclosed Assets 4,448 4,024 5,923 5,315 3,477
TotalNon-Performing Assets $23,218 $29,430 $29,637 $25,176 $22,096
Total Performing Troubled Debt Restructurings 81 12,612 12,289 11,976 11,880 *
TotalNon-Performing Assets & Performing TDRs $23,299 $42,042 $41,926 $37,152 $33,976
|
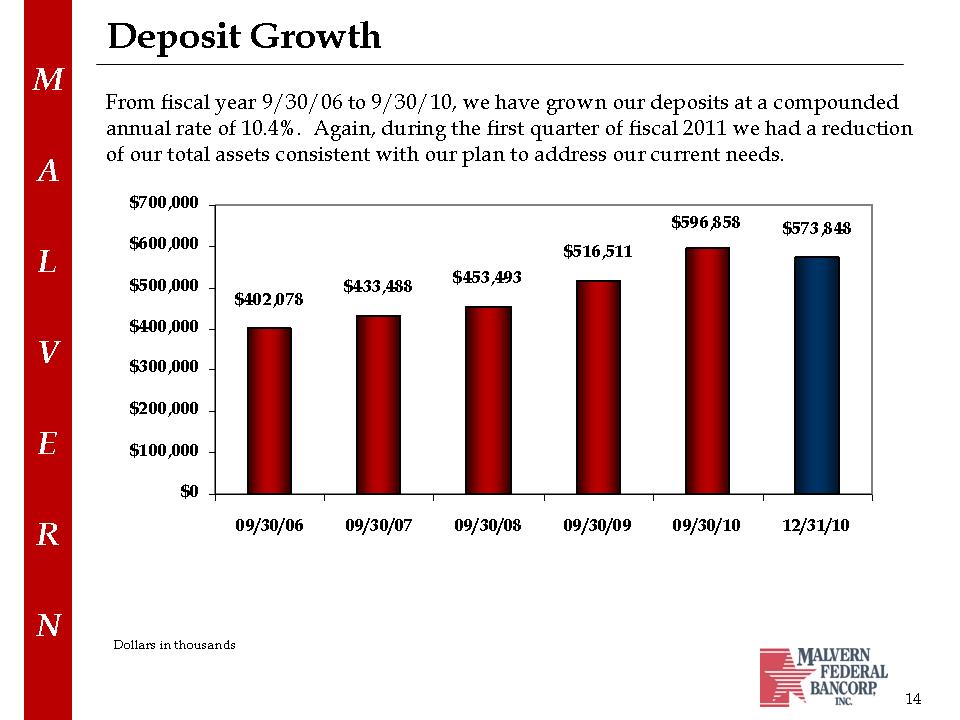 |
12
Deposit Growth
14
From fiscal year 9/30/06 to 9/30/10, we have grown our deposits at a compounded
annual rate of 10.4%. Again, during the first quarter of fiscal 2011 we had a reduction
of our total assets consistent with our plan to address our current needs.
M
A
L
V
E
R
N
$402,078 $433,488 $453,493
$516,511
$596,858 $573,848
$0
$100,000
$200,000
$300,000
$400,000
$500,000
$600,000
$700,000
09/30/06 09/30/07 09/30/08 09/30/09 09/30/10 12/31/10
Dollars in thousands
|
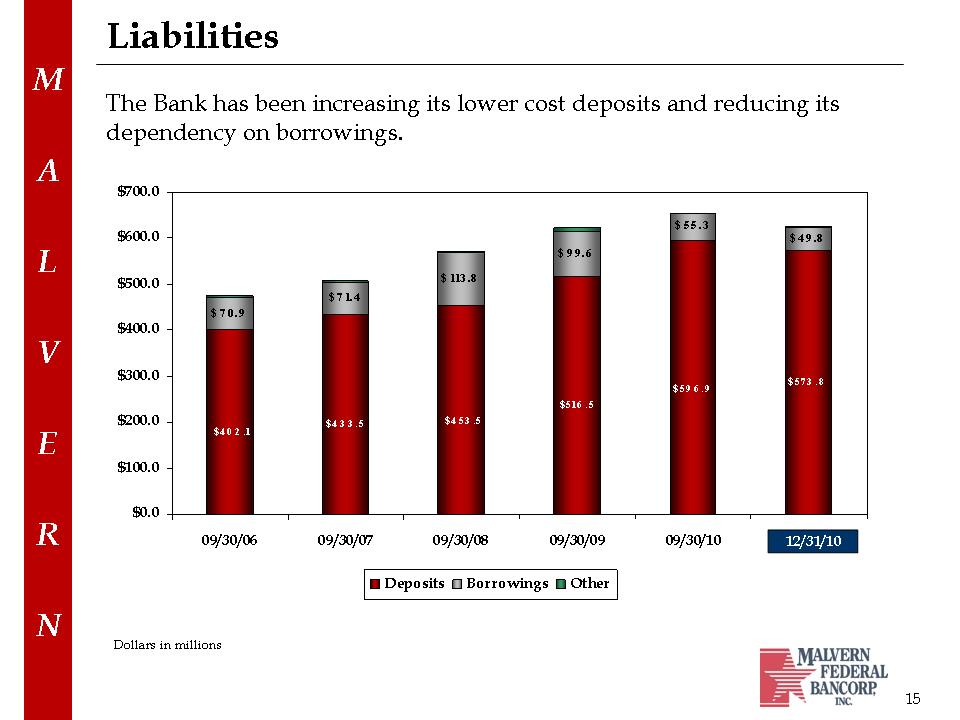 |
12
Liabilities
15
The Bank has been increasing its lower cost deposits and reducing its
dependency on borrowings.
M
A
L
V
E
R
N
$5 73 .8
$ 7 0 .9
$ 7 1.4
$ 113 .8
$ 9 9 .6
$ 5 5 .3
$ 4 9 .8
$ 4 0 2 . 1
$ 4 3 3 . 5 $ 4 5 3 . 5
$ 516 . 5
$ 59 6 . 9
$0.0
$100.0
$200.0
$300.0
$400.0
$500.0
$600.0
$700.0
09/30/06 09/30/07 09/30/08 09/30/09 09/30/10 12/31/10
Deposits Borrowings Other
12/31/10
Dollars in millions
|
 |
12
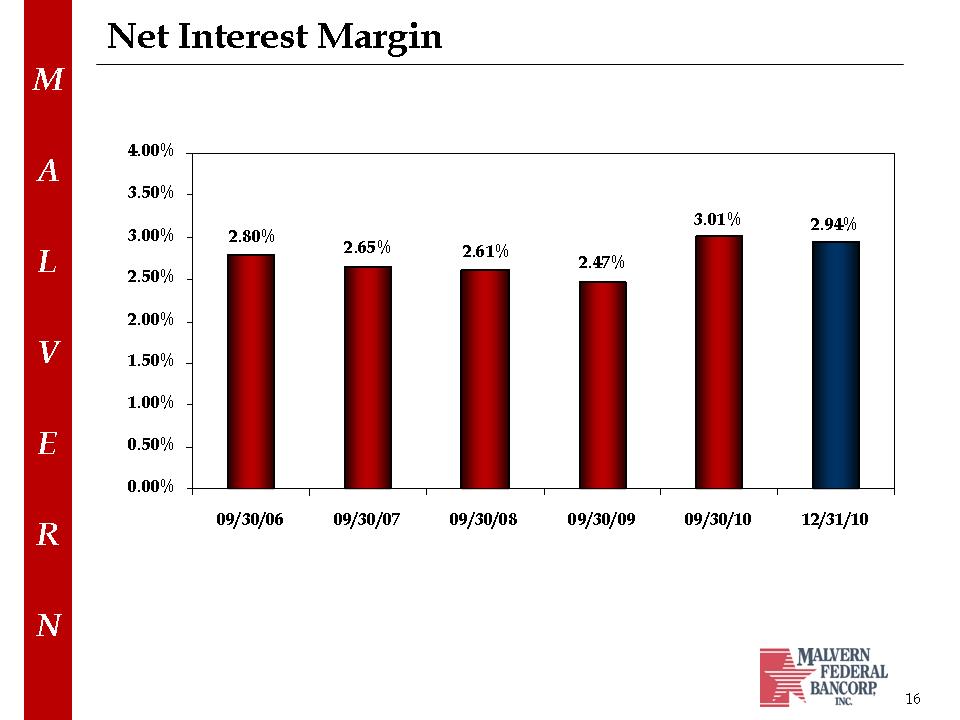
Net Interest Margin
16
M
A
L
V
E
R
N
3.01% 2.94%
2.80% 2.65% 2.61% 2.47%
0.00%
0.50%
1.00%
1.50%
2.00%
2.50%
3.00%
3.50%
4.00%
09/30/06 09/30/07 09/30/08 09/30/09 09/30/10 12/31/10
|
 |
15
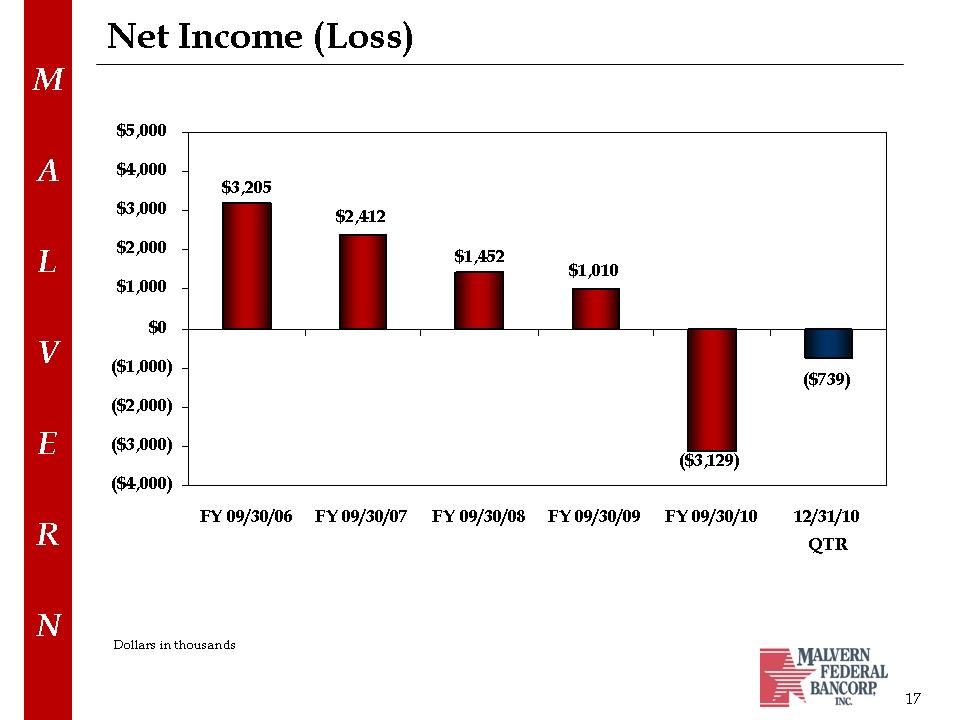
Net Income (Loss)
17
M
A
L
V
E
R
N
($739)
($3,129)
$1,010
$1,452
$2,412
$3,205
($4,000)
($3,000)
($2,000)
($1,000)
$0
$1,000
$2,000
$3,000
$4,000
$5,000
FY 09/30/06 FY 09/30/07 FY 09/30/08 FY 09/30/09 FY 09/30/10 12/31/10
QTR
Dollars in thousands
|
 |
15
Net Loss – Fiscal Year
18
. Factors contributing to the decrease in net income for fiscal year 2010:
. An increase in the provision for loan losses of $7.1 million as well as a $2.6
million increase in other expenses, which was partially offset by a $3.5
million increase in net interest income and a $2.1 million reduction in
income tax expense.
. An increase in other expenses primarily was the result of a $1.8 million
increase in other real estate owned expense and a $621,000 increase in
federal deposit insurance premium.
M
A
L
V
E
R
N
|
 |
15
Net Loss – First Quarter of 2011
19
. Factors contributing to the decrease in net income for the three months ended December 31, 2010 compared to
December 31, 2009:
. The Company’s interest and dividend income decreased by $974,000 in the three month period ended December 31, 2010 compared to the three month period ended December 31, 2009. Interest income earned decreased in the three months ended December 31, 2010 over the prior comparable period in fiscal 2010 due primarily to a decline in the average balance of loans and lower average yields on loans and investment securities in the fiscal 2011 quarter.
. The provision for loan losses was $1.9 million for the quarter ended December 31, 2010 compared to $945,000 for the quarter ended December 31, 2009. The $955,000 increase in our provision for loan losses for the quarter ended December 31, 2010 compared to the first quarter of fiscal 2010 was due to a deterioration of some collateral values during the quarter and charge-offs that occurred during the quarter as a result of such deterioration in collateral values, as well as our determination made during the quarter, based on a review of our loss experience and other factors with respect to the allowance for loan losses, to increase our coverage amounts for commercial real estate loans and consumer second mortgage loans.
. The Company's other, or non-interest, income decreased by $186,000 to $421,000 for the three months ended December 31, 2010 over the comparable prior year period. The decrease was due primarily to a $143,000 decrease in service charges and other fees and a $43,000 net loss on sale of REO.
. Other expense of the Company increased by $42,000 in the quarter ended December 31, 2010 over the comparable prior fiscal year period due primarily to a $269,000 increase in other real estate owned expense, a $144,000 increase in professional services and an $81,000 increase in miscellaneous other operating expenses. These increases were partially offset by a $255,000 decrease in federal deposit insurance premium, a $151,000 decrease in salaries and employee benefits and an $110,000 decrease in data processing expense. For the first quarter of fiscal 2011, the Company had an income tax benefit of $446,000 compared to an income tax benefit of $88,000 for the first quarter of fiscal 2010.
M
A
L
V
E
R
N
|
 |
Market Statistics
M
A
L
V
E
R
N
M
A
L
V
E
R
N
|
 |
23
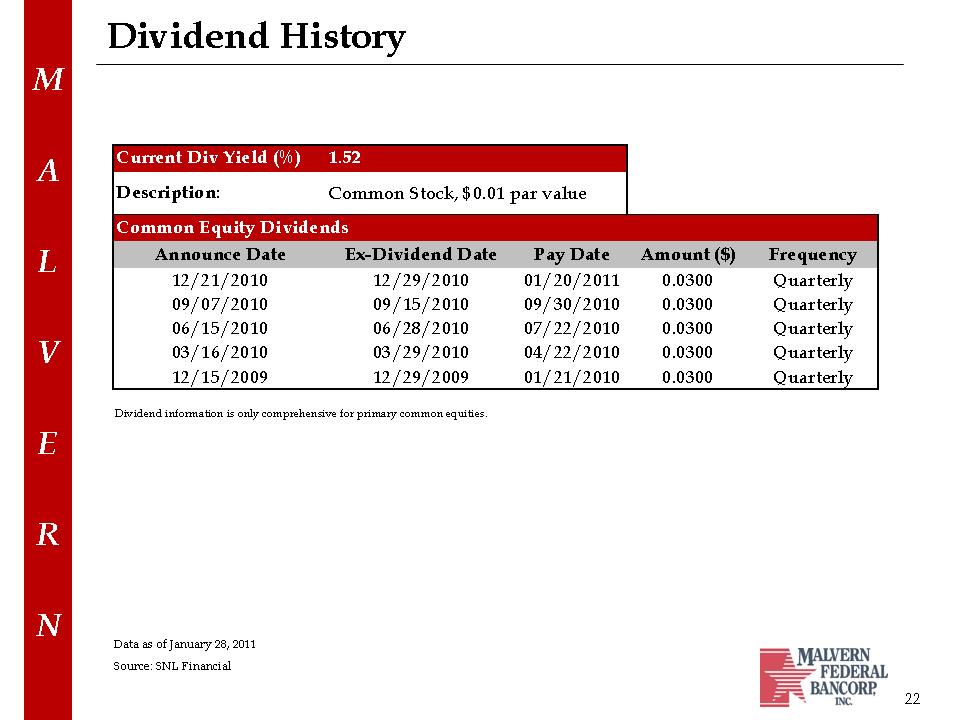
Dividend History
22
M
A
L
V
E
R
N Data as of January 28, 2011
Source: SNL Financial
Current Div Yield (%) 1.52
Description: Common Stock, $0.01 par value
Announce Date Ex-Dividend Date Pay Date Amount ($) Frequency
12/21/2010 12/29/2010 01/20/2011 0.0300 Quarterly
09/07/2010 09/15/2010 09/30/2010 0.0300 Quarterly
06/15/2010 06/28/2010 07/22/2010 0.0300 Quarterly
03/16/2010 03/29/2010 04/22/2010 0.0300 Quarterly
12/15/2009 12/29/2009 01/21/2010 0.0300 Quarterly
Dividend information is only comprehensive for primary common equities.
Common Equity Dividends
|
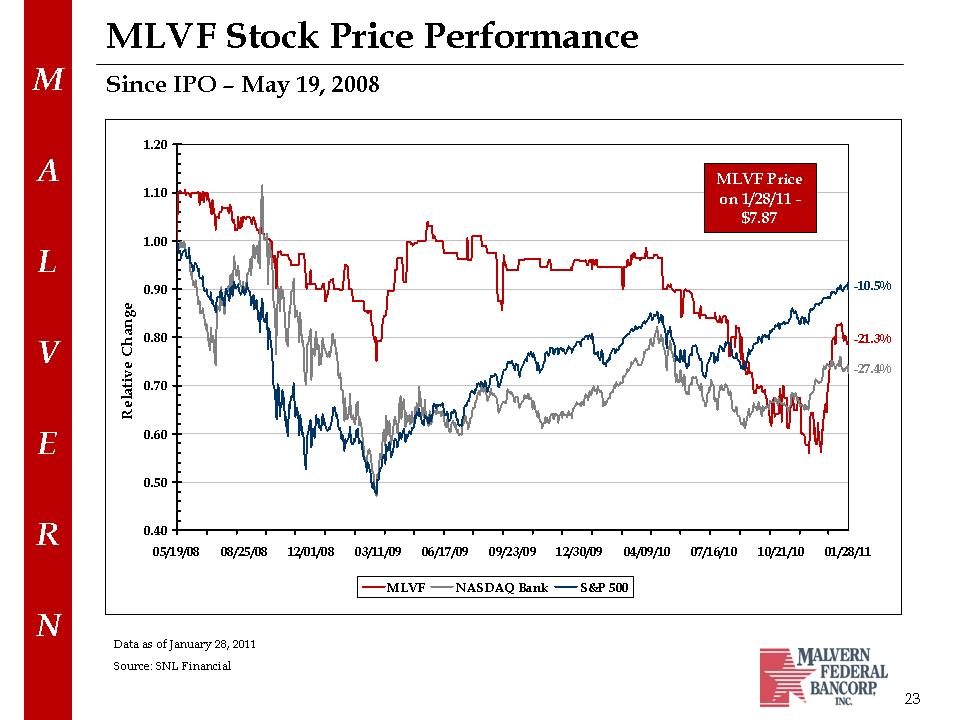 |
0.40
0.50
0.60
0.70
0.80
0.90
1.00
1.10
1.20
05/19/08 08/25/08 12/01/08 03/11/09 06/17/09 09/23/09 12/30/09 04/09/10 07/16/10 10/21/10 01/28/11
Relative Change MLVF NASDAQ Bank S&P 500
-27.4%
-21.3%
-10.5%
21
MLVF Stock Price Performance
23
Since IPO –May 19, 2008
MLVF Price
on 1/28/11 -
$7.87
Data as of January 28, 2011
Source: SNL Financial
M
A
L
V
E
R
N
|
 |
19
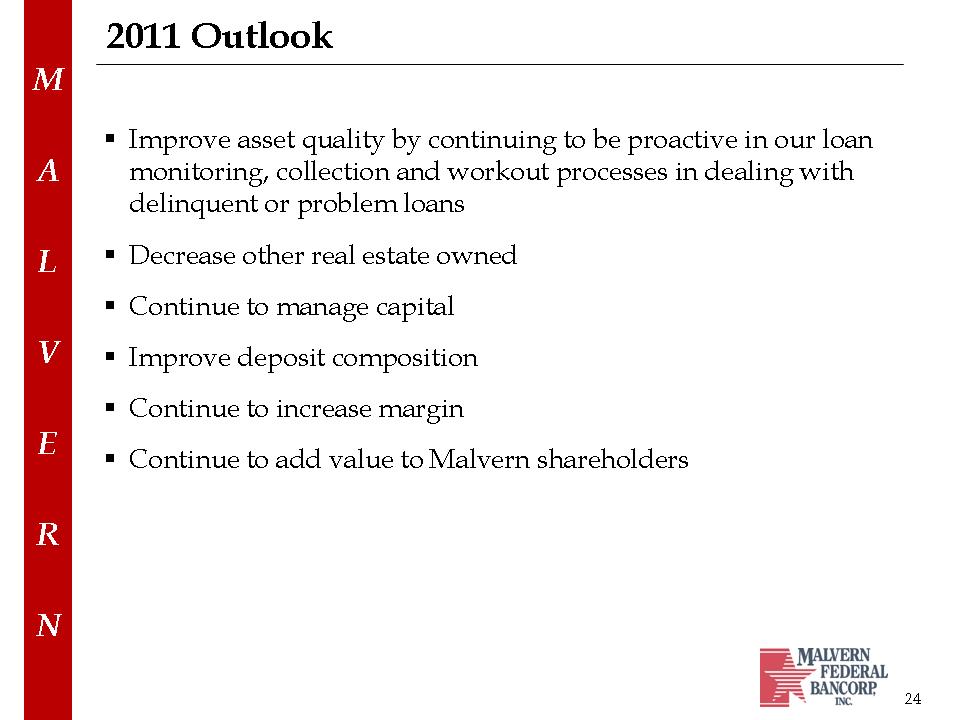
2011 Outlook
24
. Improve asset quality by continuing to be proactive in our loan
monitoring, collection and workout processes in dealing with
delinquent or problem loans
. Decrease other real estate owned
. Continue to manage capital
. Improve deposit composition
. Continue to increase margin
. Continue to add value to Malvern shareholders
M
A
L
V
E
R
N
|
 |
Questions?
M
A
L
V
E
R
N
M
A
L
V
E
R
N
|