Attached files
| file | filename |
|---|---|
| 8-K - FORM 8-K - JONES LANG LASALLE INC | d8k.htm |
| EX-99.1 - PRESS RELEASE - JONES LANG LASALLE INC | dex991.htm |
 Supplemental Information
Fourth Quarter
Earnings Call 2010
Exhibit 99.2 |
 Market & Financial Overview |
 3
Americas
EMEA
Asia Pacific
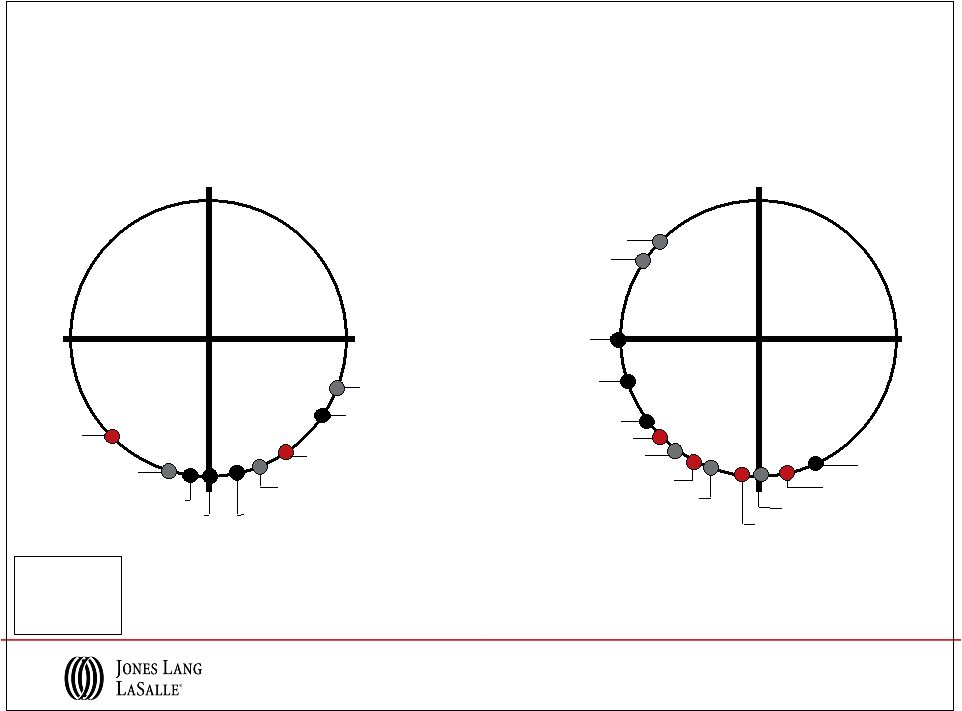
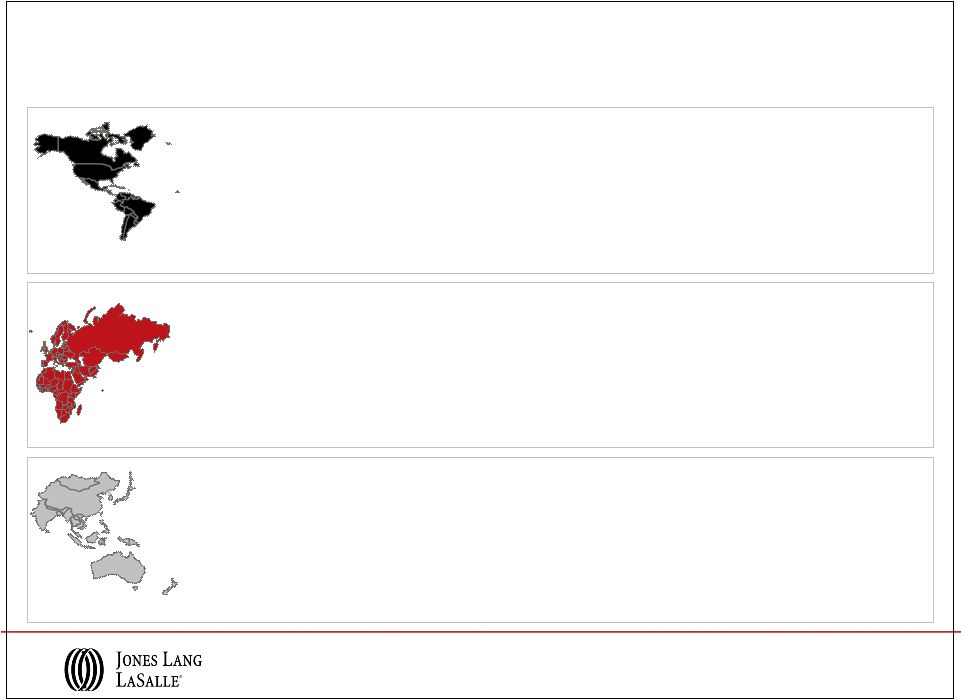
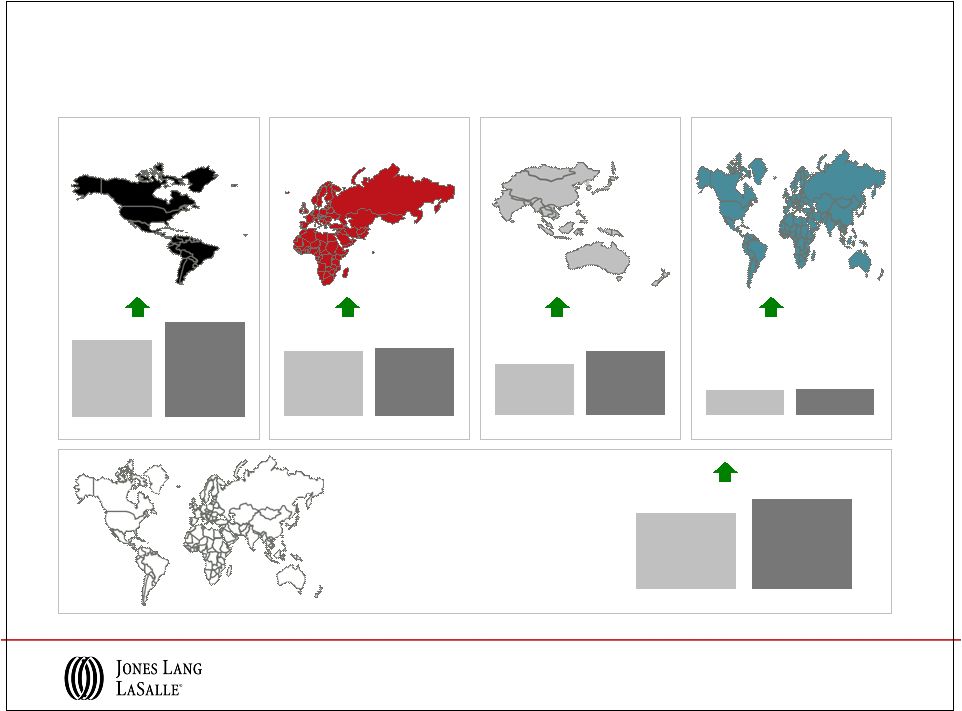
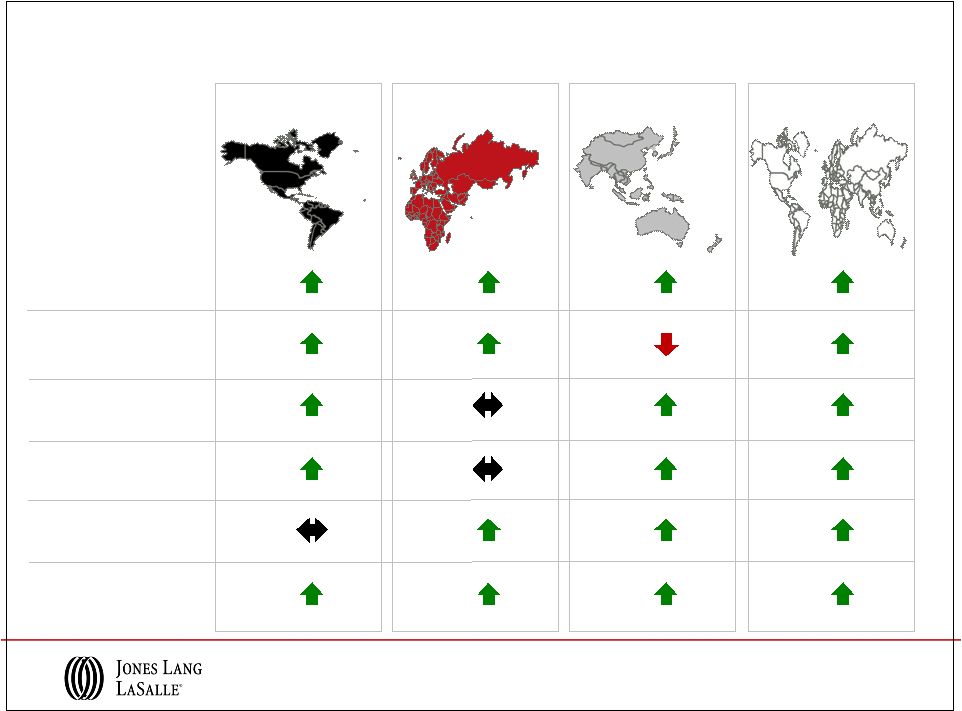
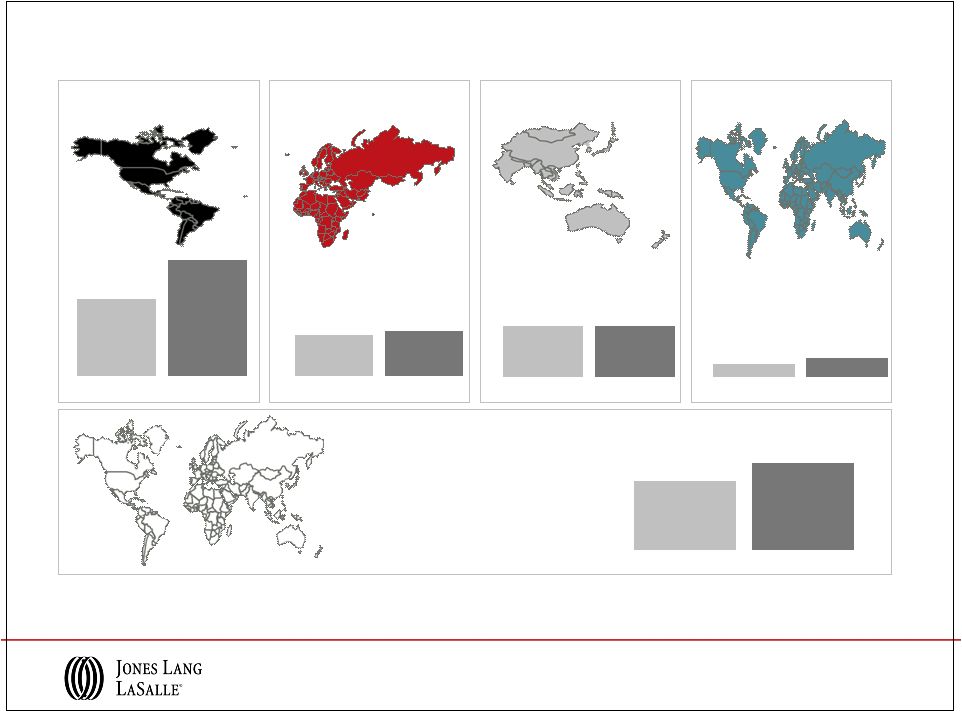
Capital Values
As of Q4 2010
The Jones Lang LaSalle Property Clocks
SM
Beijing, Hong Kong
Moscow
Capital Value
growth slowing
Capital Value
growth
accelerating
Capital Value
bottoming out
Capital Value
falling
New York,
Paris, San Francisco
Sao Paulo,
Seoul, Sydney
London
Shanghai
Detroit
Singapore
Brussels,
Chicago,
Milan
Mumbai, Tokyo
Amsterdam,
Toronto
Dallas
Q4 2009
Washington DC
Berlin, Stockholm
Capital Value
growth slowing
Capital Value
growth
accelerating
Capital Value
bottoming out
Capital Value
falling
Hong Kong,
London,
Sao Paulo
Washington DC
Shanghai
Dallas,
Mumbai, Seoul
Sydney, Tokyo
Singapore
Brussels
Moscow
Berlin, Paris, Stockholm
Amsterdam,
Milan
New York
San Francisco
Chicago, Toronto
Detroit
Beijing
Q4 2010 |
 4
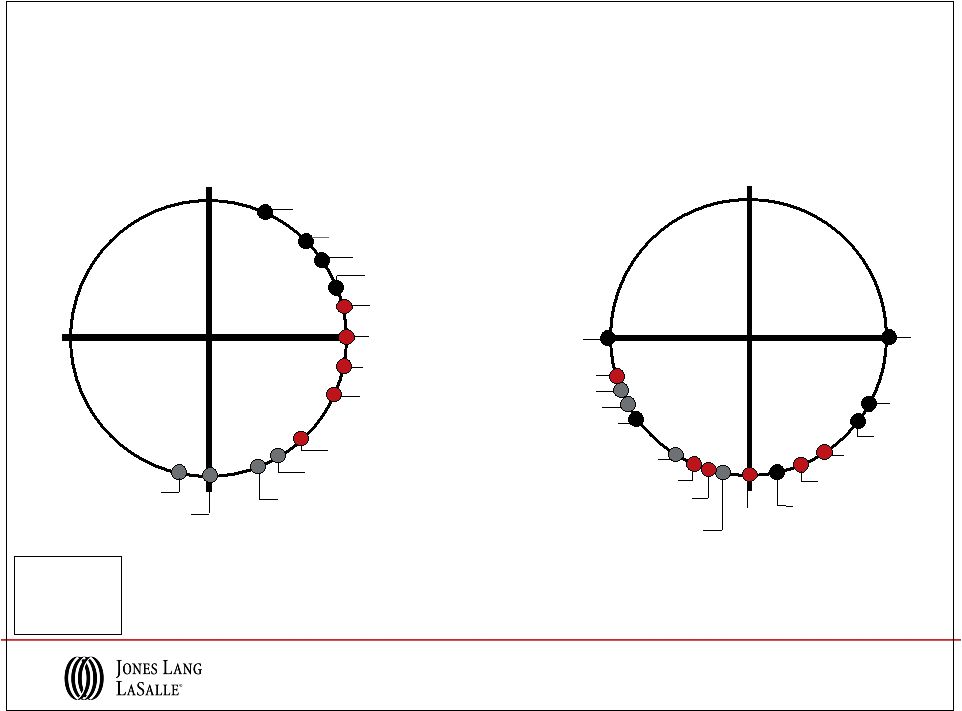
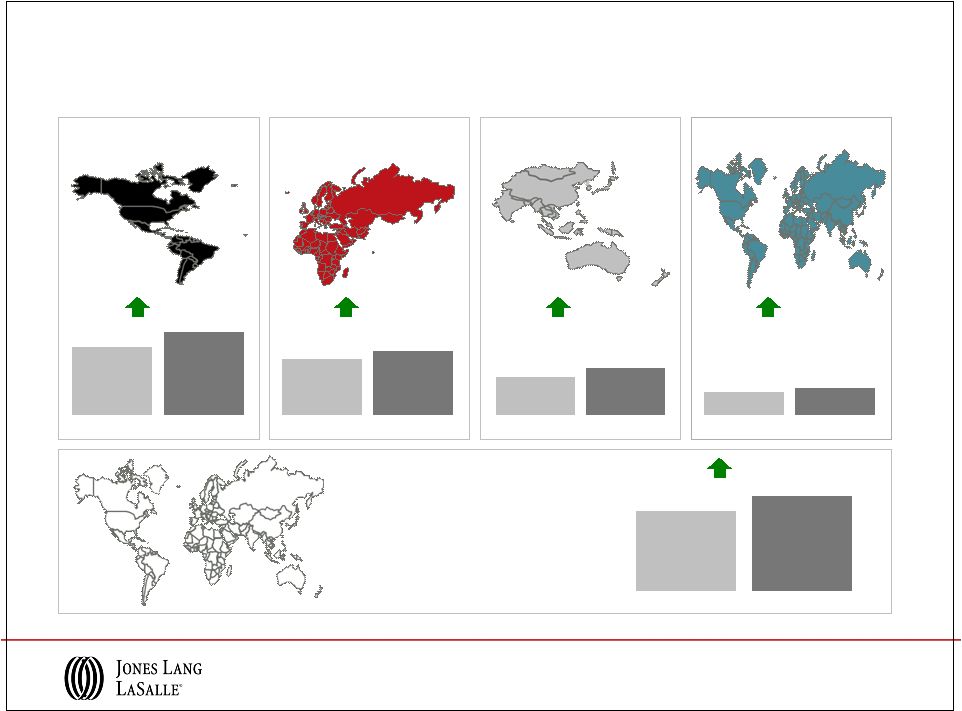
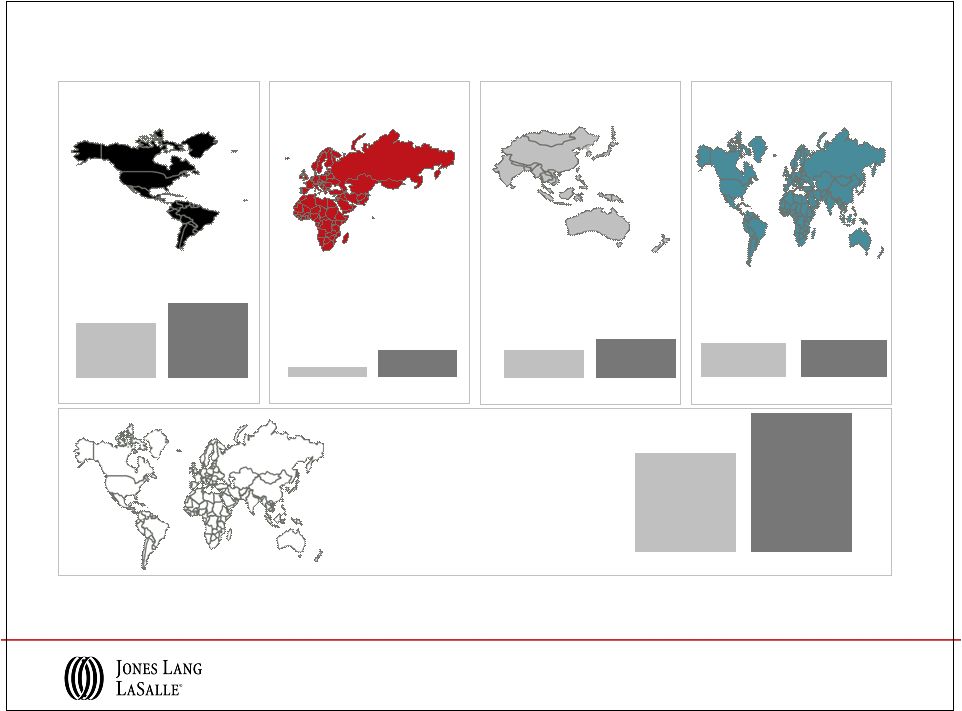
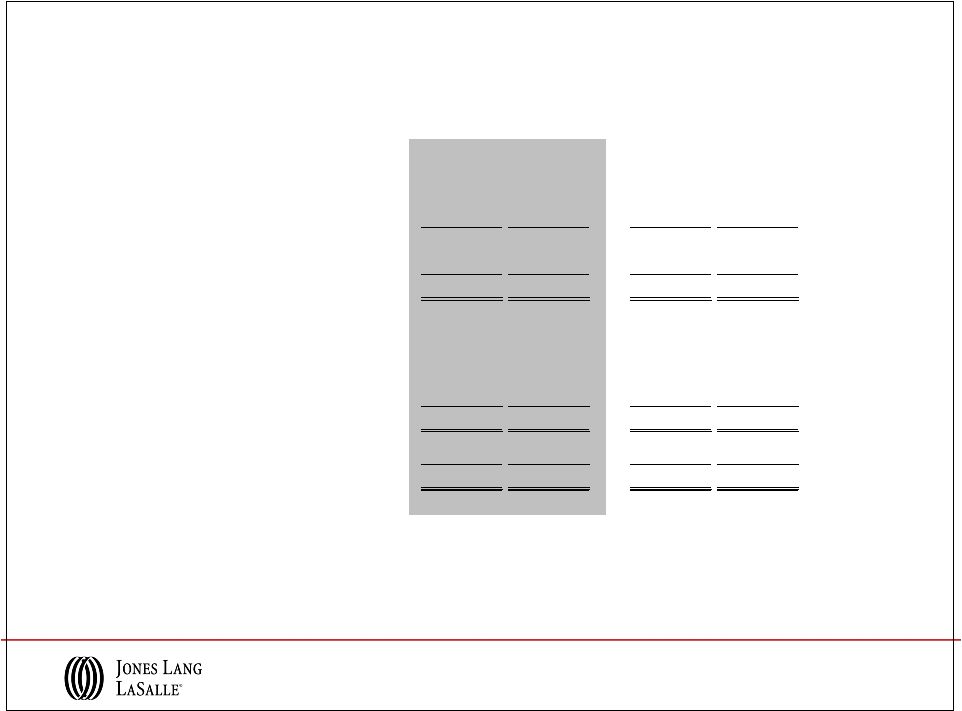
Leasing Market Fundamentals
Q4 2010
As of Q4 2010
The
Jones
Lang
LaSalle
Property
Clocks
SM
Shanghai
Rental Value
growth slowing
Rental Value
growth
accelerating
Rental Values
bottoming out
Rental Values
falling
Hong Kong, London,
Sao Paulo,
Sydney
Stockholm,
Singapore
Chicago
Mumbai
Amsterdam, Brussels,
Seoul
Toronto
Tokyo
Q4 2009
Dallas, Milan,
San Francisco
Beijing, Moscow
Berlin, Paris,
Washington DC
Detroit
New York
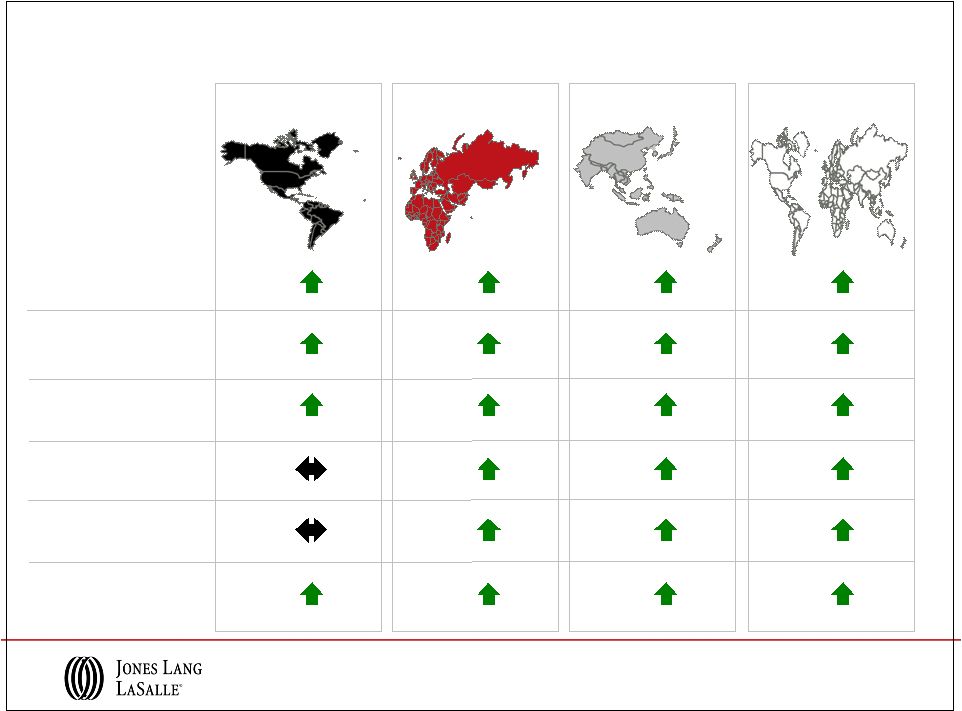
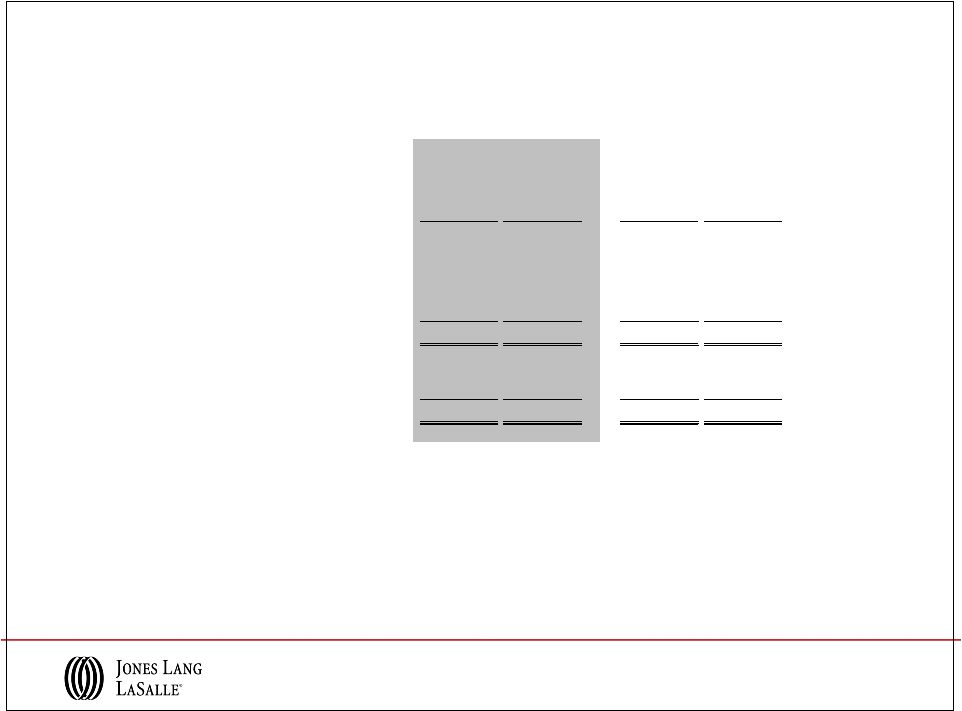
Americas
EMEA
Asia Pacific
Hong Kong
Rental Value
growth slowing
Rental Value
growth
accelerating
Rental Values
bottoming out
Rental Values
falling
Paris,
Tokyo
Shanghai, Sydney
Chicago,
Seoul
Amsterdam,
New York
Berlin,
Mumbai, San Francisco
London
Brussels
Toronto
Moscow, Stockholm
Detroit
Dallas
Sao Paulo
Beijing
Milan
Singapore,
Washington DC |
 2010 Accomplishments and Trends
Consolidated
5
–
Full-year revenue of more than $2.9 billion
–
Adjusted operating
income
margin
of
9.1%,
adjusted
EBITDA
margin
of
11.5%
–
Leasing revenue increased 28%
–
Strong Capital Markets & Hotels
revenue growth
–
2010 high-impact hires provide
momentum into 2011
–
Larger markets 9-12 months into
cyclical recovery
–
Improved productivity in
transactional businesses
–
Retail, Corporate Solutions,
Tetris provide improved revenue
opportunities
–
Both US and Regional multi-
national corporate wins
–
More than 50M sf
added to
Property Management annuity
base
–
Second-best capital raising
year in LaSalle history: $5B
–
Nearly $3.2B capital invested
–
Focused on performance
Americas
EMEA
Asia Pacific
LaSalle
Balance Sheet
–
$250M of net debt repayment in the year
–
Maintained the firm’s investment-grade ratings |
 Q4 Selected Business Wins and Expansions
6
–
AT&T Mobility –
2,300 sites
–
Beaumont Hospitals, Detroit –
8.5M sf
–
SAIC –
10M sf
–
353 N. Clark, Chicago –
$400M
–
300 S. Riverside, Chicago –
$120M
–
Navistar, Chicago –
$33M / 1.2M sf
–
The Northern Trust Company, Chicago –
207K sf
–
Healthfirst, New York –
172M sf
–
Interpublic Group –
3M sf
–
Vasakronen, Stockholm –
€483M
–
Norges, Regent Street, London –
£452M
–
Espace
Saint-Quentin, Paris –
€172M
–
Hotel de Crillon, Paris
–
Le Richmonde, Geneva –
$161M
–
The Shard, London –
595K sf
–
Soyak
Tower, Instanbul
–
538K sf
–
Publicis, Dusseldorf –
129K sf
–
Standard Chartered Bank –
16M sf
–
Alcatel Lucent –
6M sf
–
Colonial First State Property, Australia –
$229M
–
Procter & Gamble, Shanghai –
7.5M sf
–
Dusit
Thani
Phuket, Thailand –
$85M
–
Orchard Funds Management, Australia –
4.3M sf
–
Supertech
Emerald, India –
1M sf
–
Dow Chemical, Shanghai –
290K sf
Americas
EMEA
Asia Pacific |
 Financial Information |
 $643.7
$728.8
2009
2010
8
FY 2010 Revenue Performance
Note: Equity losses of $58.9M and $11.4M in 2009 and 2010, respectively, are included
in segment results, however, are excluded from Consolidated totals.
($ in millions; % change in local currency
)
Americas
EMEA
Asia Pacific
$1,031.6
$1,261.5
2009
2010
$538.9
$678.5
2009
2010
$245.4
$207.6
2009
2010
Consolidated
$2,480.7
$2,925.6
2009
2010
LIM
17%
17%
16%
17%
22% |
 Asia
Pacific 9
FY 2010 Real Estate Services Revenue
($ in millions; % change in local currency over FY 2009)
Americas
EMEA
Leasing
Capital Markets &
Hotels
Property & Facility
Management
Project &
Development Services
Advisory, Consulting
& Other
Total RES
Operating Revenue
$637.9
$84.1
$269.4
$158.9
$110.9
$1,261.2
28%
120%
19%
1%
1%
22%
$202.6
$141.2
$142.9
$115.0
$127.2
$728.9
22%
37%
8%
11%
7%
17%
$159.4
$80.4
$303.7
$63.5
$71.4
$678.4
34%
25%
6%
35%
11%
17%
$999.9
$305.7
$716.0
$337.4
$309.5
$2,668.5
27%
51%
11%
9%
5%
18%
Total RES
Revenue
Note: Segment and Consolidated Real Estate Services (“RES”) operating
revenue exclude Equity earnings (losses). |
 10
Q4 2010 Revenue Performance
Note: Equity losses of $2.6M and $0.4M in 2009 and 2010, respectively, are included in
segment results, however, are excluded from Consolidated totals.
Americas
EMEA
Asia Pacific
$344.7
$428.5
2009
2010
$225.9
$237.4
2009
2010
$178.3
$223.2
2009
2010
$66.8
$63.5
2009
2010
Consolidated
$815.1
$956.3
2009
2010
($ in millions; % change in local currency )
LIM
24%
11%
18%
4%
18% |
 Asia
Pacific 11
Q4 2010 Real Estate Services Revenue
Americas
EMEA
Leasing
Capital Markets &
Hotels
Property & Facility
Management
Project &
Development Services
Advisory, Consulting
& Other
Total RES
Operating Revenue
$228.3
$35.1
$86.1
$48.1
$30.9
$428.5
30%
156%
8%
11%
2%
24%
$69.3
$52.0
$40.7
$32.2
$43.2
$237.4
4%
41%
3%
0%
13%
10%
$62.4
$28.5
$89.4
$18.8
$24.0
$223.1
36%
7%
13%
41%
20%
18%
$360.0
$115.6
$216.2
$99.1
$98.1
$889.0
25%
50%
7%
11%
18%
Total RES
Revenue
7%
($ in millions; % change in local currency over Q4 2009)
Note: Segment and Consolidated Real Estate Services (“RES”) operating
revenue exclude Equity earnings (losses). |
 •
$5
billion
of
net
new
capital
raised,
2
best
year
in
LaSalle
history
•
More than $3 billion invested worldwide in 2010
•
Healthy margins generated from Advisory Fees
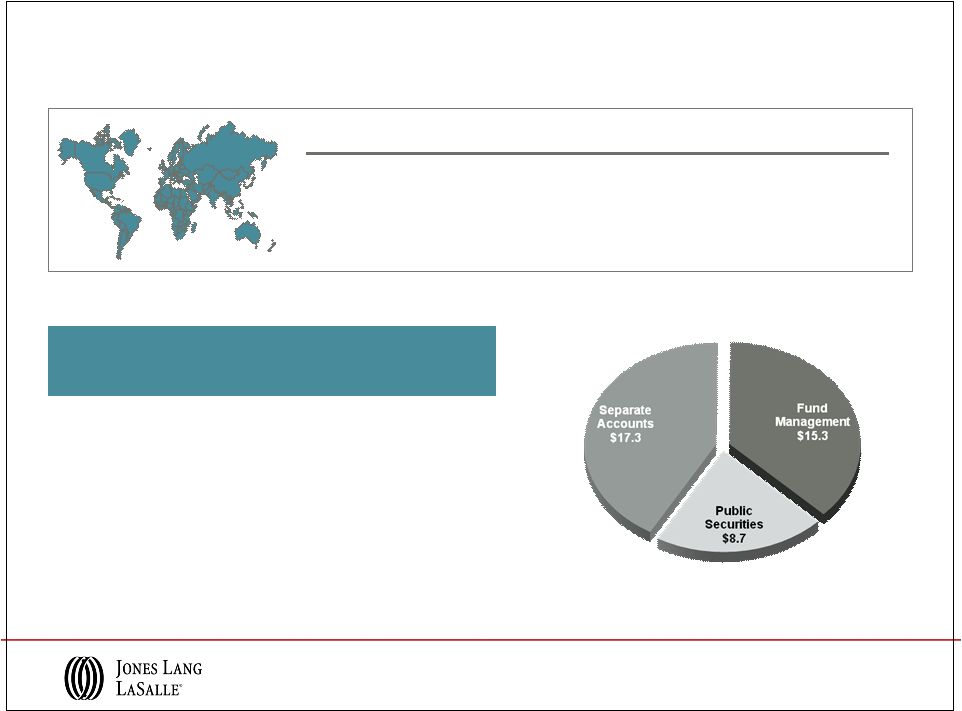
A premier global investment manager
LaSalle Investment Management
2010 Highlights
Product
Assets Under
Management
($ in billions)
Average
Performance
Private Equity
U.K.
$11.3
Above benchmark
Continental Europe
$4.2
Return: +1x equity
North America
$9.8
Above benchmark
Asia Pacific
$7.3
Return: +1x equity
Public Securities
$8.7
Above benchmark
Total Q4 2010 AUM
$41.3 B
AUM by Fund type
Note: AUM data reported on a one-quarter lag
($ in billions)
12
nd |
 Solid Cash Flows and Balance Sheet Position
•
Strong cash from earnings growth
•
Net debt repayment of $250 million
•
Paid first deferred Staubach obligation
of $76 million
(2)
•
Renewed and extended credit facility
-
Capacity increased to $1.1 billion,
previously $840 million
-
Maturity extended to September 2015
•
Investment grade ratings affirmed:
Standard & Poor’s:
BBB-
(Outlook: Stable)
Moody’s Investor Services:
Baa2
(Outlook: Stable)
Cash Flows
FY 2010
FY 2009
Cash from Earnings
$316
$244
Working Capital
68
7
Cash from Operations
$384
$251
Primary Uses
Capital Expenses
(1)
(48)
(44)
Acquisitions & Deferred Payment Obligations
(130)
(27)
Co-Investment
(19)
(39)
Dividends
(9)
(8)
Net Cash Outflows
($206)
($118)
Net Share Activity & Other Financing
(23)
201
Net Bank Debt (Borrowings) / Repayments
$155
$334
Balance Sheet
FY 2010
FY 2009
Cash
$252
$69
Short Term Borrowings
28
23
Credit Facility
198
175
Net Bank Debt
($26)
$129
Deferred Business Obligations
299
394
Total Net Debt
$273
$523
($ in millions)
(1)
YTD
Capital
Expenditures
for
2010
and
2009
net
of
tenant
improvement
allowances
received
were
$46
million
and
$36
million,
respectively
(2)
$78
million
due
less
$2
million
deferred
in
accordance
with
the
merger
agreement
2010 Highlights
13 |
 Appendix |
 15
FY 2010 Adjusted EBITDA
*
Performance
Americas
EMEA
Asia Pacific
$133.8
$183.9
2009
2010
$14.1
$38.3
2009
2010
$44.3
$62.4
2009
2010
$53.0
$47.4
2009
2010
Consolidated
$238.6
$336.7
2009
2010
($ in millions)
LIM
* Refer to slide 18 for Reconciliation of GAAP Net Income (Loss) to EBITDA and adjusted
EBITDA for the twelve months ended December 31, 2010, and 2009, for details relative to
these adjusted EBITDA calculations. Segment adjusted EBITDA is calculated
by adding the segment’s Depreciation and amortization and non-cash co-investment charges to its
reported Operating income (loss), which excludes Restructuring charges.
Consolidated adjusted EBITDA is the sum of the adjusted EBITDA of the four segments less net income
attributable to non-controlling interests and dividends on unvested common stock. |
 16
Q4 2010 Adjusted EBITDA
*
Performance
Americas
EMEA
Asia Pacific
LIM
$52.2
$78.7
2009
2010
$23.5
$25.6
2009
2010
$28.9
$28.7
2009
2010
$7.9
$10.4
2009
2010
Consolidated
$112.1
$143.1
2009
2010
($ in millions)
* Refer to slide 18 for Reconciliation of GAAP Net Income (Loss) to EBITDA and adjusted
EBITDA for the three months ended December 31, 2010, and 2009, for details relative to
these adjusted EBITDA calculations. Segment adjusted EBITDA is calculated
by adding the segment’s Depreciation and amortization and non-cash co-investment charges to its
reported Operating income (loss), which excludes Restructuring charges.
Consolidated adjusted EBITDA is the sum of the adjusted EBITDA of the four segments less net income
attributable to non-controlling interests and dividends on unvested common stock. |
 17
($ in millions)
Reconciliation of GAAP Net Income (Loss) to
Adjusted Net Income
Note: Basic shares outstanding are used in the calculation of GAAP EPS for the twelve
months ending December 31, 2009, as the use of dilutive shares outstanding would
cause that EPS calculation to be anti-dilutive. 2010
2009
2010
2009
GAAP net income (loss)
84.4
$
52.0
$
153.5
$
(4.1)
$
Shares (in 000's)
44,235
43,671
44,084
38,543
GAAP earnings (loss) per share
1.91
$
1.19
$
3.48
$
(0.11)
$
GAAP net income (loss)
84.4
$
52.0
$
153.5
$
(4.1)
$
Restructuring, net of tax
0.7
8.1
4.9
35.6
Non-cash co-investment charges, net of tax
0.7
2.8
7.9
38.5
Adjusted net income
85.8
$
62.9
$
166.3
$
70.0
$
Shares (in 000's)
44,235
43,671
44,084
40,106
Adjusted earnings per share
1.94
$
1.44
$
3.77
$
1.75
$
Three Months Ended
December 31,
Twelve Months Ended
December 31, |
 18
($ in millions)
Reconciliation of GAAP Net Income (Loss) to
EBITDA and Adjusted EBITDA
2010
2009
2010
2009
Net income (loss)
84.4
$
52.0
$
153.5
$
(4.1)
$
Interest expense, net of interest income
10.1
11.5
45.8
55.0
Provision (benefit) for income taxes
28.2
15.5
49.0
5.7
Depreciation and amortization
18.6
18.7
71.6
83.3
EBITDA
141.3
$
97.7
$
319.9
$
139.9
$
Non-cash co-investment charges
0.9
3.6
10.4
51.3
Restructuring
0.9
10.8
6.4
47.4
Adjusted EBITDA
143.1
$
112.1
$
336.7
$
238.6
$
Three Months Ended
December 31,
December 31,
Twelve Months Ended |