Attached files
| file | filename |
|---|---|
| 8-K - GREEN BANKSHARES, INC. 8-K - GREEN BANKSHARES, INC. | a6594195.htm |
|
CONTACT:
|
James E. Adams
|
|
Executive Vice President and Chief Financial Officer
|
|
|
423-278-3050
|
GREEN BANKSHARES REPORTS RESULTS FOR
FOURTH QUARTER AND FULL YEAR 2010
GREENEVILLE, Tenn. (February 1, 2011) – Green Bankshares, Inc. (NASDAQ:GRNB), the holding company for GreenBank, today reported results for the fourth quarter and year ended December 31, 2010. These results included a net loss available to common shareholders of $52.8 million or $4.03 per diluted share for the quarter ended December 31, 2010, compared with a net loss available to common shareholders of $76,000 or $0.01 per diluted share for the same quarter a year ago. The Company also reported a net loss available to common shareholders of $85.7 million or $6.54 per diluted share for the full year 2010 compared with a net loss available to common shareholders of $155.7 million or $11.91 per diluted share for the full year 2009.
The fourth quarter and full year results for 2010 reflected tax expense of $10.7 million or $0.82 per diluted share and $14.9 million or $1.14 per diluted share, respectively, despite the pre-tax loss before income taxes. These income tax provisions primarily reflected non-cash charges to record a valuation allowance for deferred tax assets under accounting rules. The year ended December 31, 2009, included a non-recurring, non-cash goodwill impairment charge of $143.4 million recorded in the second quarter of 2009. In light of these charges, the Company believes that the most meaningful year-to-year performance comparison can be made on the basis of pre-tax income excluding the goodwill impairment charge. On this basis, the Company's adjusted pre-tax loss for 2010 was $65.8 million versus a pre-tax loss of $24.3 million for 2009 (please refer to the non-GAAP financial measures reconciliation on page 6).
Stephen M. Rownd, Chairman and Chief Executive Officer, commented, "Our fourth quarter and the full year results for 2010 reflected a continuation of elevated credit costs incurred by virtue of higher loan loss provisions, as well as increased expenses associated with the revaluation and disposition of foreclosed properties. We continue to deal aggressively with asset quality issues in this difficult economic environment. Although we have devoted significant attention to our asset quality issues, including having segregated these assets in our Special Assets Group so that we may diligently work through the resolution of each on an asset-by-asset basis, we are also seeking to improve the core earnings of the Company.
"Although the economic recovery in most of our markets remains uneven and more sluggish than anticipated, we remain committed to returning the Company to profitability as quickly and prudently as possible," Rownd continued. "We believe our continued actions to segregate and dispose of problem assets will help us achieve that goal. In our view, core fundamentals of the Company are strong; however, we remain cautious at this time due to the instability of and downward pressure on real estate values in our markets, and we realize that the elevated levels of non-performing assets will affect our ability to experience the full effects of any economic recovery immediately."
-MORE-
Green Bankshares, Inc. ▪ 100 North Main Street ▪ Greeneville, TN 37743 ▪ (423) 639-5111
GRNB Reports Fourth Quarter Results
Page 2
February 1, 2011
As a result of the fourth quarter loss for 2010, the Bank's capital ratios declined as noted below, remaining above the statutory minimums necessary to be deemed a well-capitalized financial institution, but dropping below the Tier 1 leverage ratio of 10.0% and the Total Risk-based Capital Ratio of 14.0% that the Bank had informally committed to its regulators that it would maintain as discussed further in the Company's Form 10-Q for the third quarter of 2010.
Estimated capital levels: (see the non-GAAP measurement reconciliation on page 6 regarding tangible equity and book value per share)
|
Consolidated:
|
4Q10 | 3Q10 | 2Q10 | 1Q10 | 4Q09 | |||||||||||||||
|
Tangible common book value per share
|
$ | 5.23 | $ | 9.30 | $ | 11.95 | $ | 11.71 | $ | 11.44 | ||||||||||
|
Tangible common equity to assets ratio
|
2.88 | % | 5.09 | % | 6.25 | % | 6.03 | % | 5.77 | % | ||||||||||
|
Bank Regulatory Ratios:
|
||||||||||||||||||||
|
Tier 1 leverage ratio
|
8.88 | % | 10.78 | % | 11.86 | % | 11.55 | % | 10.70 | % | ||||||||||
|
Tier 1 risk-based capital ratio
|
11.94 | % | 13.53 | % | 14.73 | % | 14.06 | % | 13.61 | % | ||||||||||
|
Total risk-based capital ratio
|
13.22 | % | 14.80 | % | 15.99 | % | 15.33 | % | 14.87 | % |
Net interest income:
|
(dollars in thousands)
|
4Q10 | 3Q10 | 2Q10 | 1Q10 | 4Q09 | |||||||||||||||
|
Net interest income
|
$ | 19,714 | $ | 20,747 | $ | 21,473 | $ | 21,659 | $ | 20,578 | ||||||||||
|
Net interest margin
|
3.77 | % | 3.90 | % | 3.86 | % | 3.90 | % | 3.37 | % | ||||||||||
|
Average earning assets
|
$ | 2,094,399 | $ | 2,130,339 | $ | 2,248,240 | $ | 2,271,550 | $ | 2,445,872 |
|
·
|
Both net interest income and the net interest margin for the fourth quarter of 2010 were adversely affected by loan interest reversals totaling approximately $734 as $61,867 of loans were moved to non-accrual status. Excluding interest reversals, net interest margin would have been 3.91% for the fourth quarter of 2010.
|
Credit quality:
Summary:
|
(dollars in thousands)
|
4Q10 | 3Q10 | 2Q10 | 1Q10 | 4Q09 | |||||||||||||||
|
Net loan charge-offs
|
$ | 9,139 | $ | 36,549 | $ | 4,868 | $ | 3,882 | $ | 6,437 | ||||||||||
|
New non-accrual loans added
|
$ | 61,867 | $ | 111,868 | $ | 22,415 | $ | 14,442 | $ | 31,111 | ||||||||||
|
Reserves to total loans
|
3.83 | % | 2.74 | % | 2.60 | % | 2.52 | % | 2.45 | % | ||||||||||
|
Non-performing assets
|
$ | 205,914 | $ | 197,159 | $ | 141,915 | $ | 135,366 | $ | 132,726 |
-MORE-
GRNB Reports Fourth Quarter Results
Page 3
February 1, 2011
Changes in non-performing assets:
|
(dollars in thousands)
|
Non-accrual
Loans
|
OREO
|
Past Due >
90 days
|
Total (1)
|
||||||||||||
|
September 30, 2010
|
$ | 122,490 | $ | 73,699 | $ | 970 | $ | 197,159 | ||||||||
|
Loan foreclosures
|
(15,418 | ) | 15,418 | n/a | n/a | |||||||||||
|
Gross loan charge-offs
|
(10,570 | ) | n/a | n/a | (10,570 | ) | ||||||||||
|
New non-accrual loans
|
61,867 | n/a | n/a | 61,867 | ||||||||||||
|
Reduction of non-accrual loans
|
(14,662 | ) | n/a | n/a | (14,662 | ) | ||||||||||
|
Other real estate owned (OREO) sales proceeds
|
n/a | (7,100 | ) | n/a | (7,100 | ) | ||||||||||
|
OREO write-downs, net
|
n/a | (21,922 | ) | n/a | (21,922 | ) | ||||||||||
|
Change in past due > 90 days
|
n/a | n/a | 1,142 | 1,142 | ||||||||||||
|
December 31, 2010
|
$ | 143,707 | $ | 60,095 | $ | 2,112 | $ | 205,914 | ||||||||
(1) On average, all non-performing assets have been written down almost 34%.
Loan portfolio migration:
|
Dec. 31, 2010 from
Dec. 31, 2009
|
||||||||||||||||||||
|
(Dollars in thousands)
|
Dec. 31,
2010
|
Sept. 30,
2010
|
Dec. 31,
2009
|
Change
|
% Change
|
|||||||||||||||
|
Commercial real estate portfolio:
|
||||||||||||||||||||
|
Acquisition & development
|
$ | 133,947 | $ | 145,500 | $ | 185,087 | $ | (51,140 | ) | (27.6 | )% | |||||||||
|
Lot warehouse
|
42,796 | 46,306 | 66,104 | (23,308 | ) | (35.3 | )% | |||||||||||||
|
Commercial 1-4 family construction
|
31,511 | 41,847 | 70,434 | (38,923 | ) | (55.3 | )% | |||||||||||||
|
Total speculative 1-4 family
|
208,254 | 233,653 | 321,625 | (113,371 | ) | (35.3 | )% | |||||||||||||
|
Commercial vacant land
|
77,081 | 84,321 | 101,679 | (24,598 | ) | (24.2 | )% | |||||||||||||
|
Commercial construction non-owner occupied
|
76,568 | 100,364 | 164,887 | (88,319 | ) | (53.6 | )% | |||||||||||||
|
Commercial construction owner occupied
|
5,407 | 5,454 | 28,213 | (22,806 | ) | (80.8 | )% | |||||||||||||
|
Consumer residential construction
|
14,161 | 13,801 | 19,073 | (4,912 | ) | (25.6 | )% | |||||||||||||
|
Total construction and development
|
173,217 | 203,940 | 313,852 | (140,635 | ) | (44.8 | )% | |||||||||||||
|
Non-owner occupied commercial real estate
|
427,291 | 439,519 | 397,028 | 30,263 | 7.6 | % | ||||||||||||||
|
Total commercial real estate
|
$ | 808,762 | $ | 877,112 | $ | 1,032,505 | $ | (223,743 | ) | (21.7 | )% | |||||||||
-MORE-
GRNB Reports Fourth Quarter Results
Page 4
February 1, 2011
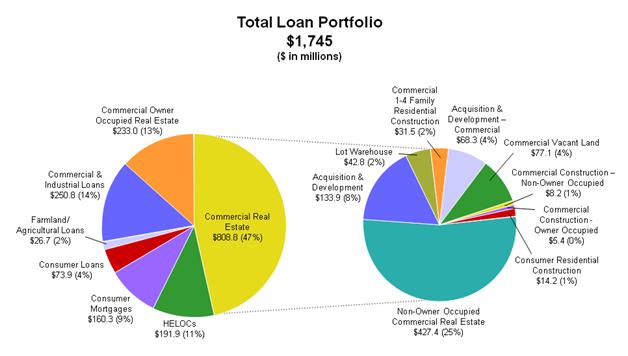
The following information graphically displays the consolidated loan portfolio by purpose code as of December 31, 2010:
Non-interest income totaled approximately $7.1 million for the fourth quarter of 2010, down from $8.1 million from the fourth quarter of 2009. This 13% decline primarily reflected a reduced level of service charges on deposit accounts. During the fourth quarter, the Company refunded approximately $1.4 million of overdraft charges, related to point of sale debit card transactions and ATM transactions, assessed on specific accounts where customers had verbally agreed to "opt-in" to the overdraft protection program, but had not yet signed an "opt-in" agreement. For the year, non-interest income totaled $32.5 million compared with $31.6 million for the same period last year, representing an increase of 3% due to higher service charges, trust and investment services income, and lower other-than-temporary impairment charges on investments. The increased level of service charges for 2010 reflected the ongoing success of GreenBank's High Performance Checking product, which added 14,269 net new checking account customers during 2010, for a new account opening ratio of 2.05 new accounts for each account closed.
Non-interest expense totaled approximately $42.0 million for the fourth quarter of 2010, compared with $20.5 million for the fourth quarter ended December 31, 2009. Non-interest expense for 2010 totaled $110.8 million compared with $86.2 million for 2009, excluding a one-time, non-cash goodwill impairment charge of $143.4 million (please refer to the non-GAAP measures reconciliation on page 6). The principal contributor to both quarterly and yearly non-interest expenses were increased losses incurred on the sale or revaluation of OREO and repossessed assets as the Company remained active in the disposal of these assets.
-MORE-
GRNB Reports Fourth Quarter Results
Page 5
February 1, 2011
Greeneville, Tennessee-based Green Bankshares, Inc., with total assets of approximately $2.4 billion, is the holding company for GreenBank. GreenBank, which traces its origin to 1890, has 63 branches across East and Middle Tennessee, and one branch each in Bristol, Virginia, and Hot Springs, North Carolina. It also provides wealth management services through its GreenWealth Division and residential mortgage lending through its Mortgage Division. In addition, GreenBank conducts separate businesses through three wholly owned subsidiaries: Superior Financial Services, Inc., a consumer finance company; GCB Acceptance Corporation, a consumer finance company specializing in automobile lending and Fairway Title Co., a title insurance company.
Certain matters discussed in this news release are not historical facts but are "forward-looking statements" within the meaning of and are furnished pursuant to the Private Securities Litigation Reform Act of 1995. All forward-looking statements involve risk and uncertainty and actual results could differ materially from the anticipated results or other expectations expressed in the forward-looking statements. Risks and uncertainties related to the Company's business are discussed in the Company's SEC filings, including its Annual Report on Form 10-K for the year ended December 31, 2009, as updated by the Company's quarterly reports for the quarters ended March 31, 2010, June 30, 2010, and September 30, 2010, and include, but are not limited to, (1) deterioration in the financial condition of borrowers resulting in significant increases in loan losses and provisions for those losses; (2) continuation of the historically low short-term interest rate environment; (3) changes in loan underwriting, credit review or loss reserve policies associated with economic conditions, examination conclusions, or regulatory developments; (4) increased levels of non-performing and repossessed assets and the ability to resolve these may result in future losses; (5) greater than anticipated deterioration or lack of sustained growth in the national or local economies; (6) rapid fluctuations or unanticipated changes in interest rates; (7) the impact of governmental restrictions on entities participating in the Capital Purchase Program (the "CPP") of the United States Department of the Treasury; (8) changes in state and federal legislation, regulations or policies applicable to banks or other financial service providers, including regulatory or legislative developments, like the Dodd-Frank Wall Street Reform and Consumer Protection Act, arising out of current unsettled conditions in the economy (9) the results of regulatory examinations; (10) increased competition with other financial institutions in the markets that GreenBank serves; (11) the Company recording a further valuation allowance related to its deferred tax asset; (12) exploring alternatives available for the future repayment or conversion of the preferred stock issued in the CPP; (13) further deterioration in the valuation of OREO; (14) inability to comply with regulatory capital requirements and to secure any required regulatory approvals for capital actions to raise capital if necessary to comply with any regulatory capital requirements; and (15) the loss of key personnel. The Company undertakes no obligation to update forward-looking statements.
-MORE-
GRNB Reports Fourth Quarter Results
Page 6
February 1, 2011
GREEN BANKSHARES, INC.
Reconciliation of Non-GAAP Measures Presented in Earnings Release
(In thousands)
|
Three Months Ended
|
Year Ended
|
|||||||||||||||||||
|
Dec. 31,
2010
|
Sept. 30,
2010
|
Dec. 31,
2009
|
Dec. 31,
2010
|
Dec. 31,
2009
|
||||||||||||||||
|
Income (loss) before income taxes
|
$ | (40,860 | ) | $ | (34,056 | ) | $ | 1,833 | $ | (65,785 | ) | $ | (167,730 | ) | ||||||
|
Goodwill impairment charge
|
-- | -- | -- | -- | 143,389 | |||||||||||||||
|
Adjusted pre-tax loss
|
$ | (40,860 | ) | $ | (34,056 | ) | $ | 1,833 | $ | (65,785 | ) | $ | (24,341 | ) | ||||||
|
Total non-interest expense
|
$ | 41,986 | $ | 27,009 | $ | 20,477 | $ | 110,815 | $ | 229,587 | ||||||||||
|
Goodwill impairment charge
|
-- | -- | -- | -- | (143,389 | ) | ||||||||||||||
|
Operating expenses
|
$ | 41,986 | $ | 27,009 | $ | 20,477 | $ | 110,815 | $ | 86,198 | ||||||||||
|
Dec. 31,
2010
|
Sept. 30,
2010
|
June 30,
2010
|
Mar. 31,
2010
|
Dec. 31,
2009
|
||||||||||||||||
|
Total shareholders' equity
|
$ | 143,897 | $ | 197,824 | $ | 233,150 | $ | 230,189 | $ | 226,769 | ||||||||||
|
Less:
|
||||||||||||||||||||
|
Core deposit and other intangibles
|
(6,751 | ) | (7,398 | ) | (8,044 | ) | (8,684 | ) | (9,335 | ) | ||||||||||
|
Preferred stock
|
(68,121 | ) | (67,775 | ) | (67,428 | ) | (67,081 | ) | (66,735 | ) | ||||||||||
|
Tangible common equity
|
$ | 69,025 | $ | 122,651 | $ | 157,678 | $ | 154,424 | $ | 150,699 | ||||||||||
|
Tangible common book value per share
|
$ | 5.23 | $ | 9.30 | $ | 11.95 | $ | 11.71 | $ | 11.44 | ||||||||||
|
Total assets
|
$ | 2,406,040 | $ | 2,415,014 | $ | 2,529,332 | $ | 2,569,732 | $ | 2,619,139 | ||||||||||
|
Less:
|
||||||||||||||||||||
|
Core deposit and other intangibles
|
(6,751 | ) | (7,398 | ) | (8,044 | ) | (8,684 | ) | (9,335 | ) | ||||||||||
|
Total tangible assets
|
$ | 2,399,289 | $ | 2,407,616 | $ | 2,521,288 | $ | 2,561,048 | $ | 2,609,804 | ||||||||||
|
Tangible common equity to assets ratio
|
2.88 | % | 5.09 | % | 6.25 | % | 6.03 | % | 5.77 | % | ||||||||||
Use of Non-GAAP financial measures
The above table presents computations and other financial information excluding the goodwill impairment charge incurred by the Company in the second quarter of 2009 and excluding the Company's preferred stock and intangible assets (non-GAAP). The goodwill impairment charge is included in the financial results presented in accordance with generally accepted accounting principles (GAAP). The Company believes that the exclusion of goodwill impairment in expressing net operating income (loss), operating expenses and earnings (loss) per share data provides a more meaningful base for period to period comparisons which will assist investors in analyzing the operating results of the Company and predicting operating performance. The Company utilizes these non-GAAP financial measures to compare the operating performance with comparable periods in prior years and with internally prepared projections. Non-GAAP financial measures have inherent limitations, are not required to be uniformly applied and are not audited. To mitigate these limitations, the Company has policies in place to address normal operating expenses, apart from goodwill impairment, to ensure that the Company's operating results are properly reflected for period to period comparisons.
-MORE-
GRNB Reports Fourth Quarter Results
Page 7
February 1, 2011
GREEN BANKSHARES, INC.
Unaudited Financial Highlights
(In thousands, except per share amounts)
|
Three Months Ended
|
Year Ended
|
|||||||||||||||||||
|
Dec. 31,
2010
|
Sept. 30,
2010
|
Dec. 31,
2009
|
Dec. 31,
2010
|
Dec. 31,
2009
|
||||||||||||||||
|
Interest income
|
$ | 28,213 | $ | 29,455 | $ | 33,424 | $ | 120,864 | $ | 138,456 | ||||||||||
|
Interest expense
|
8,499 | 8,708 | 12,846 | 37,271 | 57,931 | |||||||||||||||
|
Net interest income
|
19,714 | 20,747 | 20,578 | 83,593 | 80,525 | |||||||||||||||
|
Provision for loan losses
|
25,646 | 36,823 | 6,402 | 71,107 | 50,246 | |||||||||||||||
|
Net interest income (loss) after provision for loan losses
|
(5,932 | ) | (16,076 | ) | 14,176 | 12,486 | 30,279 | |||||||||||||
|
Non-interest income
|
7,058 | 9,029 | 8,134 | 32,544 | 31,578 | |||||||||||||||
|
Non-interest expense
|
41,986 | 27,009 | 20,477 | 110,815 | 229,587 | |||||||||||||||
|
Income (loss) before income taxes
|
(40,860 | ) | (34,056 | ) | 1,833 | (65,785 | ) | (167,730 | ) | |||||||||||
|
Income tax provision (benefit)
|
10,688 | 1,098 | 659 | 14,910 | (17,036 | ) | ||||||||||||||
|
Income (loss)
|
(51,548 | ) | (35,154 | ) | 1,174 | (80,695 | ) | (150,694 | ) | |||||||||||
|
Preferred stock dividends and related cost
|
1,250 | 1,251 | 1,250 | 5,001 | 4,982 | |||||||||||||||
|
Net income (loss) available to common shareholders
|
$ | (52,798 | ) | $ | (36,405 | ) | $ | (76 | ) | $ | (85,696 | ) | $ | (155,676 | ) | |||||
|
Comprehensive income (loss)
|
$ | (53,173 | ) | $ | (34,583 | ) | $ | 120 | $ | (79,885 | ) | $ | (149,842 | ) | ||||||
|
Earnings (loss) per common share:
|
||||||||||||||||||||
|
Basic
|
$ | (4.03 | ) | $ | (2.78 | ) | $ | (0.01 | ) | $ | (6.54 | ) | $ | (11.91 | ) | |||||
|
Diluted 1
|
$ | (4.03 | ) | $ | (2.78 | ) | $ | (0.01 | ) | $ | (6.54 | ) | $ | (11.91 | ) | |||||
|
Weighted average common shares:
|
||||||||||||||||||||
|
Basic
|
13,098 | 13,098 | 13,070 | 13,094 | 13,068 | |||||||||||||||
|
Diluted
|
13,098 | 13,098 | 13,070 | 13,094 | 13,068 | |||||||||||||||
|
Dec. 31,
2010
|
Sept. 30,
2010
|
Dec. 31,
2009
|
||||||||||
|
Total assets
|
$ | 2,406,040 | $ | 2,415,014 | $ | 2,619,139 | ||||||
|
Cash and cash equivalents
|
294,214 | 206,391 | 210,494 | |||||||||
|
Investment and other securities
|
215,201 | 178,307 | 172,084 | |||||||||
|
Loans, net of unearned interest
|
1,745,378 | 1,835,591 | 2,043,807 | |||||||||
|
Allowance for loan losses
|
(66,830 | ) | (50,322 | ) | (50,161 | ) | ||||||
|
Deposits
|
1,976,854 | 1,916,544 | 2,084,096 | |||||||||
|
Shareholders' equity
|
143,897 | 197,824 | 226,769 | |||||||||
|
Common shareholders' equity 2
|
75,776 | 130,049 | 160,034 | |||||||||
|
Tangible common shareholders' equity 3
|
69,025 | 122,651 | 150,699 | |||||||||
|
Common book value per share 2
|
5.75 | 9.86 | 12.15 | |||||||||
|
Tangible common book value per share 3
|
5.23 | 9.30 | 11.44 | |||||||||
|
1
|
Diluted weighted average shares outstanding exclude 92,674, 94,267 and 101,258 restricted average shares for the three-month periods ended December 31, 2010, September 30, 2010, and December 31, 2009, respectively, and exclude 92,979, 93,242 and 96,971 restricted average shares for the twelve, nine and twelve-month periods ended December 31, 2010, September 30, 2010, and December 31, 2009, respectively, because their impact would be anti-dilutive.
|
|
2
|
Common shareholders' equity is shareholders' equity less preferred stock.
|
|
3
|
Tangible common shareholders' equity is shareholders' equity less intangible assets and preferred stock.
|
-END-
|
GREEN BANKSHARES, INC.
|
||||||||||||
|
Consolidated Balance Sheets
|
||||||||||||
|
December 31, 2010, September 30, 2010, and December 31, 2009
|
||||||||||||
|
(Dollars in thousands)
|
||||||||||||
|
(Unaudited)
|
(Unaudited)
|
(Unaudited)
|
||||||||||
|
December 31,
|
September 30,
|
December 31,
|
||||||||||
|
2010
|
2010
|
2009* | ||||||||||
|
ASSETS
|
|
|
||||||||||
|
|
|
|||||||||||
|
Cash and due from banks
|
$ | 289,358 | $ | 202,709 | $ | 206,701 | ||||||
|
Federal funds sold
|
4,856 | 3,682 | 3,793 | |||||||||
|
Cash and cash equivalents
|
294,214 | 206,391 | 210,494 | |||||||||
|
Interest earning deposits in other banks
|
- | 1,014 | 11,000 | |||||||||
|
Securities available-for-sale ("AFS")
|
202,002 | 163,964 | 147,724 | |||||||||
|
Securities held-to-maturity (with a market value of $467, $603, and $638
|
||||||||||||
|
on December 31, 2010, September 30, 2010, and December 31, 2009)
|
465 | 595 | 626 | |||||||||
|
FHLB and other stock, at cost
|
12,734 | 12,734 | 12,734 | |||||||||
|
Loans held for sale
|
1,299 | 2,091 | 1,533 | |||||||||
|
Loans, net of unearned income
|
1,745,378 | 1,835,591 | 2,043,807 | |||||||||
|
Allowance for loan losses
|
(66,830 | ) | (50,322 | ) | (50,161 | ) | ||||||
|
Other real estate owned and repossessed assets
|
60,095 | 73,699 | 57,168 | |||||||||
|
Bank premises and equipment, net
|
78,794 | 79,657 | 81,818 | |||||||||
|
Cash surrender value of life insurance
|
31,479 | 31,171 | 30,277 | |||||||||
|
Goodwill
|
- | - | - | |||||||||
|
Core deposit and other intangibles
|
6,751 | 7,398 | 9,335 | |||||||||
|
Deferred Tax Asset (net of valuation allowance of $43,455, $14,618, and $0
|
||||||||||||
|
on December 31, 2010, September 30, 2010, and December 31, 2009)
|
14,848 | 24,422 | 13,600 | |||||||||
|
Other assets
|
24,811 | 26,609 | 49,184 | |||||||||
|
Total assets
|
$ | 2,406,040 | $ | 2,415,014 | $ | 2,619,139 | ||||||
|
LIABILITIES AND SHAREHOLDERS' EQUITY
|
||||||||||||
|
Non-interest-bearing deposits
|
$ | 152,752 | $ | 165,642 | $ | 177,602 | ||||||
|
Interest-bearing deposits
|
1,822,703 | 1,749,503 | 1,899,910 | |||||||||
|
Brokered deposits
|
1,399 | 1,399 | 6,584 | |||||||||
|
Total deposits
|
1,976,854 | 1,916,544 | 2,084,096 | |||||||||
|
Repurchase agreements
|
19,413 | 22,641 | 24,449 | |||||||||
|
FHLB advances and notes payable
|
158,653 | 170,884 | 171,999 | |||||||||
|
Subordinated debentures
|
88,662 | 88,662 | 88,662 | |||||||||
|
Accrued interest payable and other liabilities
|
18,561 | 18,459 | 23,164 | |||||||||
|
Total liabilities
|
2,262,143 | 2,217,190 | 2,392,370 | |||||||||
|
SHAREHOLDERS' EQUITY
|
||||||||||||
|
Preferred stock: no par value, 1,000,000 shares authorized;
|
||||||||||||
|
72,278, 72,278 and 72,278 shares outstanding
|
68,121 | 67,775 | 66,735 | |||||||||
|
Common stock: $2 par value, 20,000,000 shares authorized;
|
||||||||||||
|
13,188,896, 13,190,300, and 13,171,474 shares outstanding
|
26,378 | 26,381 | 26,343 | |||||||||
|
Common stock warrants
|
6,934 | 6,934 | 6,934 | |||||||||
|
Additional paid in capital
|
188,901 | 188,749 | 188,310 | |||||||||
|
Retained earnings (deficit)
|
(147,436 | ) | (94,638 | ) | (61,742 | ) | ||||||
|
Accumulated other comprehensive income
|
999 | 2,623 | 189 | |||||||||
|
Total shareholders' equity
|
143,897 | 197,824 | 226,769 | |||||||||
|
Total liabilities & shareholders' equity
|
$ | 2,406,040 | $ | 2,415,014 | $ | 2,619,139 | ||||||
|
* Derived from Audited Consolidated Financial Statements.
|
||||||||||||
|
GREEN BANKSHARES, INC.
|
||||||||||||||||||||
|
Consolidated Statements of Income and Comprehensive Income
|
||||||||||||||||||||
|
Three Months Ended December 31, 2010, September 30, 2010, and December 31, 2009 and Twelve Months Ended December 31, 2010 and 2009
|
||||||||||||||||||||
|
(Unaudited)
|
||||||||||||||||||||
|
(Dollars in thousands except share and per share data)
|
||||||||||||||||||||
|
Three Months Ended
|
Twelve Months Ended
|
|||||||||||||||||||
|
December 31,
|
September 30,
|
December 31,
|
December 31,
|
December 31,
|
||||||||||||||||
|
2010
|
2010
|
2009
|
2010
|
2009
|
||||||||||||||||
|
Interest income:
|
||||||||||||||||||||
|
Interest and fees on loans
|
$ | 26,543 | $ | 27,744 | $ | 31,480 | $ | 113,721 | $ | 129,212 | ||||||||||
|
Taxable securities
|
1,078 | 1,181 | 1,303 | 4,938 | 7,035 | |||||||||||||||
|
Nontaxable securities
|
319 | 304 | 311 | 1,241 | 1,260 | |||||||||||||||
|
FHLB and other stock
|
122 | 136 | 137 | 530 | 573 | |||||||||||||||
|
Federal funds sold and other
|
151 | 90 | 193 | 434 | 376 | |||||||||||||||
|
Total interest income
|
28,213 | 29,455 | 33,424 | 120,864 | 138,456 | |||||||||||||||
|
Interest expense:
|
||||||||||||||||||||
|
Deposits
|
6,303 | 6,444 | 10,124 | 28,434 | 45,768 | |||||||||||||||
|
Federal funds purchased and repurchase agreements
|
5 | 6 | 7 | 22 | 29 | |||||||||||||||
|
FHLB advances and notes payable
|
1,703 | 1,726 | 2,229 | 6,835 | 9,557 | |||||||||||||||
|
Subordinated debentures
|
488 | 532 | 486 | 1,980 | 2,577 | |||||||||||||||
|
Total interest expense
|
8,499 | 8,708 | 12,846 | 37,271 | 57,931 | |||||||||||||||
|
Net interest income
|
19,714 | 20,747 | 20,578 | 83,593 | 80,525 | |||||||||||||||
|
Provision for loan losses
|
25,646 | 36,823 | 6,402 | 71,107 | 50,246 | |||||||||||||||
|
Net interest income (loss) after provision for loan losses
|
(5,932 | ) | (16,076 | ) | 14,176 | 12,486 | 30,279 | |||||||||||||
|
Non-interest income:
|
||||||||||||||||||||
|
Service charges on deposit accounts
|
4,896 | 6,651 | 6,141 | 24,179 | 23,738 | |||||||||||||||
|
Other charges and fees
|
635 | 417 | 540 | 1,791 | 1,999 | |||||||||||||||
|
Trust and investment services income
|
482 | 1,021 | 505 | 2,842 | 1,977 | |||||||||||||||
|
Mortgage banking income
|
250 | 212 | 91 | 703 | 383 | |||||||||||||||
|
Other income
|
795 | 728 | 619 | 3,122 | 3,042 | |||||||||||||||
|
Securities gains (losses), net
|
||||||||||||||||||||
|
Realized gains (losses), net
|
- | - | 482 | - | 1,415 | |||||||||||||||
|
Other-than-temporary impairment
|
- | - | (719 | ) | (553 | ) | (1,678 | ) | ||||||||||||
|
Less non-credit portion recognized in other comprehensive income
|
- | - | 475 | 460 | 702 | |||||||||||||||
|
Total securities gains (losses), net
|
- | - | 238 | (93 | ) | 439 | ||||||||||||||
|
Total non-interest income
|
7,058 | 9,029 | 8,134 | 32,544 | 31,578 | |||||||||||||||
|
Non-interest expense:
|
||||||||||||||||||||
|
Employee compensation
|
8,087 | 8,266 | 7,540 | 31,990 | 30,611 | |||||||||||||||
|
Employee benefits
|
769 | 816 | 785 | 3,378 | 3,835 | |||||||||||||||
|
Occupancy expense
|
1,733 | 1,792 | 1,695 | 6,908 | 6,956 | |||||||||||||||
|
Equipment expense
|
728 | 742 | 694 | 2,846 | 3,092 | |||||||||||||||
|
Computer hardware/software expense
|
897 | 916 | 793 | 3,523 | 2,816 | |||||||||||||||
|
Professional services
|
853 | 741 | 676 | 2,777 | 2,108 | |||||||||||||||
|
Advertising
|
327 | 657 | 473 | 2,388 | 1,894 | |||||||||||||||
|
OREO maintenance expense
|
613 | 712 | 411 | 2,324 | 1,222 | |||||||||||||||
|
Collection and repossession expense
|
899 | 508 | 1,347 | 3,228 | 3,131 | |||||||||||||||
|
Loss on OREO and repossessed assets
|
21,922 | 6,538 | 1,151 | 29,895 | 8,156 | |||||||||||||||
|
FDIC insurance
|
996 | 1,099 | 891 | 4,155 | 4,960 | |||||||||||||||
|
Core deposit and other intangible amortization
|
647 | 646 | 646 | 2,584 | 2,750 | |||||||||||||||
|
Goodwill impairment
|
- | - | - | - | 143,389 | |||||||||||||||
|
Other expenses
|
3,515 | 3,576 | 3,375 | 14,819 | 14,667 | |||||||||||||||
|
Total non-interest expense
|
41,986 | 27,009 | 20,477 | 110,815 | 229,587 | |||||||||||||||
|
Income (loss) before income taxes
|
(40,860 | ) | (34,056 | ) | 1,833 | (65,785 | ) | (167,730 | ) | |||||||||||
|
Income taxes provision (benefit)
|
10,688 | 1,098 | 659 | 14,910 | (17,036 | ) | ||||||||||||||
|
Net income (loss)
|
(51,548 | ) | (35,154 | ) | 1,174 | (80,695 | ) | (150,694 | ) | |||||||||||
|
Preferred stock dividends and accretion of discount on warrants
|
1,250 | 1,251 | 1,250 | 5,001 | 4,982 | |||||||||||||||
|
Net income (loss) available to common shareholders
|
$ | (52,798 | ) | $ | (36,405 | ) | $ | (76 | ) | $ | (85,696 | ) | $ | (155,676 | ) | |||||
|
Comprehensive income (loss)
|
$ | (53,173 | ) | $ | (34,583 | ) | $ | 120 | $ | (79,885 | ) | $ | (149,842 | ) | ||||||
|
Per share of common stock:
|
||||||||||||||||||||
|
Basic earnings (loss)
|
$ | (4.03 | ) | $ | (2.78 | ) | $ | (0.01 | ) | $ | (6.54 | ) | $ | (11.91 | ) | |||||
|
Diluted earnings (loss)
|
$ | (4.03 | ) | $ | (2.78 | ) | $ | (0.01 | ) | $ | (6.54 | ) | $ | (11.91 | ) | |||||
|
Dividends
|
$ | 0.00 | $ | 0.00 | $ | 0.00 | $ | 0.00 | $ | 0.13 | ||||||||||
|
Weighted average shares outstanding:
|
||||||||||||||||||||
|
Basic
|
13,097,611 | 13,097,611 | 13,070,216 | 13,093,847 | 13,068,407 | |||||||||||||||
|
Diluted(1)
|
13,097,611 | 13,097,611 | 13,070,216 | 13,093,847 | 13,068,407 | |||||||||||||||
|
(1)Diluted weighted average shares outstanding exclude 92,674, 94,267 and 101,258 of the restricted average shares for the three month periods ended December 31, 2010, September 30, 2010 and December 31, 2009 and exclude 92,979, 93,242 and 96,971 of the restricted average shares for the twelve and nine month periods ended December 31, 2010, September 30, 2010 and December 31, 2009 because their impact would be anti-dilutive.
|
||||||||||||||||||||
|
GREEN BANKSHARES, INC.
|
|
Consolidated Financial Highlights
|
|
(UNAUDITED)
|
|
(Dollars in thousands except share and per share data)
|
|||||||||||||
|
December 31,
|
December 31,
|
%
|
|||||||||||
|
2010
|
2009
|
Change
|
|||||||||||
|
Financial Condition Data:
|
|||||||||||||
|
Assets
|
$ | 2,406,040 | $ | 2,619,139 | -8.14 | % | |||||||
|
Loans, net of unearned interest
|
1,745,378 | 2,043,807 | -14.60 | % | |||||||||
|
Cash and investments
|
509,415 | 382,578 | 33.15 | % | |||||||||
|
Federal funds sold
|
4,856 | 3,793 | 28.03 | % | |||||||||
|
Deposits
|
1,976,854 | 2,084,096 | -5.15 | % | |||||||||
|
FHLB advances and notes payable
|
158,653 | 171,999 | -7.76 | % | |||||||||
|
Subordinated debentures
|
88,662 | 88,662 | 0.00 | % | |||||||||
|
Repurchase agreements
|
19,413 | 24,449 | -20.60 | % | |||||||||
|
Shareholders' equity
|
143,897 | 226,769 | -36.54 | % | |||||||||
|
Common shareholders' equity (1)
|
75,776 | 160,034 | -52.65 | % | |||||||||
|
Tangible common shareholders' equity (2)
|
69,025 | 150,699 | -54.20 | % | |||||||||
|
Tangible shareholders' equity (3)
|
137,146 | 217,434 | -36.93 | % | |||||||||
|
Ratios:
|
|||||||||||||
|
Common book value per share (1)
|
$ | 5.75 | $ | 12.15 | -52.67 | % | |||||||
|
Tangible common book value per share (2)
|
$ | 5.23 | $ | 11.44 | -54.28 | % | |||||||
|
Total tangible equity to tangible assets (3)(4)
|
5.72 | % | 8.33 | % | -31.39 | % | |||||||
|
Tangible common equity to tangible assets (2)(4)
|
2.88 | % | 5.77 | % | -50.18 | % | |||||||
|
Average equity to average assets
|
8.85 | % | 11.09 | % | -20.20 | % | |||||||
|
(1) Common shareholders' equity is shareholders' equity less preferred stock.
|
|||||||||||||
|
(2) Tangible common shareholders' equity is shareholders' equity less goodwill, intangible assets and preferred stock.
|
|||||||||||||
|
(3) Tangible shareholders' equity is shareholders' equity less goodwill and intangible assets.
|
|||||||||||||
|
(4) Tangible assets is total assets less goodwill and intangible assets.
|
|||||||||||||
|
Three Months Ended
|
Twelve Months Ended
|
||||||||||||||||||||||||
|
December 31,
|
December 31,
|
||||||||||||||||||||||||
|
2010
|
2009
|
% Change
|
2010
|
2009
|
% Change
|
||||||||||||||||||||
|
Operating Data:
|
|||||||||||||||||||||||||
|
Total interest income
|
$ | 28,213 | $ | 33,424 | -15.59 | % | $ | 120,864 | $ | 138,456 | -12.71 | % | |||||||||||||
|
Total interest expense
|
8,499 | 12,846 | -33.84 | % | 37,271 | 57,931 | -35.66 | % | |||||||||||||||||
|
Net interest income
|
19,714 | 20,578 | -4.20 | % | 83,593 | 80,525 | 3.81 | % | |||||||||||||||||
|
Provision for loan losses
|
25,646 | 6,402 | 300.59 | % | 71,107 | 50,246 | 41.52 | % | |||||||||||||||||
|
Net interest income (loss) after provision for loan losses
|
(5,932 | ) | 14,176 | -141.85 | % | 12,486 | 30,279 | -58.76 | % | ||||||||||||||||
|
Non-interest income
|
7,058 | 8,134 | -13.23 | % | 32,544 | 31,578 | 3.06 | % | |||||||||||||||||
|
Non-interest expense
|
41,986 | 20,477 | 105.04 | % | 110,815 | 229,587 | -51.73 | % | |||||||||||||||||
|
Income (loss) before income taxes
|
(40,860 | ) | 1,833 | -2329.13 | % | (65,785 | ) | (167,730 | ) | 60.78 | % | ||||||||||||||
|
Income tax expense (benefit)
|
10,688 | 659 | 1521.85 | % | 14,910 | (17,036 | ) | 187.52 | % | ||||||||||||||||
|
Net income (loss)
|
(51,548 | ) | 1,174 | -4490.80 | % | (80,695 | ) | (150,694 | ) | 46.45 | % | ||||||||||||||
|
Preferred stock dividend and accretion of discount on warrants
|
1,250 | 1,250 | 0.00 | % | 5,001 | 4,982 | 0.38 | % | |||||||||||||||||
|
Net income (loss) available to common shareholders
|
$ | (52,798 | ) | $ | (76 | ) | -69371.05 | % | $ | (85,696 | ) | $ | (155,676 | ) | 44.95 | % | |||||||||
|
Comprehensive income (loss)
|
$ | (53,173 | ) | $ | 120 | -44410.83 | % | $ | (79,885 | ) | $ | (149,842 | ) | 46.69 | % | ||||||||||
|
Per Share of Common Stock:
|
|||||||||||||||||||||||||
|
Basic earnings (loss)
|
$ | (4.03 | ) | $ | (0.01 | ) | -40200.00 | % | $ | (6.54 | ) | $ | (11.91 | ) | 45.09 | % | |||||||||
|
Diluted earnings (loss)
|
$ | (4.03 | ) | $ | (0.01 | ) | -40200.00 | % | $ | (6.54 | ) | $ | (11.91 | ) | 45.09 | % | |||||||||
|
Dividends
|
$ | 0.00 | $ | 0.00 | 0.00 | % | $ | 0.00 | $ | 0.13 | -100.00 | % | |||||||||||||
|
Weighted Average Shares Outstanding:
|
|||||||||||||||||||||||||
|
Basic
|
13,097,611 | 13,070,216 | 13,093,847 | 13,068,407 | |||||||||||||||||||||
|
Diluted
|
13,097,611 | 13,070,216 | 13,093,847 | 13,068,407 | |||||||||||||||||||||
|
Three Months Ended
|
Twelve Months Ended
|
||||||||||
| December 31, | September 30, | December 31, |
December 31,
|
||||||||
|
2010
|
2010
|
2009
|
2010
|
2009
|
|||||||
|
Key Financial Ratios:
|
|||||||||||
|
Return on average assets
|
-8.54%
|
-5.86%
|
-0.01%
|
-3.41%
|
-5.59%
|
||||||
|
Return on average shareholders' equity
|
-108.58%
|
-62.23%
|
-0.13%
|
-38.56%
|
-50.44%
|
||||||
|
Return on average common shareholders' equity (1)
|
-167.55%
|
-87.78%
|
-0.19%
|
-55.35%
|
-64.25%
|
||||||
|
Return on average common tangible shareholders' equity (2)
|
-177.12%
|
-91.91%
|
-0.20%
|
-58.32%
|
-96.77%
|
||||||
|
Interest rate spread
|
3.76%
|
3.83%
|
3.26%
|
3.79%
|
3.19%
|
||||||
|
Net interest margin
|
3.77%
|
3.90%
|
3.37%
|
3.86%
|
3.34%
|
||||||
|
Efficiency Ratio
|
156.83%
|
90.71%
|
71.32%
|
95.42%
|
204.80%
|
||||||
| (1) Common shareholders' equity is shareholders' equity less preferred stock. | |||||||||||
| (2) Tangible common shareholders' equity is shareholders' equity less goodwill, intangible assets and preferred stock. | |||||||||||
|
December 31,
|
September 30,
|
December 31,
|
|||||||||||
|
2010
|
2010
|
2009
|
|||||||||||
|
Asset Quality Ratios:
|
|||||||||||||
|
Nonperforming loans as a percentage of total loans,
|
|||||||||||||
|
net of unearned income
|
8.35 | % | 6.73 | % | 3.70 | % | |||||||
|
Nonperforming assets as a percentage of total assets
|
8.56 | % | 8.16 | % | 5.07 | % | |||||||
|
Allowance for loan losses as a percentage of total loans,
|
|||||||||||||
|
net of unearned income
|
3.83 | % | 2.74 | % | 2.45 | % | |||||||
|
Allowance for loan losses as a percentage of
|
|||||||||||||
|
nonperforming loans
|
45.83 | % | 40.76 | % | 66.39 | % | |||||||
|
Net charge-offs to average total loans, net of
|
|||||||||||||
|
unearned income
|
2.84 | % | 2.31 | % | 2.25 | % | |||||||
|
GREEN BANKSHARES, INC.
|
|
Consolidated Financial Highlights
|
|
December 31, 2010
|
|
(UNAUDITED)
|
|
Nonperforming Assets and Net Charge-offs
|
Asset Quality Ratios
|
||||||||||||||||||||||||
|
As of and for the year ended December 31, 2010
|
Bank
|
Other
|
Total
|
As of and for the year ended December 31, 2010
|
Bank
|
Other
|
Consolidated
|
||||||||||||||||||
|
Loans past due 90 days and still accruing
|
$ | 2,094 | $ | 18 | $ | 2,112 |
Nonperforming loans as a percentage of total loans, net of unearned income
|
8.40 | % | 1.30 | % | 8.35 | % | ||||||||||||
|
Nonaccrual loans
|
143,153 | 554 | 143,707 |
Nonperforming assets as a percentage of total assets
|
8.34 | % | 9.84 | % | 8.56 | % | |||||||||||||||
|
Other real estate owned and repossessed assets
|
55,164 | 4,931 | 60,095 |
Allowance for loan losses as a percentage of total loans, net of unearned income
|
3.68 | % | 7.33 | % | 3.83 | % | |||||||||||||||
|
Total nonperforming assets
|
$ | 200,411 | $ | 5,503 | $ | 205,914 |
Allowance for loan losses as a percentage of nonperforming loans
|
43.80 | % | 562.24 | % | 45.83 | % | ||||||||||||
|
YTD net charge-offs to average total loans, net of unearned income
|
2.76 | % | 4.20 | % | 2.84 | % | |||||||||||||||||||
|
YTD net charge-offs
|
$ | 52,615 | $ | 1,823 | $ | 54,438 | |||||||||||||||||||
|
As of and for the year ended December 31, 2009
|
Bank
|
Other
|
Total
|
As of and for the year ended December 31, 2009
|
Bank
|
Other
|
Consolidated
|
||||||||||||||||||
|
Loans past due 90 days and still accruing
|
$ | 147 | $ | - | $ | 147 |
Nonperforming loans as a percentage of total loans, net of unearned income
|
3.69 | % | 1.50 | % | 3.70 | % | ||||||||||||
|
Nonaccrual loans
|
74,761 | 650 | 75,411 |
Nonperforming assets as a percentage of total assets
|
5.04 | % | 2.02 | % | 5.07 | % | |||||||||||||||
|
Other real estate owned and repossessed assets
|
56,799 | 369 | 57,168 |
Allowance for loan losses as a percentage of total loans, net of unearned income
|
2.30 | % | 8.05 | % | 2.45 | % | |||||||||||||||
|
Total nonperforming assets
|
$ | 131,707 | $ | 1,019 | $ | 132,726 |
Allowance for loan losses as a percentage of nonperforming loans
|
62.29 | % | 538.31 | % | 66.39 | % | ||||||||||||
|
Net charge-offs to average total loans, net of unearned income
|
2.15 | % | 5.88 | % | 2.25 | % | |||||||||||||||||||
|
Net charge-offs
|
$ | 46,394 | $ | 2,502 | $ | 48,896 | |||||||||||||||||||
|
GREEN BANKSHARES, INC.
|
||||||||||||||||||||||||||||||||||||||||||||||||
|
Condensed Average Balances, Interest Rates and Yields
|
||||||||||||||||||||||||||||||||||||||||||||||||
|
December 31, 2010
|
||||||||||||||||||||||||||||||||||||||||||||||||
|
Three Months Ended
|
Twelve Months Ended
|
|||||||||||||||||||||||||||||||||||||||||||||||
|
December 31,
|
December 31,
|
|||||||||||||||||||||||||||||||||||||||||||||||
|
2010
|
2009
|
2010
|
2009
|
|||||||||||||||||||||||||||||||||||||||||||||
|
Average
|
Average
|
Average
|
Average
|
Average
|
Average
|
Average
|
Average
|
|||||||||||||||||||||||||||||||||||||||||
|
Balance
|
Interest
|
Rate
|
Balance
|
Interest
|
Rate
|
Balance
|
Interest
|
Rate
|
Balance
|
Interest
|
Rate
|
|||||||||||||||||||||||||||||||||||||
|
Interest-earning assets:
|
||||||||||||||||||||||||||||||||||||||||||||||||
|
Loans(1)(2)
|
1,676,376 | 26,558 | 6.29 | % | 2,009,041 | 31,502 | 6.22 | % | 1,833,865 | 113,788 | 6.20 | % | 2,096,181 | 129,272 | 6.17 | % | ||||||||||||||||||||||||||||||||
|
Investment securities (2)
|
180,047 | 1,690 | 3.72 | % | 161,588 | 1,918 | 4.71 | % | 180,681 | 7,376 | 4.08 | % | 189,377 | 9,546 | 5.04 | % | ||||||||||||||||||||||||||||||||
|
Other short-term investments
|
237,976 | 152 | 0.25 | % | 275,243 | 193 | 0.28 | % | 170,952 | 435 | 0.25 | % | 147,918 | 376 | 0.25 | % | ||||||||||||||||||||||||||||||||
|
Total interest-earning assets
|
2,094,399 | 28,400 | 5.38 | % | 2,445,872 | 33,613 | 5.45 | % | 2,185,498 | 121,599 | 5.56 | % | 2,433,476 | 139,194 | 5.72 | % | ||||||||||||||||||||||||||||||||
|
Non-interest earning assets
|
357,387 | 290,294 | 325,948 | 349,179 | ||||||||||||||||||||||||||||||||||||||||||||
|
Total assets
|
2,451,786 | 2,736,166 | 2,511,446 | 2,782,655 | ||||||||||||||||||||||||||||||||||||||||||||
|
Interest-bearing liabilities:
|
||||||||||||||||||||||||||||||||||||||||||||||||
|
Deposits:
|
||||||||||||||||||||||||||||||||||||||||||||||||
|
Interest checking, money market and savings
|
1,018,134 | 2,517 | 0.98 | % | 907,257 | 2,521 | 1.10 | % | 980,878 | 9,924 | 1.01 | % | 784,135 | 10,078 | 1.29 | % | ||||||||||||||||||||||||||||||||
|
Time deposits
|
778,060 | 3,786 | 1.93 | % | 1,096,099 | 7,603 | 2.75 | % | 841,458 | 18,510 | 2.20 | % | 1,166,640 | 35,690 | 3.06 | % | ||||||||||||||||||||||||||||||||
|
Total interest bearing-deposits
|
1,796,194 | 6,303 | 1.39 | % | 2,003,356 | 10,124 | 2.00 | % | 1,822,336 | 28,434 | 1.56 | % | 1,950,775 | 45,768 | 2.35 | % | ||||||||||||||||||||||||||||||||
|
Securities sold under repurchase and short-term borrowings
|
20,848 | 5 | 0.10 | % | 25,631 | 7 | 0.11 | % | 22,338 | 22 | 0.10 | % | 28,049 | 29 | 0.10 | % | ||||||||||||||||||||||||||||||||
|
Notes payable
|
169,910 | 1,703 | 3.98 | % | 206,324 | 2,229 | 4.29 | % | 171,229 | 6,835 | 3.99 | % | 221,282 | 9,557 | 4.32 | % | ||||||||||||||||||||||||||||||||
|
Subordinated debentures
|
88,662 | 488 | 2.18 | % | 88,662 | 486 | 2.17 | % | 88,662 | 1,980 | 2.23 | % | 88,662 | 2,577 | 2.91 | % | ||||||||||||||||||||||||||||||||
|
Total interest-bearing liabilities
|
2,075,614 | 8,499 | 1.62 | % | 2,323,973 | 12,846 | 2.19 | % | 2,104,565 | 37,271 | 1.77 | % | 2,288,768 | 57,931 | 2.53 | % | ||||||||||||||||||||||||||||||||
|
Non-interest bearing liabilities:
|
||||||||||||||||||||||||||||||||||||||||||||||||
|
Demand Deposits
|
167,201 | 159,951 | 166,814 | 162,765 | ||||||||||||||||||||||||||||||||||||||||||||
|
Other Liabilities
|
16,060 | 22,834 | 17,854 | 22,477 | ||||||||||||||||||||||||||||||||||||||||||||
|
Total non-interest bearing liabilities
|
183,261 | 182,785 | 184,668 | 185,242 | ||||||||||||||||||||||||||||||||||||||||||||
|
Total liabilities
|
2,258,875 | 2,506,758 | 2,289,233 | 2,474,010 | ||||||||||||||||||||||||||||||||||||||||||||
|
Shareholders' equity
|
192,911 | 229,408 | 222,213 | 308,645 | ||||||||||||||||||||||||||||||||||||||||||||
|
Total liabilities & shareholders' equity
|
2,451,786 | 2,736,166 | 2,511,446 | 2,782,655 | ||||||||||||||||||||||||||||||||||||||||||||
|
Net interest income
|
19,901 | 20,767 | 84,328 | 81,263 | ||||||||||||||||||||||||||||||||||||||||||||
|
Interest rate spread
|
3.76 | % | 3.26 | % | 3.79 | % | 3.19 | % | ||||||||||||||||||||||||||||||||||||||||
|
Net yield on interest-
earning assets (net
interest margin)
|
3.77 | % | 3.37 | % | 3.86 | % | 3.34 | % | ||||||||||||||||||||||||||||||||||||||||
|
(1)Average loan balances exclude nonaccrual loans for the periods presented.
|
||||||||||||||||||||||||||||||||||||||||||||||||
|
(2)Fully Taxable Equivalent (“FTE”) at the rate of 35%. The FTE basis adjusts for the tax benefits of income on certain tax-exempt loans and investments using the federal statutory rate of 35% for each period presented. The Company believes this measure to be the preferred industry measurement of net interest income and provides relevant comparison between taxable and non-taxable amounts.
|
||||||||||||||||||||||||||||||||||||||||||||||||
|
GREEN BANKSHARES, INC.
|
|||
|
Consolidated Financial Highlights
|
|||
|
December 31, 2010
|
|||
|
(UNAUDITED)
|
|
December 31, 2010
|
September 30, 2010
|
|||||||||||||||||||||
|
Loans
|
Balance
|
%
|
Balance
|
%
|
% Change
|
|||||||||||||||||
|
Commercial
|
$ | 222,927 | 12.67 | % | $ | 240,314 | 13.14 | % | -7.24 | % | ||||||||||||
|
Commercial real estate
|
1,080,805 | 61.41 | % | 1,143,654 | 62.92 | % | -5.50 | % | ||||||||||||||
|
Residential real estate
|
378,783 | 21.52 | % | 385,950 | 19.78 | % | -1.86 | % | ||||||||||||||
|
Consumer
|
75,498 | 4.29 | % | 76,792 | 4.04 | % | -1.69 | % | ||||||||||||||
|
Other
|
1,913 | 0.11 | % | 3,440 | 0.13 | % | -44.39 | % | ||||||||||||||
|
Total loans
|
1,759,926 | 100.00 | % | 1,850,150 | 100.00 | % | -4.88 | % | ||||||||||||||
|
Less: Unearned income
|
(14,548 | ) | (14,559 | ) | ||||||||||||||||||
|
Loans, net of unearned income
|
$ | 1,745,378 | $ | 1,835,591 | ||||||||||||||||||
|
Loan Balances by Geographical Region and Operating Subsidiaries
|
||||||||||||||||||||||
|
December 31, 2010
|
September 30, 2010
|
|||||||||||||||||||||
|
Loan
|
% to
|
Loan
|
% to
|
|||||||||||||||||||
|
Balance
|
Total Loans
|
Balance
|
Total Loans
|
% Change
|
||||||||||||||||||
|
Northeastern Tennessee Region(1)
|
$ | 522,218 | 29.92 | % | $ | 526,219 | 28.93 | % | -0.76 | % | ||||||||||||
|
East Tennessee Region
|
508,269 | 29.12 | % | 563,997 | 30.98 | % | -9.88 | % | ||||||||||||||
|
Middle Tennessee Region
|
671,005 | 38.45 | % | 701,925 | 37.83 | % | -4.41 | % | ||||||||||||||
|
GCB Acceptance Corporation
|
19,062 | 1.09 | % | 19,104 | 1.00 | % | -0.22 | % | ||||||||||||||
|
Superior Financial Services, Inc.
|
24,824 | 1.42 | % | 24,346 | 1.27 | % | 1.96 | % | ||||||||||||||
|
Loans, net of unearned income
|
$ | 1,745,378 | 100.00 | % | $ | 1,835,591 | 100.00 | % | -4.91 | % | ||||||||||||
|
(1) Includes one branch located in Southwestern Virginia and one branch located in Northwestern North Carolina
|
||||||||||||||||||||||
|
December 31, 2010
|
September 30, 2010
|
|||||||||||||||||||||
|
Deposits
|
Balance
|
%
|
Balance
|
%
|
% Change
|
|||||||||||||||||
|
Non-interest bearing demand
|
$ | 152,752 | 7.73 | % | $ | 165,642 | 8.56 | % | -7.78 | % | ||||||||||||
|
Interest bearing demand
|
695,451 | 35.18 | % | 673,904 | 33.49 | % | 3.20 | % | ||||||||||||||
|
Money market and savings
|
345,565 | 17.47 | % | 324,161 | 15.39 | % | 6.60 | % | ||||||||||||||
|
Retail time
|
473,386 | 23.95 | % | 463,800 | 25.95 | % | 2.07 | % | ||||||||||||||
|
Jumbo time
|
309,700 | 15.67 | % | 289,037 | 16.61 | % | 7.15 | % | ||||||||||||||
|
Total
|
$ | 1,976,854 | 100.00 | % | $ | 1,916,544 | 100.00 | % | 3.15 | % | ||||||||||||
|
Deposit Balances by Geographical Region
|
||||||||||||||||||||||
|
December 31, 2010
|
September 30, 2010
|
|||||||||||||||||||||
|
Balance
|
%
|
Balance
|
%
|
% Change
|
||||||||||||||||||
|
Northeastern Tennessee Region(1)
|
$ | 712,676 | 36.05 | % | $ | 694,111 | 36.39 | % | 2.67 | % | ||||||||||||
|
East Tennessee Region
|
323,481 | 16.36 | % | 314,773 | 16.09 | % | 2.77 | % | ||||||||||||||
|
Middle Tennessee Region
|
940,697 | 47.59 | % | 907,660 | 47.52 | % | 3.64 | % | ||||||||||||||
|
Total
|
$ | 1,976,854 | 100.00 | % | $ | 1,916,544 | 100.00 | % | 3.15 | % | ||||||||||||
|
(1) Includes one branch located in Southwestern Virginia and one branch located in Northwestern North Carolina
|
||||||||||||||||||||||