Attached files
| file | filename |
|---|---|
| 8-K - FORM 8-K - SENSUS USA INC | d8k.htm |
 Business Overview
Sensus
January 2011
Exhibit 99.1 |
 Safe
Harbor Statement 2
The statements made during this presentation, other than historical facts, are made
in reliance on the safe- harbor provisions of the Private Securities
Litigation Reform Act of 1995. These statements involve risks and
uncertainties and are subject to change at any time. These statements reflect the Company’s current
expectations regarding its financial position, revenues, cash flow and other
operating results, business strategy, financing plans, forecasted trends
related to the markets in which the Company operates, legal proceedings and
similar matters. We cannot assure you that the expectations expressed or implied in these
forward-looking statements will turn out to be accurate. Our actual results
could be materially different from our
operations
because
of
various
risks.
These
risks
include
any
future
restatements
of
our
consolidated
financial statements, our inability to maintain effective internal controls over
financial reporting, our susceptibility to macroeconomic downturns in the
United States and abroad, conditions in the residential, commercial and
industrial construction markets and in the automotive industry, our dependence on new
product development and intellectual property, and our dependence on independent
distributors and third- party contract manufacturers, automotive vehicle
production levels and schedules, our substantial financial leverage, debt
service and other cash requirements, liquidity constraints and risks related to future growth
and expansion. Other important risk factors that could cause actual events or
results to differ from those contained or implied in the forward-looking
statements include, without limitation, our ability to integrate acquired
companies, general economic and business conditions, competition, adverse changes in the
regulatory or legislative environment in which we operate, customer cancellations
and other factors beyond the Company’s control. We encourage you to
review our annual report on Form 10-K/A, which discusses in greater
detail our results of operations for the most recently completed fiscal year and consider the risks
that relate to any of our forward-looking statements.
|
 Agenda
About Sensus
1
Dynamic Market Opportunities
2
Differentiated Technology Offerings
3
Current Market Leadership
4
Strong Financial Performance
5
3
Appendix
6 |
 Sensus
Business Segments 4
1
* Revenue for Last Twelve Months Ended September 30, 2010 in millions
Reporting
Segment
Revenue*
Reach
Business Activity
Utility
Infrastructure
$743M
•
Global
•
Smart Grid communications networks including:
–
Smart metering, distribution automation, and
lighting control solutions and software
–
Demand response and Home Area Network
solutions and software
•
Water, gas and electric meters
All Other
$130M
•
USA
•
China
•
Pipe repair clamps & couplings
•
Aluminum die castings for automotive and other
applications |
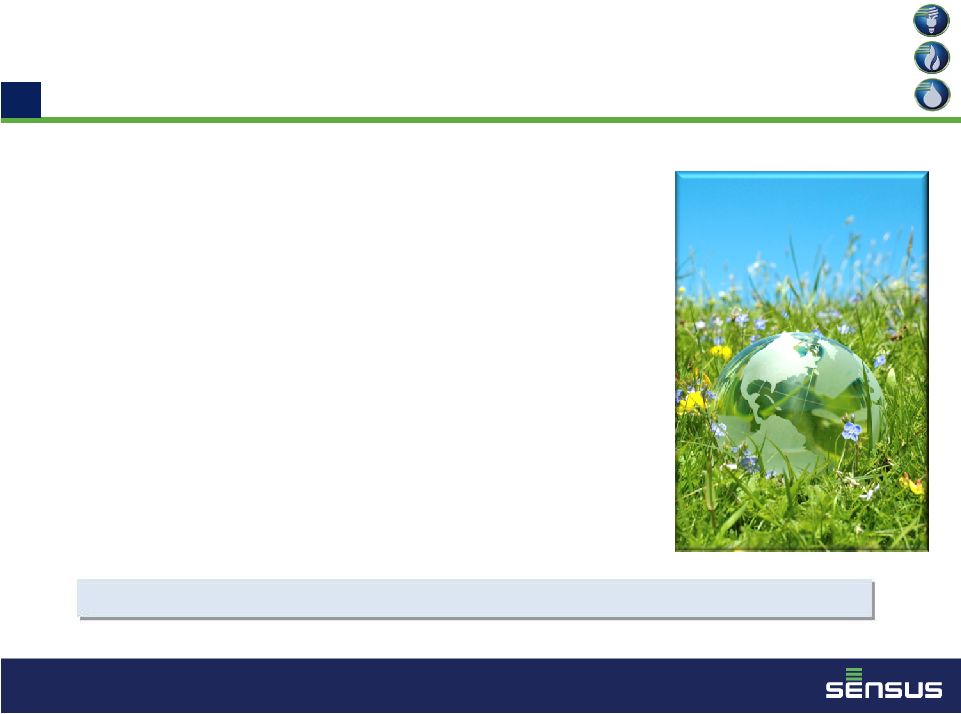
 Sweeping societal and industry changes
to conserve and efficiently use electricity
and water resources solidly position
Sensus
for strong profitable growth
Sensus
is Uniquely Positioned
5
1 |
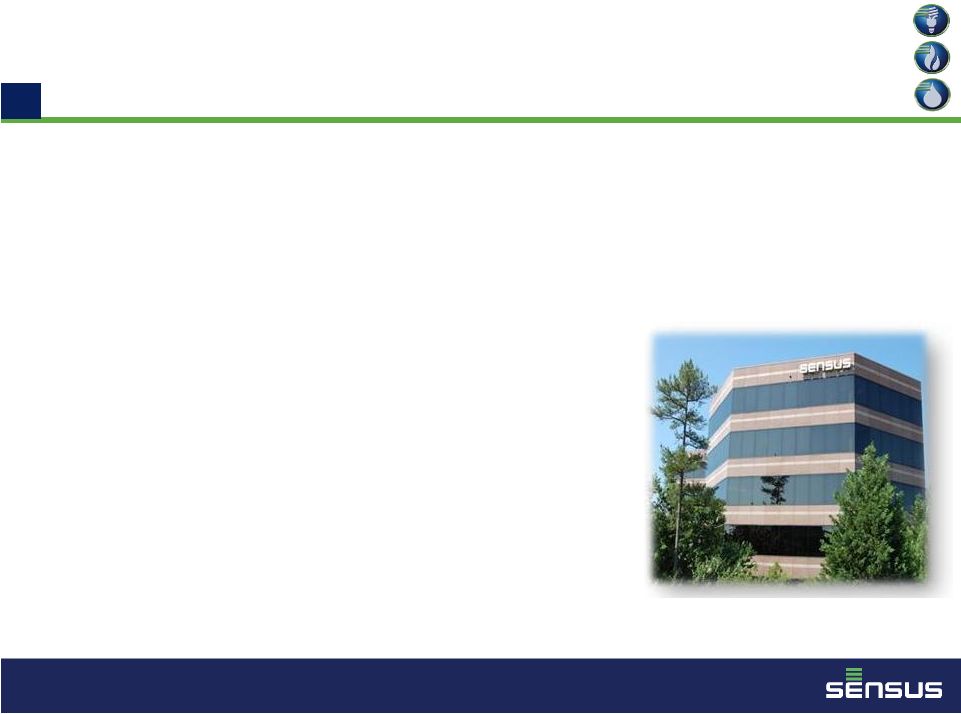 1
About Sensus
•
$873 million of Net Sales at LTM Sept. 2010*
–
7% CAGR over 5 years
•
$107 million Adjusted EBITDA** at LTM Sept. 2010*
–
12% margin
•
Serves the global electric, water & gas markets with
–
Single, licensed communications network platform
•
Leader in the utility smart grid market
–
Over 8 million SmartPoint™
devices installed in full utility
deployments
•
More than a century of utility experience
–
Over 100 million meters installed worldwide
6
Headquarters
Raleigh, NC
* LTM Sept. represents the Last Twelve Months Ended September 30,
2010. ** See Appendix: Non-GAAP Measure. |
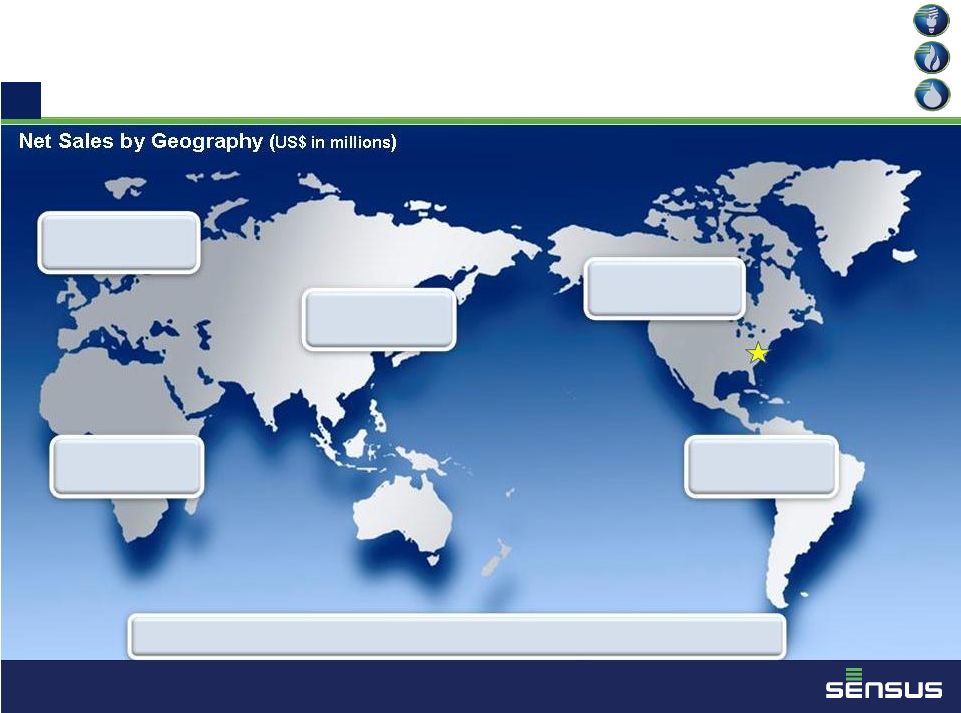 Presence on five
continents with nearly 4,000 people LTM Sep* $28
FY04 $12
LTM Sep* $177
FY04 $152
LTM Sep* $16
FY04 $7
LTM Sep* $606
FY04 $349
LTM Sep* $46
FY04 $9
Global Reach, Global Growth
7
Net
Sales
by
Geography
(US$
in
millions)
1
* “LTM Sep”
represents the Last Twelve Months Ended September 30, 2010. |
 8
The global utility industry is
undergoing a dramatic
technology transformation
creating compelling
market
opportunities
2
Dynamic Market Opportunities |
 Global
Market Drivers •
Increasing demand and conservation of energy
and water
•
Alternative/renewable energy and distributed
generation
•
Aging infrastructure and workforce
•
Real-time information requirements
•
Carbon emission and climate change initiatives
•
Active regulatory environments
9
2
Create tremendous opportunities for Sensus |
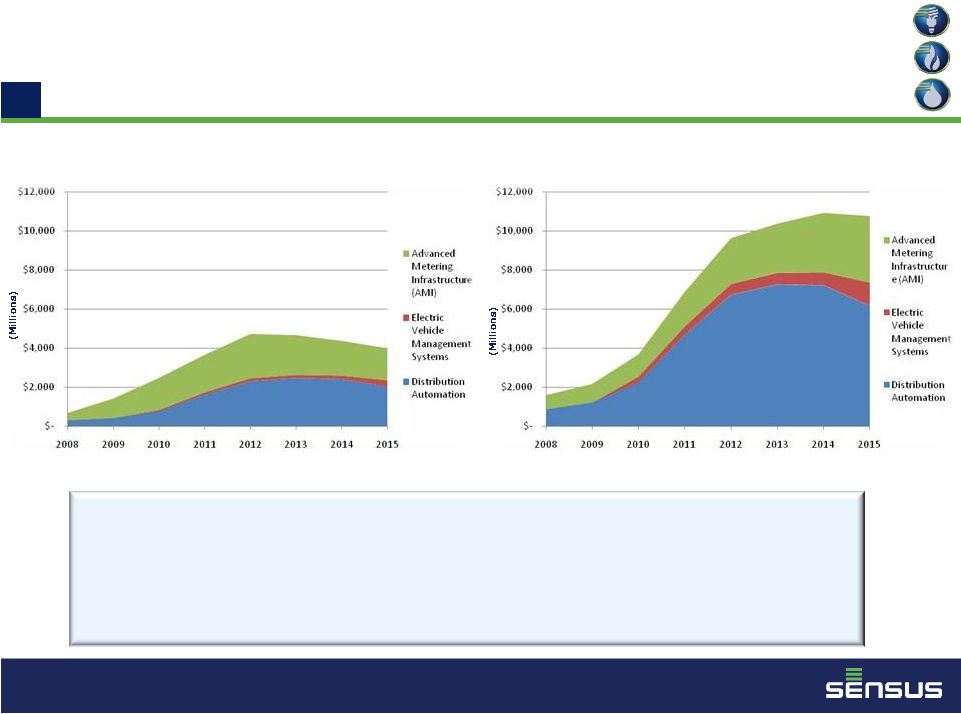 Electric Smart Grid
Market Projections
Smart Grid Revenue by Application, World Markets
(Excluding the United States): 2008-2015
Smart Grid Revenue by Application, United States: 2008-2015
10
•
The U.S. market is leading the global smart grid conversion
•
The U.S. smart grid market doubles over the next 5 years
•
Markets outside of U.S. are following the U.S. in smart grid conversion
and more than doubling over the next 5 years
•
Distribution Automation is accelerating
Source: Pike Research
Source: Pike Research
2 |
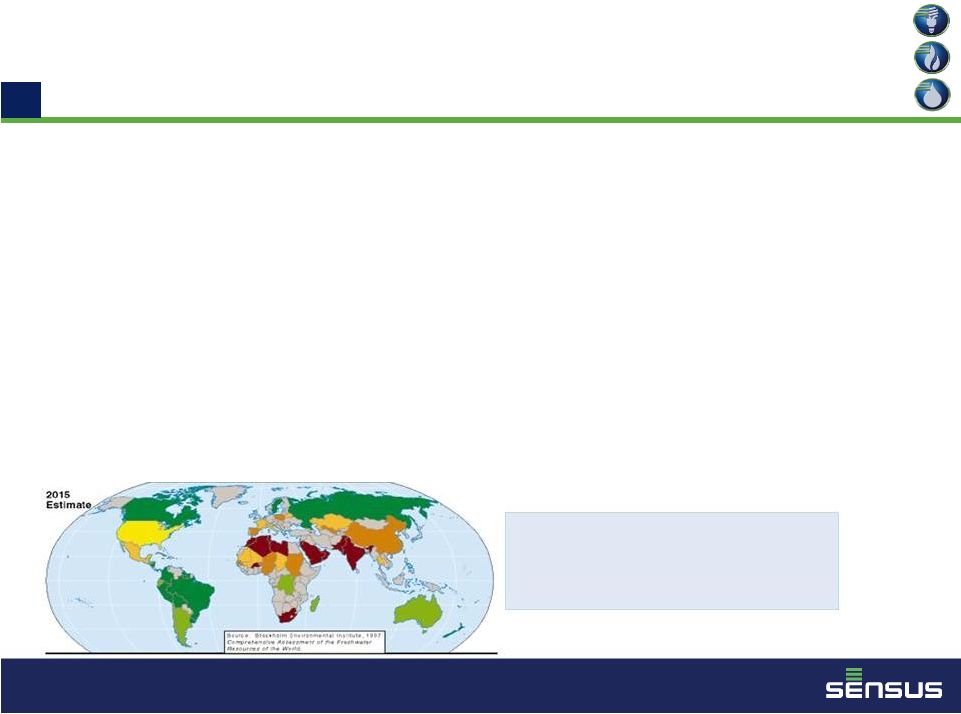 World
Water Availability is Declining 11
Source: Stockholm Environmental Institute
2
•
World population and demand for water are increasing
•
Conservation is becoming a global mandate
•
Accurate and timely monitoring and control of water usage is critical
•
Global water footprint positions Sensus
favorably for continued growth
•
The U.S. Environmental Protection Agency estimates $274 billion
will be
needed for U.S. water infrastructure over the next 20 years ($14
billion/year)
Water Availability:
Grey: No data
Dark Green: Very
high Light Orange: Low
Light Green:
High Dark Orange: Very Low
Yellow:
Average Red: Catastrophically low |
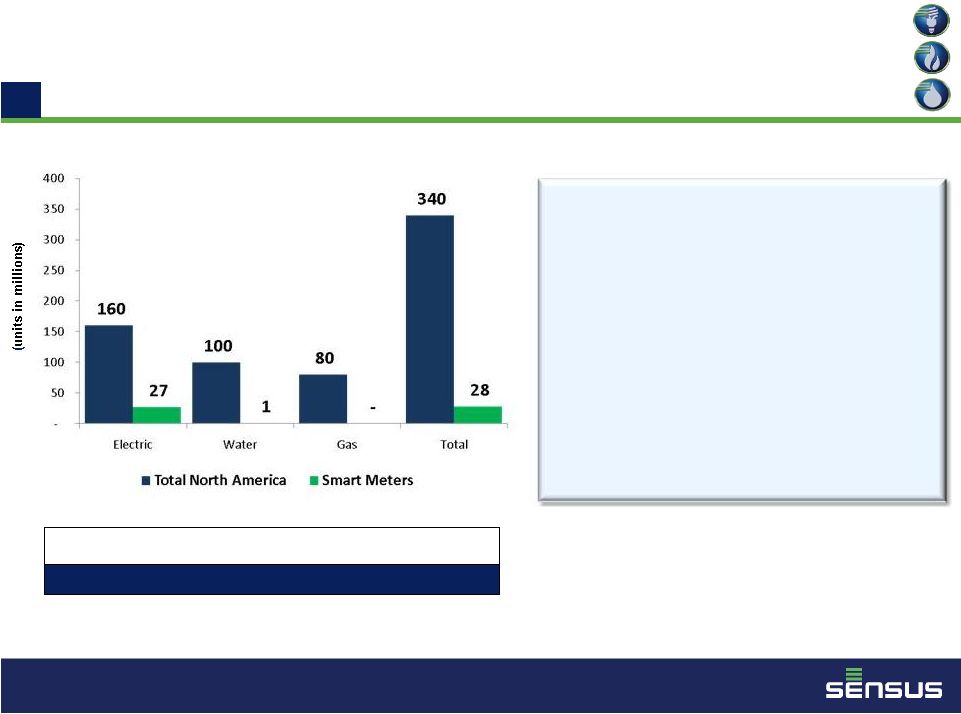 •
Technology transition to Smart
Meters is accelerating
•
Being led by the conversion of the
electric meter installed base
•
Water conversion is underway
•
Estimated that only 28 million of the
340 million meters have been
converted to date
•
2.7 billion global meter installed base
Sources: “The Scott AMR Report: AMR Deployments in North America, 2
Quarter 2010”; IMS Research; and Management estimates.
Global
Meter
Installed
Base
(units
in
millions)
1,277
976
442
2,695
Technology Transition Has Begun
North American Meter Installed Base
12
2
nd |
 13
3
Differentiated Technology Offerings
Sensus, with its differentiated
offering and innovative
technology, is a well positioned
leader of the global utility
technology transformation |
 14
•
Extensive portfolio of advanced metrology products for all utility types
–
iCON
®
-
advanced solid state electric meter
–
iPERL™
-
next generation water measurement technology
–
SONIX
®
-
ultrasonic gas meter
•
Advanced long-range, high-powered radio communications network
–
Protected, primary-use FCC licensed radio spectrum; Reliable for
utilities’ “mission critical”
applications
–
Avoids interference in the crowded public spectrum bands used by
mesh networks
–
Software defined radio enables over-the-air upgrades
•
Distribution Automation devices and software
–
Connects using integrated Sensus communications network
–
Interfaces with utility SCADA system
–
Integrated with all major Distribution Automation equipment manufacturers
•
Smart Grid Lighting
–
Induction lighting and long range radio supervisory control
•
Demand Response and Home Area Network solutions
–
Connect directly to the network or through electric meter via other
communications, e.g. Zigbee •
Fully integrated solution
–
Communications, software, metrology, distribution automation devices, demand
response and Home Area Network solutions
•
Flexible, scalable and adaptable software, network and data solutions delivery
–
Minimizes utility’s financial, operational and technological risk
–
Transforms data into information which can be used for decision support of mission
critical utility functions Sensus’
Differentiated Offering
3 |
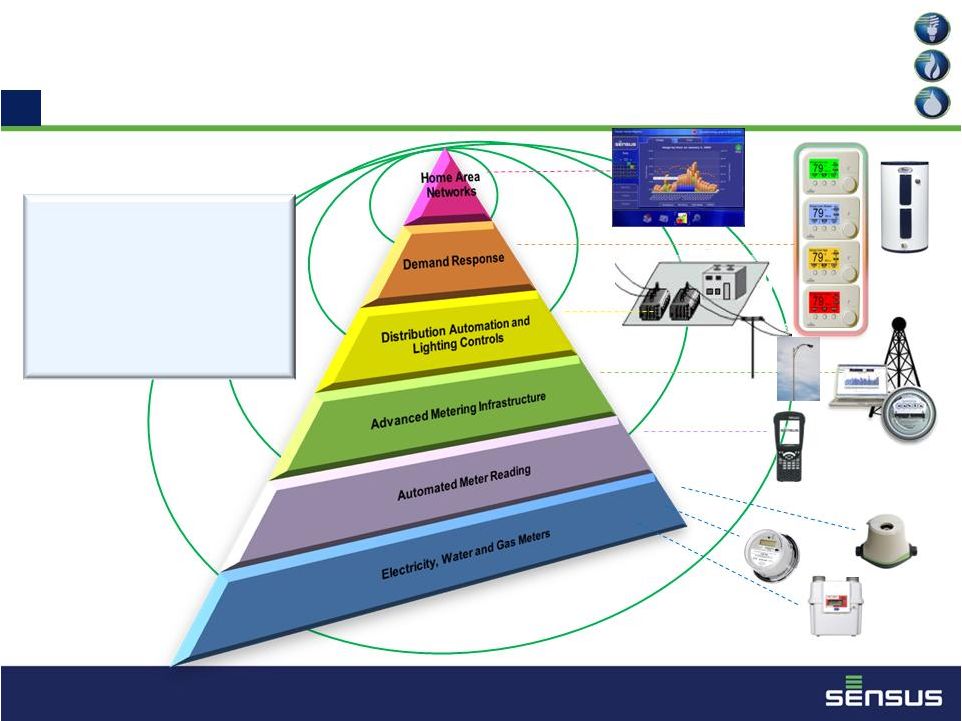 Multiple Needs; One Network
15
3
Critical Infrastructure
Class Network:
•
Dedicated
•
Secure
•
Resilient
•
Universal |
 16
Critical Infrastructure Class Network
Advantages
3
•
Advanced long-range, high-power radio communications technology
–
Deployed
using
a
star-based
“point-to-point”
structure;
not
a
mesh
system
–
Terrain Agnostic --
Cost efficiently covers both urban and rural environments
–
Global
Operability
--
One
technology
works
everywhere
in
the
world
•
Protected, primary-use FCC licensed radio spectrum
–
Eliminates interference inherent in crowded public spectrum bands
•
Software defined radio
–
Enables cost efficient and flexible over-the-air upgradability, unlike a chipset based
radio –
Helps
to
“Future-proof”
the
utility’s
investment
•
Fast, dedicated, application specific communications channels
–
Essential for “mission critical”
applications requiring low latency, e.g. distribution automation
•
Resilient, minimal infrastructure
–
Fully redundant end-to-end architecture. Robust infrastructure to withstand natural
disasters. –
Lowest initial installation and ongoing operating and maintenance costs
•
Advanced security
–
State-of-the-art key encryption at meter level; set at point of manufacture
•
FlexNet™
communications solution can cover all utility applications
–
Metering, distribution automation, demand response, Home Area Networks and emerging
technologies
–
2-way direct communications with battery powered water and gas meters
|
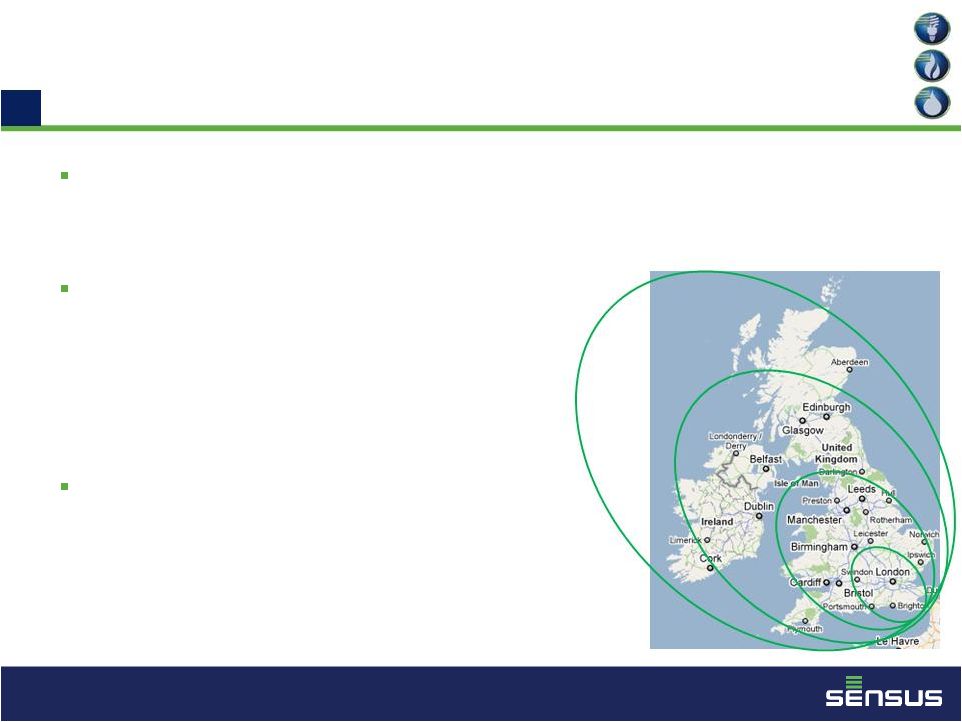 Global Reach, Global Technology
The Sensus
communications network deployed in North America has
now been successfully deployed around the globe
–
Multiple global engagements with utilities and partners
Technology addresses diverse customer needs
–
National scale deployments require a ubiquitous,
critical infrastructure-grade network
–
U.K. Nationwide Smart Metering Initiative -
with
ecosystem partners: Arqiva, BT and Detica
Multiple applications
–
Electric, water, gas and infrastructure control
3
17 |
 18
Sensus is a market leader
building the Smart Grid for
energy and water…today
4
Current Market Leadership |
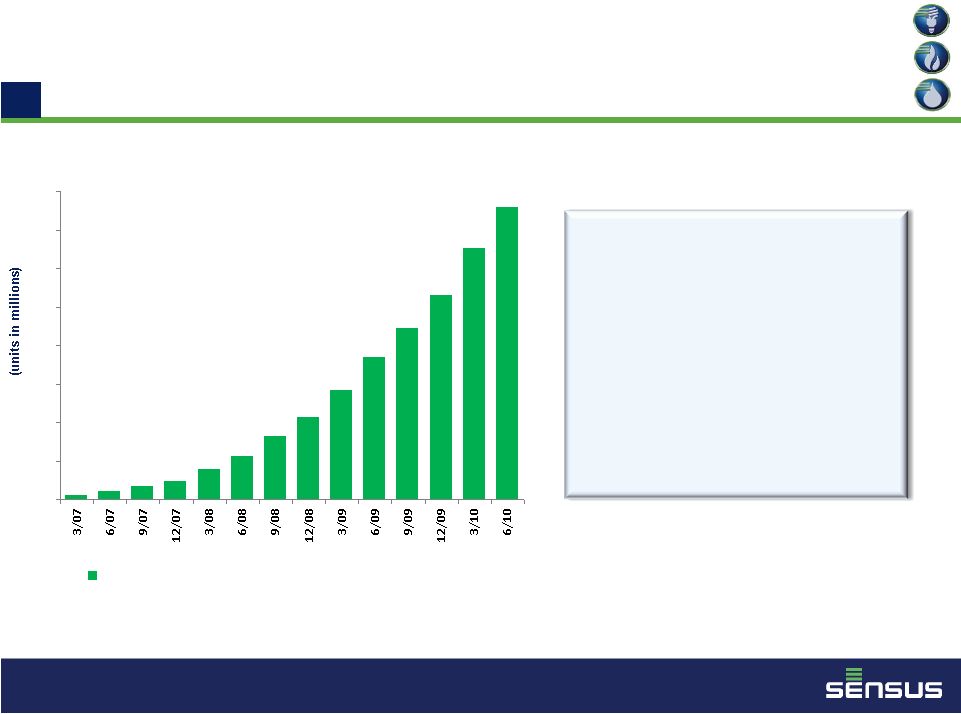 Sensus
Has Rapidly Emerged as a Leader
in N.A. Smart Grid Deployments
Source: The Scott Report: AMR Deployments in North America and Sensus
19
4
0
1
2
3
4
5
6
7
8
Cumulative
SmartPoints
Shipped
(Electric
+
Water
+
Gas)
•
Sensus’ Electric market
share increased from 3%
to 23% in two years
•
Dramatic growth in electric
Sensus SmartPoint™
deployments
•
Water market transitioning
from basic AMR to 2-way
smart metering
|
 NA Smart Grid
Market
Source:
The Scott Report,
2 Quarter 2010
27 million devices
shipped to date
4
20
Source:
The Scott Report,
2 Quarter 2010
5 million meters
shipped annually
Residential and C&I
meters (1-way and 2-way)
NA Electric
Smart Meter/Endpoint Market
(in units)
NA Water
Smart Meter/Endpoint Market
(in units)
nd
nd |
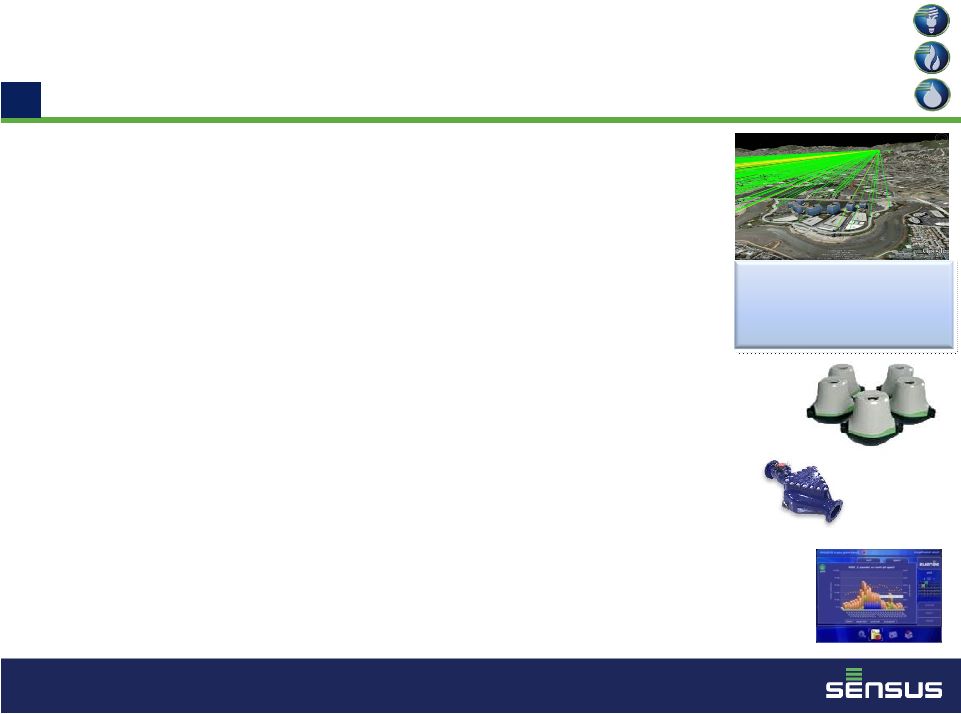 Sensus
is Building the Smart Grid
for Water Today
•
Sensus
is enabling the Smart Grid for Water with innovative
technology
–
Sensus
communications network
–
iPERL™
water management device
–
Distribution Automation for water
–
Leak detection at end point and distribution network
•
Sensus
is building the Smart Grid for water
–
Over 1 million water SmartPoints™
installed over the past 6
quarters
–
Over 100 individual water utility Smart Grid projects completed or
in process
21
4
Critical
Infrastructure
Class Network
-
Dedicated -
Secure
-
Resilient
- Universal
iPERL
System
OMNI F2
Customer
Portal |
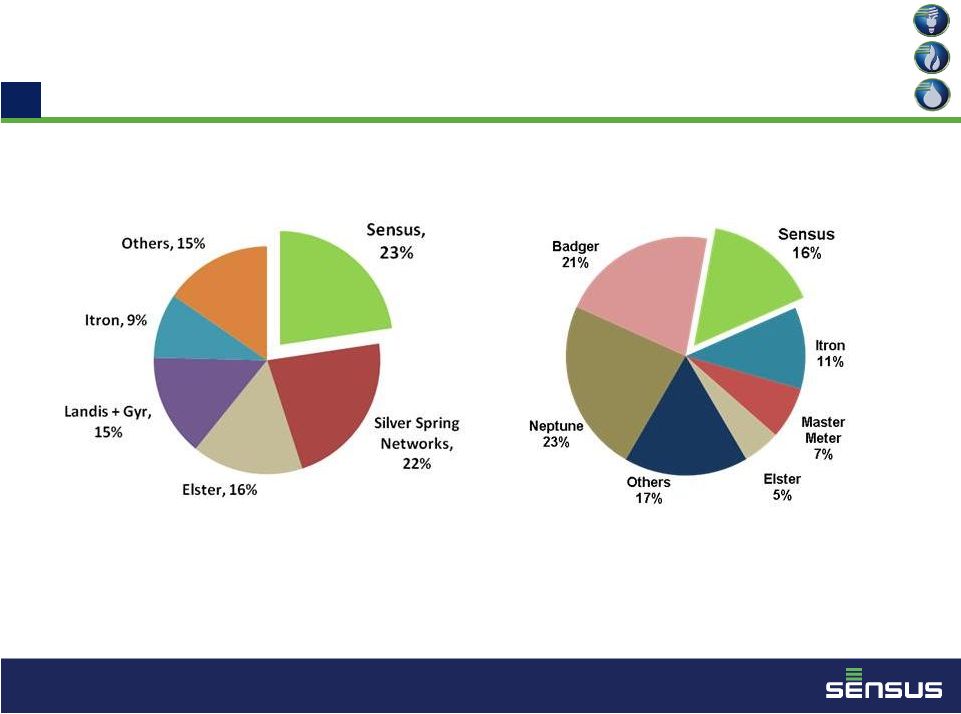
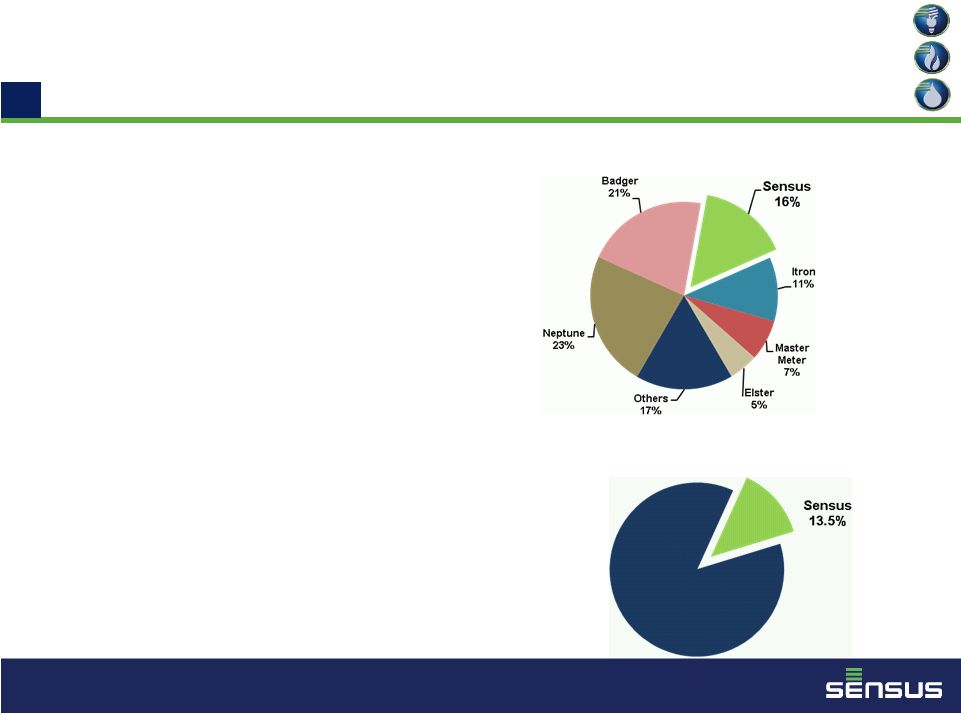 Water
Smart Grid Market •
Sensus
has a #2 market position in the World
Market Share for Advanced Metering
•
Global water market returning to historical
growth rates in excess of GDP
•
Conservation and efficiencies driving new
technology adoption
•
Broad integrated offering for the water smart
grid
–
Point-to-Point communications network
–
Innovative water management devices
–
Distribution automation / Leak detection
•
Extensive metrology offering for regions of the
world preparing for adoption of advanced
technology
•
Well positioned for growth with significant
global water market presence coupled with
advanced technology
North America Share for Water Residential and C&I
Advanced (1-way and 2-way) Meters (units)
Source:
The Scott Report,
2
Quarter 2010
5 million meters
shipped annually
World Residential Water Meter Market Share
-
Excluding China
(units)
Source:
IMS Research 2010
42 million meters
shipped annually
Others
86.5%
4
22
nd |
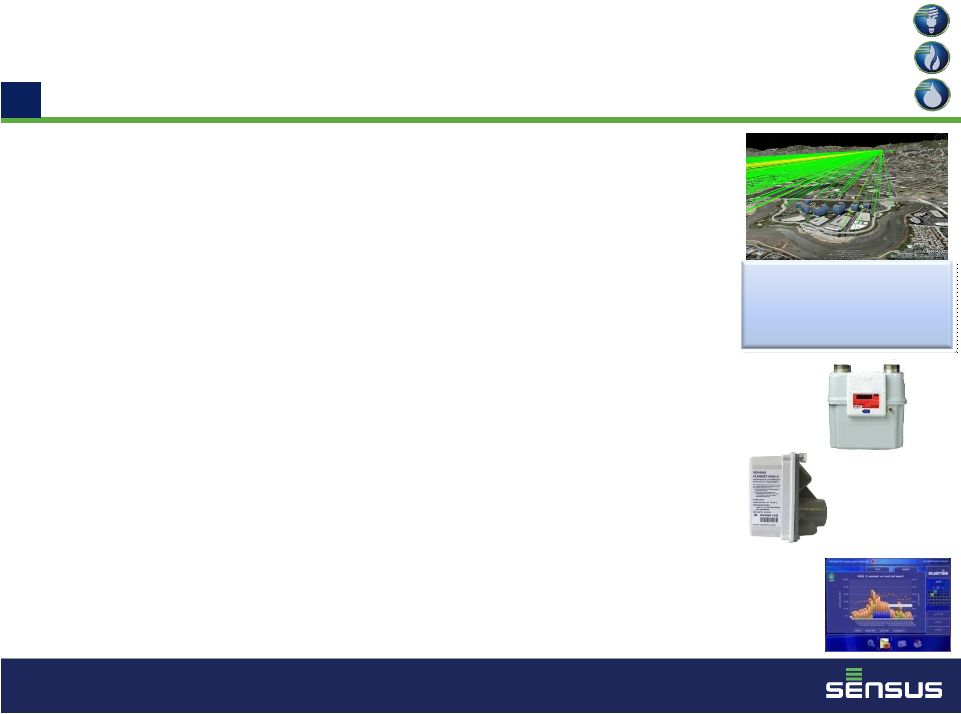 Gas
Smart Grid Drivers are Evolving …Sensus is Poised to Capitalize
•
Pipeline safety is a critical component of the Smart Grid for gas
–
Sensus technology enables utilities to respond to emergency
situations
•
System balancing and financial settlements are key functions
for gas utilities
–
Real-time access to SmartPoint™
data requires critical
infrastructure-class network
•
Sensus provides both the technology and communications that
create a Smart Grid for Gas
–
Sensus communications network
–
Sonix
®
ultrasonic gas meter
–
Sensus Remote Gas Shut-off device
–
Distribution Automation for gas
•
Sensus technology and market presence will lead the Smart
Grid for gas
–
Approximately 80 million gas meters installed in North America
and over 400 million worldwide
Remote
Shut-off
Device
Ultrasonic
Gas Meter
23
4
Customer
Portal
Critical Infrastructure
Class Network
-
Dedicated -
Secure
-
Resilient
- Universal |
 Delivering market-leading
technology will continue to drive
increased profitability
24
5
Strong Financial Performance |
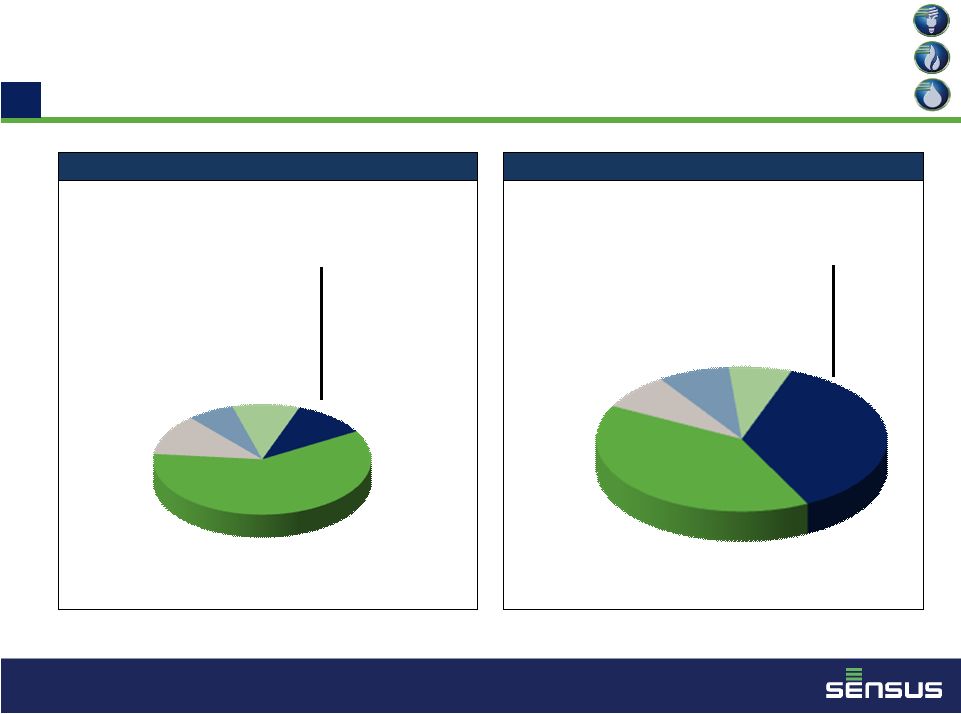 25
5
Evolution of Net Sales
Water Metering
40%
Gas Metering
8%
Precision
Die Casting
8%
Clamps &
Couplings
7%
Water Metering
60%
Gas Metering
12%
Precision
Die Casting
7%
Clamps &
Couplings
10%
Fiscal Year 2004 Net Sales
LTM September 2010 Net Sales
Conservation Solutions
11%
$59M
Conservation Solutions
37%
$324M, up 449%
Net Sales: $529M
Net Sales: $873M
(Fiscal year ended March 31)
Note: Conservation Solutions, Water Metering and Gas Metering make up the
“Utility Infrastructure and Related Communications Systems”
reporting segment. The “All Other”
reporting segment includes Precision Die Casting and Clamps & Couplings.
|
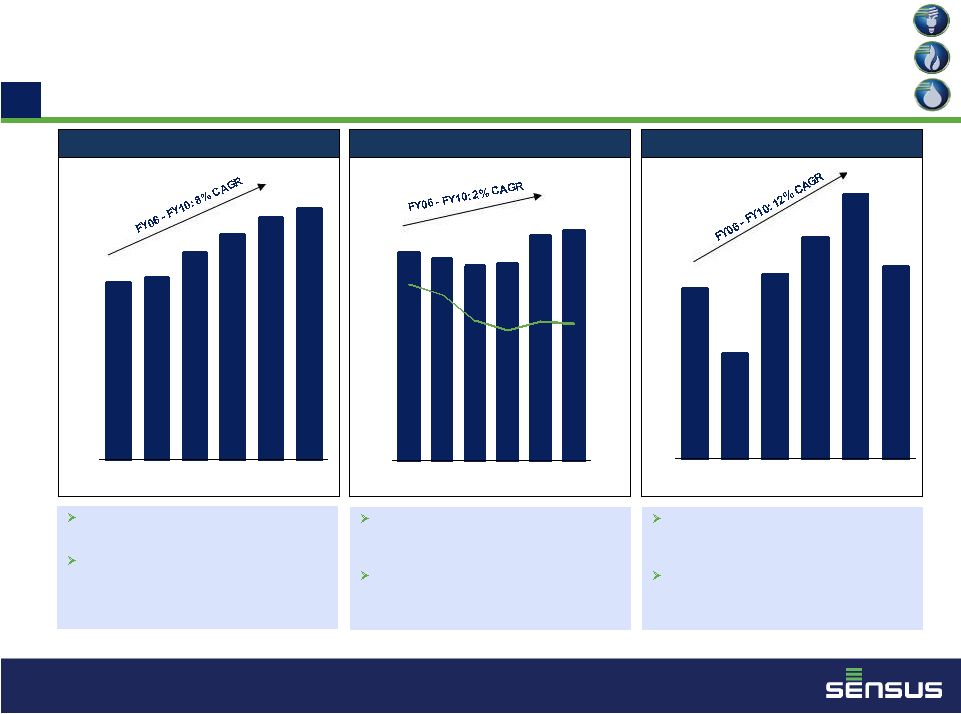 26
5
Financial Track Record
$97
$94
$91
$92
$105
$107
16%
15%
13%
12%
12%
12%
0%
5%
10%
15%
20%
25%
$0
$20
$40
$60
$80
$100
$120
FY
2006
FY
2007
FY
2008
FY
2009
FY
2010
LTM
Sept
$47
$29
$51
$61
$73
$53
$0
$10
$20
$30
$40
$50
$60
$70
$80
FY
2006
FY
2007
FY
2008
FY
2009
FY
2010
LTM
Sept
$614
$631
$722
$784
$844
$873
$0
$100
$200
$300
$400
$500
$600
$700
$800
$900
$1,000
FY
2006
FY
2007
FY
2008
FY
2009
FY
2010
LTM
Sept
Net Sales
(1)
Net cash provided by operating activities as reported in the Company’s SEC filings.
Adjusted EBITDA* improves from 2008 due
to volume and operational leverage and
scale.
R&D investment rate in 2010 increased to
5.3% of net sales as technology is focused
across the Utility Infrastructure Systems
product portfolios.
2008
Sensus
launches
FlexNet™
systems
and enters AMI Electric markets.
2009 revenue traction attained as market
share expands rapidly to 23% with 8 million
SmartPoint™
devices shipped within 3 years.
Fiscal Year Ends March 31 LTM September
2010 (US$ in millions) Adjusted EBITDA *
Operating Cash Flow
(1)
Continued drive on balance sheet efficiency
through working capital initiatives. Days sales
cycle improved over 100% since 2008.
Maintained investments in infrastructure and
software to support market strategies and
commitments.
* See Appendix: Non-GAAP Measure
st |
 Highlights
Leader in NA Electric Smart Grid
metering market
•Sensus
delivered 7 million to date
Leader in the rapidly evolving
Water Smart Grid market
•
Sensus
delivered 1 million to date
Leading market positions in mature
core water and gas metrology
Future revenue visibility
•
Only 27 million smart electric meters installed out
of 160 million North American installed base
•
Global potential to convert 1.3 billion meters
•
Only 1 million smart water meters installed out of
100 million North American installed base
•
Global potential to convert 1 billion meters
•
Established metrology business consistently
delivers Revenue, EBITDA and Cash Flow
•
Annual revenues > $400 million
•
Long-term electric smart grid contracts provide
visibility for future business and revenue
•
Include long-term contracts with the 3 largest North
American electric utilities (by market capitalization)
27
5 |
 Thank You.
For more information visit us at
www.sensus.com |
 29
Appendix
6 |
 30
6
Appendix: Non-GAAP Measure
•
To enhance the comparability and usefulness of its financial
information, the Company provides Adjusted EBITDA to describe
more fully the results of its underlying business.
•
Adjusted
EBITDA
is
defined
as
consolidated
earnings
before
interest
expense, depreciation and amortization, and income taxes
plus (a) restructuring costs, (b) management fees and (c) acquisition-
related costs, and adjusted for other nonrecurring items.
•
Refer to the Company’s press release on Form 8-K filed December
20, 2010 for further discussion of non-GAAP measures.
|
 31
6
Appendix: Non-GAAP Measure
A reconciliation of Adjusted EBITDA:
LTM
FY
FY
FY
FY
FY
Sept
Ended
Ended
Ended
Ended
Ended
(US$ in millions)
9/30/2010
3/31/2010
3/31/2009
3/31/2008
3/31/2007
3/31/2006
Consolidated net loss
$ (11.8)
$ (19.2)
$ (22.2)
$ (6.4)
$ (8.4)
$ (3.2)
Depreciation and amortization
47.1
45.5
46.6
47.7
48.1
42.4
Interest expense, net
45.3
43.6
39.9
41.8
42.4
39.3
Income tax provision (benefit)
3.4
(1.5)
(3.4)
(1.4)
0.5
8.2
Restructuring costs
19.0
25.9
9.9
7.0
8.5
7.2
Management fees
2.8
3.3
3.1
2.6
2.6
2.3
Acquisition-related costs
0.8
1.2
-
-
0.1
-
Loss on debt extinguishment
-
5.9
-
-
-
-
Other non-recurring items
-
-
3.3
-
-
1.1
Goodwill impairment
-
-
14.4
-
-
-
Gain from discontinued operations
-
-
-
-
(0.1)
-
Adjusted EBITDA (excluding discontinued operations)
$ 106.6
$ 104.7
$ 91.6
$ 91.3
$ 93.7
$ 97.3
|