Attached files
| file | filename |
|---|---|
| 8-K - FORM 8-K - PNC FINANCIAL SERVICES GROUP, INC. | d8k.htm |
 The PNC
Financial Services Group, Inc. Morgan Stanley
Financial Services Conference
February 1, 2011
Exhibit 99.1 |
 Cautionary
Statement Regarding Forward-Looking Information and Adjusted Information
This presentation includes “snapshot” information about PNC used by way of
illustration. It is not intended as a full business or financial review and should
be viewed in the context of all of the information made available by PNC in its SEC filings. The presentation also contains forward-looking
statements regarding our outlook or expectations relating to PNC’s future business,
operations, financial condition, financial performance, capital and liquidity levels,
and asset quality. Forward-looking statements are necessarily subject to numerous assumptions, risks and uncertainties, which
change over time.
The forward-looking statements in this presentation are qualified by the factors affecting
forward-looking statements identified in the more detailed Cautionary Statement
included in the Appendix, which is included in the version of the presentation materials posted on our corporate website at
www.pnc.com/investorevents. We provide greater detail regarding some of these factors in
our 2009 Form 10-K and 2010 Form 10-Qs, including in the Risk Factors and Risk
Management sections of those reports, and in our subsequent SEC filings (accessible on the SEC’s website at www.sec.gov
and on or through our corporate website at www.pnc.com/secfilings). We have included web
addresses here and elsewhere in this presentation as inactive textual references
only. Information on these websites is not part of this presentation. Future events or circumstances may change our outlook or expectations and may also affect the
nature of the assumptions, risks and uncertainties to which our forward-looking
statements are subject. The forward-looking statements in this presentation speak only as of the date of this presentation.
We do not assume any duty and do not undertake to update those statements.
In this presentation, we will sometimes refer to adjusted results to help illustrate the
impact of certain types of items, such as our third quarter 2010 gain related to the
sale of PNC Global Investment Servicing Inc. (“GIS”), the acceleration of accretion of the remaining issuance discount on our TARP
preferred stock in connection with the first quarter 2010 redemption of such stock, our fourth
quarter 2009 gain related to BlackRock’s acquisition of Barclays Global Investors
(the “BLK/BGI gain”), our fourth quarter 2008 conforming provision for credit losses for National City, and integration costs
in the 2010 and 2009 periods. This information supplements our results as reported in
accordance with GAAP and should not be viewed in isolation from, or a substitute for,
our GAAP results. We believe that this additional information and the reconciliations we provide may be useful to investors,
analysts, regulators and others as they evaluate the impact of these respective items on our
results for the periods presented due to the extent to which the items are not
indicative of our ongoing operations. We may also provide information on pretax pre-provision earnings (total revenue less
noninterest expense), as we believe that pretax pre-provision earnings, a non-GAAP
measure, is useful as a tool to help evaluate the ability to provide for credit costs
through operations. Where applicable, we provide GAAP reconciliations for such additional information.
In certain discussions, we may also provide information on yields and margins for all
interest-earning assets calculated using net interest income on a
taxable-equivalent basis by increasing the interest income earned on tax-exempt assets
to make it fully equivalent to interest income earned on taxable investments. We
believe this adjustment may be useful when comparing yields and margins for all earning assets. We may also use
annualized, proforma, estimated or third party numbers for illustrative or comparative
purposes only. These may not reflect actual results. This presentation may also include discussion of other non-GAAP financial measures, which,
to the extent not so qualified therein or in the Appendix, is qualified by GAAP
reconciliation information available on our corporate website at www.pnc.com under “About PNC–Investor Relations.”
|
 Today’s
Discussion PNC has a powerful franchise that achieved record
results in 2010
PNC’s businesses have momentum and are
positioned to capture high quality growth
opportunities
PNC is well positioned to navigate the economic
and regulatory environment
PNC Continues to Build a Great Company.
PNC Continues to Build a Great Company. |
 Footprint
covering nearly 1/3 of the U.S. population
Retail
Corporate & Institutional
A leader in serving middle-market
customers and government entities
One of the largest bank-held asset
managers in the U.S.
Asset Management
Residential Mortgage
One of the nation’s largest mortgage
platforms
PNC’s Powerful Franchise
8th
$264 billion
Assets
U.S. Rank¹
Dec. 31, 2010
6,673
2,470
$183 billion
5th
ATMs
5th
Branches
6th
Deposits
(1) Rankings source: SNL DataSource; Banks headquartered in U.S.
CO
TX
KS
OK
BlackRock
A leader in investment management, risk
management and advisory services worldwide
A Powerful
Franchise
and Record
Results |
 2010 Strategic
Highlights Exceptional achievements in a challenging environment
6.0%
9.8%²
Tier 1 common ratio
Diluted EPS
Return on avg assets
Net income
As reported
$4.36
$5.74
.87%
1.28%
$2.4 billion
$3.4 billion
2009
2010
Diluted EPS
Return on avg assets
Net income
As adjusted¹
$3.45
$6.07
.72%
1.25%
$2.0 billion
$3.3 billion
2009
2010
Amounts are as of or for the year ended December 31. (1) 2010 adjusted for the after-tax
gain on the sale of GIS and the impact of the accelerated accretion of the remaining
issuance discount in connection with the redemption of our TARP preferred stock. 2009 adjusted for the
after-tax BLK/BGI gain. Both periods adjusted for after-tax integration costs. Further
information is provided in the Appendix. (2) Estimated. PNC Is Positioned to Deliver
Even Greater Shareholder Value. PNC Is Positioned to Deliver Even Greater Shareholder
Value. A Powerful
Franchise
and Record
Results
Grew our businesses and delivered record net income in 2010
Transitioned to a higher quality balance sheet
Improved our Tier 1 capital ratios to record levels
Implemented the PNC sales and service model
Exceeded our original acquisition-related cost savings target
Actively managed our risk positions toward a moderate profile |
 A Highly
Engaged Team Reflects PNC’s brand attributes of
ease, confidence and achievement
Awarded to 15 companies worldwide
for extraordinary ability to create an
engaged workplace culture
PNC is a two-time winner and the
only U.S. bank to be recognized
“Gallup Great Workplace Award”
Recipient
PNC
PNC
Is
Is
Recognized
Recognized
for
for
Focusing
Focusing
on
on
Employee
Employee
Engagement
Engagement
to
to
Grow
Grow
and Deepen Customer Relationships.
and Deepen Customer Relationships.
A Powerful
Franchise
and Record
Results |
 Serving the
Needs of Consumers and Small Businesses
Well-
Positioned
Businesses
with
Momentum
Virtual Wallet
Mortgage
Credit card
Business banking
Retail
Banking
36%
Asset
Management
Group
Distressed
Assets
Portfolio
7%
6%
12%
7%
Over 5.4 million checking relationships
Nearly 1 million online bill payment users
$212 billion in assets under administration
$108 billion in discretionary assets under management
$10+ billion in 2010 residential mortgage originations
Strong client base
PNC’s 2010 revenue contribution
Residential
Mortgage
Banking
BlackRock
and other
Corporate &
Institutional
Banking
32%
Broad array of innovative products
30 million households in footprint
25% of U.S. investable assets
9.5 million small businesses
50+ Division I colleges and universities
Significant Growth Opportunities
Broker-Dealer
Wealth management
Institutional asset
management
$15.2B
As of or for the year ended December 31, 2010. |
 Strong Momentum
– Retail Banking
Retail Banking
4Q09
4Q10
Checking relationships
Online bill payment active customers
Well-
Positioned
Businesses
with
Momentum
5,390
5,465
4Q09
4Q10
780
977
Most of 2010 client growth occurred in
2H10 following conversions
4Q10 checking relationships up 27,000 in a
typically flat seasonal quarter
Customer engagement scores higher in
2H10 than 1H10
Workplace and University Banking channel
client acquisition up 20% in 2H10 vs. 2H09
In 2H10, opened 10 traditional branches
and 14 instore branches, consolidated 12
branches and increased ATMs by 134 |
 Rethinking the
Consumer Payments Model Choice
Transparency
Simplicity, fairness
Integrated delivery
Helping customers achieve
Help me better
manage my money
Make it easy for me
Help me avoid
mistakes
Make it convenient
for me
Reward me
Help me use credit
wisely
Help me save
Well-
Positioned
Businesses
with
Momentum |
 Connects
credit, debit, rewards Rewards customers for doing more with PNC
Information organized like customers think
Creates best-in-class online / mobile experience across
consumer businesses
+
+
+
Aspiring to Create the Best Payment Account
Plans to deliver a fully-integrated consumer payment experience
Well-
Positioned
Businesses
with
Momentum |
 Strong
Momentum – Asset Management Group
Channel sales
+60%
+60%
2010 vs. 2009
Well-
Positioned
Businesses
with
Momentum
Asset Management Group
Record sales year in 2010, including
60% YoY increase in channel sales, a
strategic focus for PNC
Total assets under administration of
$212 billion, discretionary assets under
management of $108 billion
Net asset flows up $3 billion in 2H10
versus 1H10
Significantly increased frontline talent
with 60% increase in new hires YoY
2010 vs. 2009
New hires |
 Broad
financing expertise Treasury management
Capital markets
Serving the Needs of Businesses
Broad array of products/capabilities
Boarding new relationships
Focused on cross-sell of existing relationships
Capturing opportunities in newly integrated
markets
Significant Growth Opportunities
Deliver all of PNC to client
Focused on the middle market
Relationship oriented, consultative, high-touch
approach
Manage capital on basis of risk-adjusted returns
Go-to-Market Strategy
Retail
Banking
36%
Asset
Management
Group
Distressed
Assets
Portfolio
7%
6%
12%
7%
PNC’s 2010 revenue contribution
Residential
Mortgage
Banking
BlackRock
and other
Corporate &
Institutional
Banking
32%
Harris Williams
Midland
Healthcare
Well-
Positioned
Businesses
with
Momentum
$15.2B
Revenue for the full year 2010. |
  Strong Momentum
– C&IB
Well-
Positioned
Businesses
with
Momentum
Corporate & Institutional Banking sales
New names
$0
$250
$500
$750
$1,000
2007
2008
2009
2010
2010 sales¹
up 19% YoY
Post-conversion,
momentum is building
further; sales up 23% in
2H10 vs. 2H09
New names and cross-sell
both contributing
65%
59%
53%
54%
1,150+ new client names were added
in 2010
-
Represents potential of $250 million
revenue per year at full value
Commercial
Corporate
Asset Based
(1) Excludes Real Estate.
Non-Credit Sales
Credit Sales
53%
35%
12% |
  Strong Momentum
– C&IB
Well-
Positioned
Businesses
with
Momentum
Opportunity to cross-sell into the
Western Market client base is in
process of being realized
For every dollar of cross-sell
revenue that legacy PNC had,
legacy National City had 60 cents
-
Opportunity of $300 million
from up-sell penetration
2010 product sales increased YoY
across the entire client base
-
Treasury Management +4%
-
Capital Markets +44%
-
Equipment Finance +63%
Corporate & Institutional Banking sales
% Non-Credit Sales in Western Markets
Wave 1
Wave 2
46%
45%
39%
53%
52%
51%
47%
57%
20%
25%
30%
35%
40%
45%
50%
55%
60%
65%
1Q09
2Q09
3Q09
4Q09
1Q10
2Q10
3Q10
4Q10
Wave 3
Wave 4
Q1
Q2
Q3
Q4
Q1
Q2
Q3
Q4
2009
2010
“Waves”
refer to timing of branch and customer conversions. |
 Significant
Business to be Captured Market-specific C&IB opportunities
.7x
.6x
.4
x
Tier 1 market baseline average
.4x
Washington D.C., Columbus and
Indianapolis higher than 2009
.5x
Selected tier 1 market as a multiple of baseline
Well-
Positioned
Businesses
with
Momentum
85% of Corporate Banking
relationship managers sold to
a new name in 2010
All relationship managers
cross-sold in 2010
Under-penetrated markets
represent opportunity for new
client acquisition and cross-
selling
Revenue per sales FTE by selected tier 1 market |
 (6)
(5)
(4)
(3)
(2)
(1)
0
1
2
3
4
0%
1%
2%
3%
4%
5%
6%
PNC’s Balance Sheet Is Positioned to
Support Our Clients
PNC Duration
of Equity
(At Quarter End)
Fed Funds
Effective Rate
(At Quarter End)
2007
2008
2009
+3.4%
100 bps increase
(6.0%)¹
100 bps decrease
Effect on NII in 2
year from
gradual interest rate change
over preceding 12 months
Effect on NII in 1
year from
gradual interest rate change
over following 12 months
PNC 4Q10 NII Sensitivity
(2.4%)¹
+0.8%
100 bps decrease
100 bps increase
Q1
Q2
Q3
Q4
2010
(1) Given the inherent limitations in certain of these measurement tools and techniques,
results become less meaningful as interest rates approach zero.
Positioned
to Navigate
the
Environment
Q1
Q3
Q4
Q1
Q2
Q3
Q4
Q1
Q2
Q3
Q4
Q2
st
nd |
 Transitioning
Capital Management Economic capital
Basel I
Migrating to Basel II
Pre-crisis
Post-crisis
Economic capital being integrated
into Basel II
Basel III regulatory capital
requirements to replace Basel I
Basel II and scenario stress testing
Linkage between capital and parent
company liquidity management
Positioned
to Navigate
the
Environment |
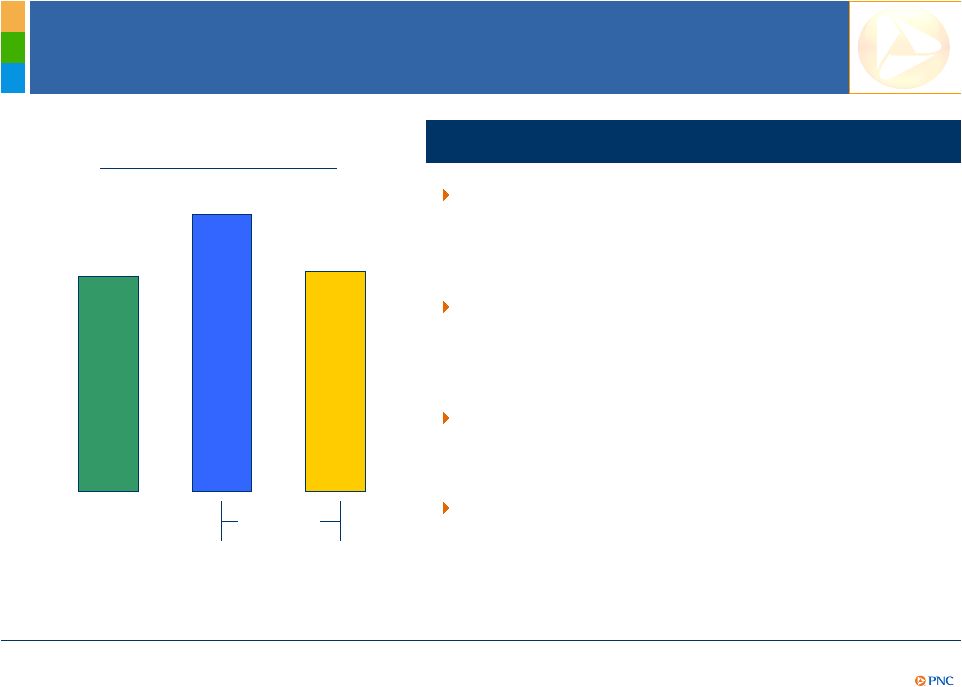 Possible
Impact of Basel III for PNC Tier 1 common ratio¹
9.8%
Under
current
rules
10.0%
Capital management policy considerations for PNC
Basel III limits for Tier 1 common and Tier 1
risk-based will become binding regulatory
constraints when final
PNC has revised internal policies to target near-
term compliance (which assumes immediate
implementation)
Cushion amounts beyond Basel III limits will be
a function of multiple inputs
Issues
such
as
“systemically
important”
have
not
yet been resolved
12.6%
4Q10
Assumes full
Basel III
implementation
and without
benefit of multi-
year phase-in
Proforma
4Q12
Positioned
to Navigate
the
Environment
Ratios are estimated. Proforma assumptions may change. Proforma assumes current common stock
dividend of $.10 per share per quarter and no common stock repurchase. Assumed 2011 net
income of $3.0 billion and 2012 net income of $3.4 billion from First Call mean estimate as of January
21, 2011. The First Call mean estimate is used for illustrative purposes only and does not
necessarily reflect management’s expectations and may not reflect actual results.
Proforma estimates are subject to change depending on final Basel III rules and final regulatory implementation. Basel III
proforma assumptions are based on rules in current form and also include lower deferred tax
assets and subinvestment grade securities at the end of 2012 and the impact of mortgage
servicing rights and the after-tax treatment of our BlackRock investment. |
 Summary
PNC Continues to Build a Great Company.
PNC Continues to Build a Great Company.
PNC has a powerful franchise that achieved record
results in 2010
PNC’s businesses have momentum and are
positioned to capture high quality growth
opportunities
PNC is well positioned to navigate the economic
and regulatory environment |
 Cautionary
Statement Regarding Forward-Looking Information
Appendix
This presentation includes “snapshot” information about PNC used by way of
illustration and is not intended as a full business or financial review. It
should not be viewed in isolation but rather in the context of all of the information made available by PNC in its SEC filings.
We also make statements in this presentation, and we may from time to time make other
statements, regarding our outlook or expectations for earnings, revenues, expenses,
capital levels, liquidity levels, asset quality and/or other matters regarding or affecting PNC that are
forward-looking statements within the meaning of the Private Securities Litigation Reform
Act. Forward-looking statements are typically identified by words such as
“believe,” “plan,” “expect,” “anticipate,” “intend,” “outlook,” “estimate,” “forecast,” “will,” “should,” “project,”
“goal” and other similar words and expressions. Forward-looking statements
are subject to numerous assumptions, risks and uncertainties, which change over time.
Forward-looking statements speak only as of the date they are made. We do not assume any
duty and do not undertake to update our forward-looking statements. Actual
results or future events could differ, possibly materially, from those that we anticipated in our forward-
looking statements, and future results could differ materially from our historical
performance. Our forward-looking statements are subject to the following principal risks and
uncertainties. We provide greater detail regarding some of these factors in our
2009 Form 10-K and 2010 Form 10-Qs, including in the Risk Factors and Risk Management sections of those reports, and
in our subsequent SEC filings. Our forward-looking statements may also be subject to
other risks and uncertainties, including those that we may discuss elsewhere in this
presentation or in our filings with the SEC, accessible on the SEC’s website at www.sec.gov and on or through
our corporate website at www.pnc.com/secfilings. We have included these web addresses as
inactive textual references only. Information on these websites is not part of
this document. •
Our businesses and financial results are affected by business and economic conditions, both
generally and specifically in the principal markets in which we operate. In particular,
our businesses and financial results may be impacted by: o
Changes in interest rates and valuations in the debt, equity and other financial
markets. o
Disruptions in the liquidity and other functioning of financial markets, including such
disruptions in the markets for real estate and other assets commonly securing financial
products. o
Actions by the Federal Reserve and other government agencies, including those that impact
money supply and market interest rates. o
Changes in our customers’, suppliers’ and other counterparties’ performance in
general and their creditworthiness in particular. o
A slowing or failure of the moderate economic recovery that began in mid-2009 and
continued throughout 2010. o
Continued effects of the aftermath of recessionary conditions and the uneven spread of the
positive impacts of the recovery on the economy in general and our customers in
particular, including adverse impact on loan utilization rates as well as delinquencies, defaults
and customer ability to meet credit obligations.
o
Changes in levels of unemployment.
o
Changes in customer preferences and behavior, whether as a result of changing business and
economic conditions, climate-related physical changes or legislative and regulatory
initiatives, or other factors. •
Turbulence in significant portions of the US and global financial markets could impact our
performance, both directly by affecting our revenues and the value of our assets and
liabilities and indirectly by affecting our counterparties and the economy generally.
|
 Cautionary
Statement Regarding Forward-Looking Information
(continued) Appendix
•We will be impacted by the extensive reforms provided for in the Dodd-Frank Wall
Street Reform and Consumer Protection Act (“Dodd-Frank Act”) and ongoing
reforms impacting the financial institution industry generally. Further, as much of the Dodd-Frank Act will require the
adoption of implementing regulations by a number of different regulatory bodies, the precise
nature, extent and timing of many of these reforms and the impact on us is still
uncertain. •Financial industry restructuring in the current environment could also
impact our business and financial performance as a result of changes in the
creditworthiness and performance of our counterparties and by changes in the competitive and regulatory landscape.
•Our results depend on our ability to manage current elevated levels of impaired assets.
•Given current economic and financial market conditions, our forward-looking
financial statements are subject to the risk that these conditions will be
substantially different than we are currently expecting. These statements are based on our current view that the moderate
economic recovery that began in mid-2009 and continued throughout 2010 will slowly gather
enough momentum in 2011 to lower the unemployment rate amidst continued low interest
rates. •Legal and regulatory developments could have an impact on our ability to
operate our businesses or our financial condition or results of operations or our
competitive position or reputation. Reputational impacts, in turn, could affect matters such as business generation and
retention, our ability to attract and retain management, liquidity, and funding. These
legal and regulatory developments could include: o
Changes resulting from legislative and regulatory responses to the current economic and
financial industry environment. o
Other legislative and regulatory reforms, including broad-based restructuring of financial
industry regulation (such as that under the Dodd-Frank Act) as well as changes to
laws and regulations involving tax, pension, bankruptcy, consumer protection, and other aspects
of the financial institution industry.
o
Unfavorable resolution of legal proceedings or other claims and regulatory and other
governmental investigations or other inquiries. In addition to matters relating
to PNC’s business and activities, such matters may also include proceedings, claims, investigations, or
inquiries relating to pre-acquisition business and activities of acquired companies, such
as National City. o
The results of the regulatory examination and supervision process, including our failure to
satisfy the requirements of agreements with governmental agencies.
o
Changes in accounting policies and principles.
o
Changes resulting from legislative and regulatory initiatives relating to climate change that
have or may have a negative impact on our customers’ demand for or use of our
products and services in general and their creditworthiness in particular. o Changes to regulations governing bank capital, including as a
result of the Dodd-Frank Act and of the so-called “Basel III” initiatives.
•Our business and operating results are affected by our ability to identify and
effectively manage risks inherent in our businesses, including, where appropriate,
through the effective use of third-party insurance, derivatives, and capital management techniques, and by our ability to
meet evolving regulatory capital standards.
•The adequacy of our intellectual property protection, and the extent of any costs
associated with obtaining rights in intellectual property claimed by others, can impact
our business and operating results. •Our ability to anticipate and respond to
technological changes can have an impact on our ability to respond to customer needs and to meet
competitive demands.
•Our ability to implement our business initiatives and strategies could affect our
financial performance over the next several years. •Competition can have an impact
on customer acquisition, growth and retention, as well as on our credit spreads and product pricing, which
can affect market share, deposits and revenues.
|
 Cautionary
Statement Regarding Forward-Looking Information
(continued) Appendix
•Our business and operating results can also be affected by widespread disasters,
terrorist activities or international hostilities, either as a result of the impact on
the economy and capital and other financial markets generally or on us or on our customers, suppliers or other counterparties
specifically.
•Also, risks and uncertainties that could affect the results anticipated in
forward-looking statements or from historical performance relating to our equity
interest in BlackRock, Inc. are discussed in more detail in BlackRock’s filings with the SEC, including in the Risk Factors sections of
BlackRock’s reports. BlackRock’s SEC filings are accessible on the SEC’s
website and on or through BlackRock’s website at www.blackrock.com. This material
is referenced for informational purposes only and should not be deemed to constitute a part of this document.
We grow our business in part by acquiring from time to time other financial services
companies. Acquisitions present us with risks in addition to those presented by
the nature of the business acquired. These include risks and uncertainties related both to the acquisition transactions
themselves and to the integration of the acquired businesses into PNC after closing.
Acquisitions may be substantially more expensive to complete (including unanticipated costs
incurred in connection with the integration of the acquired company) and the
anticipated benefits (including anticipated cost savings and strategic gains) may be significantly harder or take longer to
achieve than expected. Acquisitions may involve our entry into new businesses or new
geographic or other markets, and these situations also present risks resulting from our
inexperience in those new areas. As a regulated financial institution, our pursuit of
attractive acquisition opportunities could be negatively impacted due to regulatory delays or other
regulatory issues. In addition, regulatory and/or legal issues relating to the
pre-acquisition operations of an acquired business may cause reputational harm to
PNC following the acquisition and integration of the acquired business into ours and may result in additional future costs or
regulatory limitations arising as a result of those issues.
Any annualized, proforma, estimated, third party or consensus numbers in this presentation are
used for illustrative or comparative purposes only and may not reflect actual
results. Any consensus earnings estimates are calculated based on the earnings projections made by analysts who cover
that company. The analysts’
opinions, estimates or forecasts (and therefore the consensus earnings estimates) are theirs
alone, are not those of PNC or its management, and may not reflect PNC’s or other
company’s actual or anticipated results. |
 Non-GAAP
to GAAP Reconcilement Appendix
In millions except per share data
Adjustments,
pretax
Income taxes
(benefit)¹
Net income
Net income
attributable to
common
shareholders
Diluted EPS
from net
income
Average
Assets
Return on
Avg. Assets
Net income, diluted EPS, and return on avg. assets, as reported
$3,397
$3,011
$5.74
$264,902
1.28%
Adjustments:
Gain on sale of GIS
($639)
$311
(328)
(328)
(.63)
Integration costs
387
(136)
251
251
.48
TARP preferred stock accelerated discount
accretion² 250
.48
Net income, diluted EPS, and return on avg. assets, as adjusted
$3,320
$3,184
$6.07
$264,902
1.25%
In millions except per share data
Adjustments,
pretax
Income taxes
(benefit)¹
Net income
Net income
attributable to
common
shareholders
Diluted EPS
from net
income
Average
Assets
Return on
Avg. Assets
Net income, diluted EPS, and return on avg. assets, as reported
$2,403
$2,003
$4.36
$276,876
0.87%
Adjustments:
Gain on BlackRock/BGI transaction
($1,076)
$389
(687)
(687)
(1.51)
Integration costs
421
(147)
274
274
.60
Net income, diluted EPS, and return on avg. assets, as adjusted
$1,990
$1,590
$3.45
$276,876
0.72%
PNC believes that information adjusted for the impact of certain items may be useful due to
the extent to which the items are not indicative of our ongoing operations. (1)
Calculated
using
a
marginal
federal
income
tax
rate
of
35%
and
includes
applicable
income
tax
adjustments.
The
after-tax
gain
on
the
sale
of
GIS
and
the
after-tax
gain
on the BlackRock/BGI transaction also reflect the impact of state income taxes.
(2) Represents accelerated accretion of the remaining issuance discount on redemption of the
preferred stock in February 2010. For the year ended December 31, 2010
For the year ended December 31, 2009 |
 Peer Group of
Banks Appendix
The PNC Financial Services Group, Inc.
PNC
BB&T Corporation
BBT
Bank of America Corporation
BAC
Capital One Financial, Inc.
COF
Comerica Inc.
CMA
Fifth Third Bancorp
FITB
JPMorgan Chase
JPM
KeyCorp
KEY
M&T Bank
MTB
Regions Financial Corporation
RF
SunTrust Banks, Inc.
STI
U.S. Bancorp
USB
Wells Fargo & Co.
WFC
Ticker |