Attached files
| file | filename |
|---|---|
| 8-K - FORM 8-K - PACCAR INC | d8k.htm |
Exhibit 99.1

|
PACCAR Inc | |||
| Public Affairs Department | ||||
| P.O. Box 1518 | ||||
| Bellevue, WA 98009 | ||||
| Contact: Robin Easton | ||||
| (425) 468-7676 |
FOR IMMEDIATE RELEASE
PACCAR Announces Improved Fourth Quarter Revenues and Net Profit
Company Achieves 72 Consecutive Years of Net Profit
February 1, 2011, Bellevue, Washington – “PACCAR reported improved fourth quarter 2010 revenues and net income compared to the same period in 2009. We are pleased PACCAR earned its 72nd consecutive year of net profit and achieved record shareholders’ equity,” said Mark Pigott, chairman and chief executive officer. “PACCAR’s 2010 financial results reflect the company’s exceptional quality products and services, the benefits of geographic diversification, strong aftermarket revenues, good financial services income and environmental leadership. I am very proud of our 17,700 employees who have delivered outstanding performance to our shareholders and customers.”
“PACCAR’s excellent balance sheet and operating cash flow of $1.55 billion in 2010 have enabled increased capital investments, enhancing manufacturing efficiency as well as development of innovative new products, such as the PACCAR 12.9L MX diesel engine,” said Ron Armstrong, PACCAR president. “The PACCAR MX engine is being installed in approximately 25 percent of Kenworth and Peterbilt vehicles in the U.S. and Canada. The success of PACCAR’s MX engine reflects its industry-leading performance and fuel economy.”
“Global truck markets are expected to improve in 2011, although the negative impact resulting from recent commodity price increases and the cost of installing engine emission equipment will moderate PACCAR’s operating margins. PACCAR will also incur increased expenses due to global business initiatives and the development of new models to enhance its product ranges,” noted Pigott.
Net Income, Revenues and Dividends
PACCAR earned $169.8 million ($.46 per diluted share) for the fourth quarter 2010 compared to $46.1 million ($.13 per diluted share) in the fourth quarter 2009. Fourth quarter net sales and financial service revenues were $3.06 billion compared to $2.24 billion reported for the comparable period in 2009. Net sales and financial service revenues for the full year 2010 were $10.29 billion versus $8.09 billion in 2009. PACCAR reported net income in 2010 of $457.6 million ($1.25 per diluted share) compared to $111.9 million ($.31 per diluted share) in 2009. Net income for the fourth quarter and full year 2010 benefited from a gain on the sale of the company’s Nashville plant of $5.1 million ($3.2 million net of tax) and the favorable effect of recent U.S. tax law changes of $5.0 million.
Cash dividends of $.69 per share, including a fourth quarter special dividend of $.30 per share, were paid during 2010. Total dividends declared in 2010 increased by 28 percent compared to 2009. PACCAR has paid a dividend every year since 1941.
PACCAR Delivers Excellent Shareholder Returns
PACCAR’s total one-year shareholder return was 60.4 percent in 2010. In the last 10 years, PACCAR’s shareholder return has averaged 23.0 percent, compared to the S&P 500 Index return of 1.4 percent. PACCAR’s shareholder return has exceeded the S&P 500 Index return for the previous one-, three-, five-, ten-, and twenty-year time periods.
Operating Highlights – 2010
| • | PACCAR delivered 78,800 vehicles worldwide and introduced five new truck models, including the industry leading Kenworth T700 and Peterbilt Model 587. |
| • | The Peterbilt Model 384 earned the Heavy-Duty Commercial Truck of the Year award. |
| • | Kenworth Trucks ranked highest in the J.D. Power Medium Duty Dealer Service Customer Satisfaction Studysm*. |
| • | The DAF CF85 earned the U.K.’s Motor Transport award for “Fleet Truck of the Year” for an unprecedented third consecutive year and the tenth time in the last seventeen years. |
| • | The DAF LF was awarded the “Best 7.5 Tonne Imported Truck” in Germany. |
| • | Leyland Trucks was honored as the Overall Winner in the annual Manufacturing Excellence Awards. |
| • | Production of the PACCAR MX engine for Kenworth and Peterbilt vehicles commenced at the Columbus, Mississippi factory with 10,000 orders already received. |
| • | PACCAR’s MX engine was honored as the Best Coach Engine for the fourth consecutive time at the Bus World Asia exhibition in Shanghai, China. |
| • | PACCAR has implemented 14,500 Six Sigma projects since 1997. |
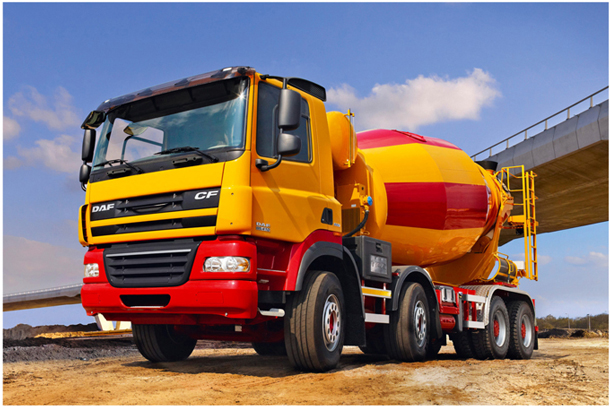
DAF CF85 – U.K. Fleet Truck of the Year in 2010
Financial Highlights – Fourth Quarter 2010
| • | Consolidated sales and revenues of $3.06 billion. |
| • | Net income of $169.8 million. |
| • | Cash generated by operations of $388.6 million. |
| • | Financial Services pretax income of $49.9 million. |
| • | Research and development expenses of $65.4 million. |
| • | Capital expenditures of $52.6 million. |
| • | Manufacturing cash and marketable securities of $2.43 billion at December 31, 2010. |
Financial Highlights – Full Year 2010
| • | Consolidated sales and revenues of $10.29 billion. |
| • | Net income of $457.6 million. |
| • | Cash provided from operations of $1.55 billion. |
| • | Financial Services pretax income of $153.5 million on assets of $7.9 billion. |
| • | Capital expenditures of $168.4 million. |
| • | Research and development expenses of $238.5 million. |
| • | Medium-term note (MTN) issuances of $680 million. |
| • | Record shareholders’ equity of $5.36 billion at December 31, 2010. |
Global Truck Market Update
“Industry sales above 15-tonnes in Western and Central Europe were 183,000 units in 2010, a 9 percent increase compared to 2009,” said Harrie Schippers, DAF president. “In 2010, DAF achieved a market share of 15.2 percent in the above 15-tonne market, the highest share in its 82-year history. DAF is the market share leader in the United Kingdom, Netherlands, and Belgium. DAF is also the market share leader in the Central European above 15-tonne market, which was over 20,000 vehicles in 2010. These achievements reflect DAF’s steady progress towards its medium term goal of 20 percent market share. It is estimated that industry sales in the above 15-tonne truck market in Europe in 2011 will be in a range of 220,000-240,000 units,” said Schippers.
“Class 8 industry retail sales in the U.S. and Canada were 126,000 in 2010 compared to 108,000 in 2009 reflecting the slowly improving economy, which has been negatively impacted by high unemployment and low housing starts,” said Dan Sobic, PACCAR executive vice president. “Our customers’ profitability is benefiting from continued increases in freight rates and volumes. Industry retail sales in 2011 are expected to increase to a range of 180,000-200,000 vehicles, reflecting a continued economic recovery and the need to replace an aging truck population. This projected sales level is still below normal replacement demand of approximately 225,000 units,” added Sobic.
Global Business Opportunities
For over 40 years, PACCAR’s Kenworth vehicles have earned a significant market share in many South American countries west of the Andes. “We are progressing with the planning for the introduction of DAF vehicles in South America. The results of rigorous testing of DAF trucks in South America have been excellent and we are now evaluating potential sites for a DAF factory in Brazil,” said Bob Christensen, PACCAR executive vice president. Brazil is a major truck market
with industry sales above 10-tonnes of 125,000 units in 2010. “The DAF and Kenworth product ranges offer low operating costs, excellent driveability and maneuverability, and the industry-leading PACCAR MX engine. The introduction of DAF’s product range in Brazil is an exciting development which is expected to deliver good sales in the region beginning in 2013,” added Christensen.
DAF plans to open a truck sales office in Moscow, Russia, during the first quarter of 2011. “The above 15-tonne truck market in Russia and the rest of the CIS was over 56,000 units in 2010,” said Ron Bonsen, DAF Director of Marketing and Sales. “The opening of the DAF Moscow office will facilitate DAF’s continued growth in this expanding truck market.”
PACCAR Parts Achieves Strong Performance
PACCAR’s aftermarket parts sales continue to increase in all of its markets. Improving truck utilization and an aging North American truck fleet are generating higher levels of parts and service business. “PACCAR’s aftermarket parts sales in North America and Australia achieved record revenue in 2010,” said Darrin Siver, PACCAR Parts general manager. “PACCAR is a leader in providing aftermarket truck parts utilizing 14 strategically located parts distribution centers supported by over 1,900 DAF, Kenworth and Peterbilt dealer locations. A new distribution center was opened in Santiago, Chile in December 2010 to support Kenworth and DAF customers in South America.”
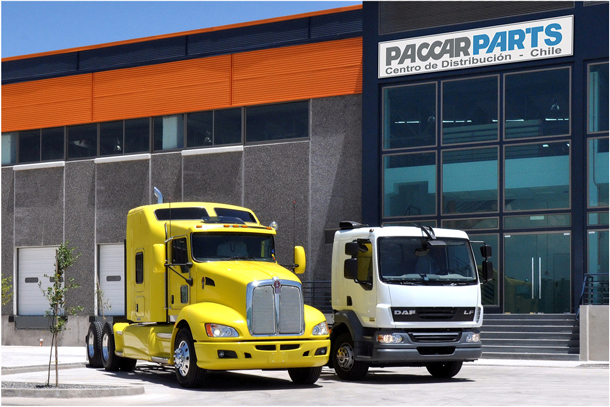
PACCAR’s new Parts Distribution Center in Santiago, Chile
Increased Capital Investments and New Product Launches
In 2010, capital expenditures of $168.4 million and research and development expenses of $238.5 million were invested in new PACCAR products. PACCAR is increasing capital investments in 2011 to accelerate comprehensive product development programs. “Capital expenditures are projected to be $400-$500 million and research and development expenses are estimated at $250-$300 million in 2011 as Kenworth, Peterbilt and DAF invest in industry-leading products and services to enable our customers to continue to deliver profitable results in their businesses,” said Tom Plimpton, PACCAR vice chairman.
Significant product launches in 2010 include:
| • | PACCAR introduced the PACCAR MX engine for installation in Kenworth and Peterbilt trucks. Engine production at PACCAR’s new state-of-the-art manufacturing facility in Columbus, Mississippi began in June. |
| • | Kenworth introduced the new EPA SmartWay® certified Model T700. Kenworth also launched the medium-duty T440, offering excellent productivity and fuel efficiency to regional delivery and vocational customers. |
| • | Peterbilt launched the EPA SmartWay® certified Model 587, a dynamic successor to the highly successful Model 387. Peterbilt announced the availability of the Model 320 Hybrid Class 8 refuse truck that utilizes Hydraulic Launch Assist (HLA) technology and the Model 382 for regional and shorter-haul applications. |
Environmental Leadership
“PACCAR is the industry leader in the development of environmentally friendly technologies,” shared Craig Brewster, PACCAR vice president. “In 2010, Leyland Trucks earned the “Green Business Award for Waste Reduction and Recycling.” The award was presented by ENDS, the specialist environmental publishers, and Management Today, the United Kingdom’s leading monthly business magazine.
Other environmental highlights for 2010 include:
| • | The DAF LF Hybrid began production in the fourth quarter and is initially available in the United Kingdom, the Netherlands, Germany, France and Belgium. The commencement of production follows two years of extensive field tests across a range of diverse applications in the United Kingdom and Continental Europe. |
| • | PACCAR’s medium-duty hybrid-electric vehicles can achieve up to 30% fuel efficiency improvement. Kenworth and Peterbilt delivered 325 hybrid vehicles in 2010. |
| • | DAF is recirculating 30 percent of its thermal energy to reduce water-heating costs in its manufacturing facilities. |
| • | Many PACCAR truck manufacturing plants in the U.S. and Europe have achieved “Zero Waste to Landfill” and all PACCAR manufacturing facilities are ISO 14001 environmentally certified. |
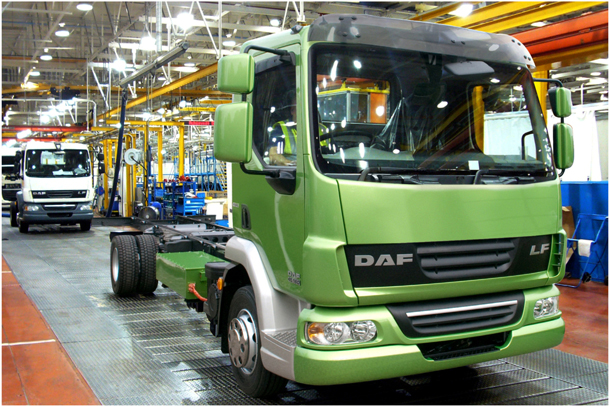
DAF LF Diesel Electric Hybrid
Financial Services Companies Achieve Good Results
PACCAR Financial Services (PFS) finances a portfolio of over 133,000 trucks and trailers, with total assets of $7.9 billion. PACCAR Leasing, a major full-service truck leasing company in North America and Europe with a fleet of over 31,000 vehicles, is included in this segment. “During the fourth quarter and full-year 2010, profit increased due to better finance margins and improved portfolio performance,” said Bob Bengston, PACCAR vice president. Fourth quarter pretax income was $49.9 million compared to the $35.6 million earned in the fourth quarter of 2009. Fourth quarter revenues were $243.8 million compared to $254.9 million in the same quarter of 2009. The provision for credit losses was $12.6 million in the fourth quarter of 2010, compared to $23.7 million in the fourth quarter of 2009. For the full year, revenues were $967.8 million compared to $1.01 billion in 2009 and pretax income was $153.5 million in 2010 compared to $84.6 million a year ago.
“PACCAR’s excellent balance sheet, complemented by its A+/A1 credit ratings, enables PFS to offer competitive retail financing to Kenworth, Peterbilt and DAF dealers and customers in 20 countries on three continents,” said Tim Henebry, PACCAR Financial president. “Higher freight volumes and increasing freight rates have improved our customers’ profitability leading to lower past dues and provisions for credit losses. Used truck prices continue to improve from prior year levels by 10-15 percent.”
PACCAR Financial had excellent access to the debt markets in 2010, issuing $680 million in three- and five-year term notes during the year. “PACCAR’s access to the debt markets resulted from PACCAR’s consistent profitability, good cash flow and strong balance sheet,” Henebry added. “PFS borrows at excellent rates which gives our customers a competitive advantage.”
PACCAR is a global technology leader in the design, manufacture and customer support of high-quality light- medium-, and heavy-duty trucks under the Kenworth, Peterbilt and DAF nameplates. PACCAR also designs and manufactures advanced diesel engines and provides financial services and information technology and distributes truck parts related to its principal business. PACCAR shares are traded on the NASDAQ Global Select Market, symbol PCAR. Its homepage is www.paccar.com.
PACCAR will hold a conference call with securities analysts to discuss fourth quarter earnings on February 1, 2011, at 9:00 a.m. Pacific time. Interested parties may listen to the call by selecting “Live Webcast” at PACCAR’s homepage. The Webcast will be available on a recorded basis through February 8, 2011.
This release contains “forward-looking statements” within the meaning of the Private Securities Litigation Reform Act. These statements are based on management’s current expectations and are subject to uncertainty and changes in circumstances. Actual results may differ materially from those included in these statements due to a variety of factors. More information about these factors is contained in PACCAR’s filings with the Securities and Exchange Commission.
| * | J.D. Power and Associates 2010 Medium-Duty Truck Customer Satisfaction Studysm. For more information please go to www.jdpower.com. |
# # #
PACCAR Inc
SUMMARY INCOME STATEMENTS
(in millions except per share amounts)
| Three Months Ended | Twelve Months Ended | |||||||||||||||
| December 31 | December 31 | |||||||||||||||
| 2010 | 2009 | 2010 | 2009 | |||||||||||||
| Truck and Other: |
||||||||||||||||
| Net sales and revenues |
$ | 2,811.8 | $ | 1,985.5 | $ | 9,325.1 | $ | 7,076.7 | ||||||||
| Cost of sales and revenues |
2,456.9 | 1,783.0 | 8,198.8 | 6,483.4 | ||||||||||||
| Research and development |
65.4 | 50.7 | 238.5 | 199.2 | ||||||||||||
| Selling, general and administrative |
107.1 | 93.4 | 392.8 | 348.4 | ||||||||||||
| Curtailment gain |
(66.0 | ) | ||||||||||||||
| Interest and other expense, net (a) |
.2 | 4.8 | 9.3 | 43.6 | ||||||||||||
| Truck and Other Income Before Income Taxes |
182.2 | 53.6 | 485.7 | 68.1 | ||||||||||||
| Financial Services: |
||||||||||||||||
| Revenues |
243.8 | 254.9 | 967.8 | 1,009.8 | ||||||||||||
| Interest and other |
158.5 | 172.8 | 657.4 | 734.3 | ||||||||||||
| Selling, general and administrative |
22.8 | 22.8 | 88.7 | 86.5 | ||||||||||||
| Provision for losses on receivables |
12.6 | 23.7 | 68.2 | 104.4 | ||||||||||||
| Financial Services Income Before Income Taxes |
49.9 | 35.6 | 153.5 | 84.6 | ||||||||||||
| Investment income |
6.8 | 4.5 | 21.1 | 22.3 | ||||||||||||
| Total Income Before Income Taxes |
238.9 | 93.7 | 660.3 | 175.0 | ||||||||||||
| Income taxes |
69.1 | 47.6 | 202.7 | 63.1 | ||||||||||||
| Net Income |
$ | 169.8 | $ | 46.1 | $ | 457.6 | $ | 111.9 | ||||||||
| Net Income Per Share: |
||||||||||||||||
| Basic |
$ | .46 | $ | .13 | $ | 1.25 | $ | .31 | ||||||||
| Diluted |
$ | .46 | $ | .13 | $ | 1.25 | $ | .31 | ||||||||
| Weighted Average Shares Outstanding: |
||||||||||||||||
| Basic |
365.4 | 364.3 | 365.0 | 363.8 | ||||||||||||
| Diluted |
366.9 | 365.4 | 366.2 | 364.9 | ||||||||||||
| Dividends declared per share |
$ | .42 | $ | .09 | $ | .69 | $ | .54 | ||||||||
| (a) | For the three and twelve months ended December 31, 2010, Truck and Other “Interest and other expense, net” includes a gain on sale of the company’s Nashville plant of $5.1 ($3.2 net of tax). |
PACCAR Inc
CONDENSED BALANCE SHEETS
(in millions)
| December 31 2010 |
December 31 2009 |
|||||||
| ASSETS |
||||||||
| Truck and Other: |
||||||||
| Cash and marketable debt securities |
$ | 2,432.5 | $ | 2,056.0 | ||||
| Trade and other receivables, net |
610.4 | 554.7 | ||||||
| Inventories |
534.0 | 632.1 | ||||||
| Property, plant, and equipment, net |
1,673.7 | 1,757.7 | ||||||
| Equipment on operating lease and other |
1,105.3 | 1,137.2 | ||||||
| Financial Services Assets |
7,878.2 | 8,431.3 | ||||||
| $ | 14,234.1 | $ | 14,569.0 | |||||
| LIABILITIES AND STOCKHOLDERS’ EQUITY |
||||||||
| Truck and Other: |
||||||||
| Accounts payable, deferred revenues and other |
$ | 2,634.1 | $ | 2,442.5 | ||||
| Long-term debt |
150.0 | 172.3 | ||||||
| Financial Services Liabilities |
6,092.2 | 6,850.5 | ||||||
| STOCKHOLDERS’ EQUITY |
5,357.8 | 5,103.7 | ||||||
| $ | 14,234.1 | $ | 14,569.0 | |||||
| Common Shares Outstanding |
365.3 | 364.4 | ||||||
| GEOGRAPHIC REVENUE DATA
|
| |||||||||||||||
| Three Months Ended | Twelve Months Ended | |||||||||||||||
| December 31 | December 31 | |||||||||||||||
| 2010 | 2009 | 2010 | 2009 | |||||||||||||
| United States and Canada |
$ | 1,324.1 | $ | 1,172.0 | $ | 4,998.9 | $ | 4,156.6 | ||||||||
| Europe |
1,138.7 | 749.3 | 3,472.3 | 2,828.3 | ||||||||||||
| Other |
592.8 | 319.1 | 1,821.7 | 1,101.6 | ||||||||||||
| $ | 3,055.6 | $ | 2,240.4 | $ | 10,292.9 | $ | 8,086.5 | |||||||||
PACCAR Inc
CONDENSED CASH FLOW STATEMENTS
(in millions of dollars)
| Twelve Months Ended December 31 |
2010 | 2009 | ||||||
| OPERATING ACTIVITIES: |
||||||||
| Net income |
$ | 457.6 | $ | 111.9 | ||||
| Depreciation and amortization: |
||||||||
| Property, plant and equipment |
189.9 | 188.0 | ||||||
| Equipment on operating leases and other |
426.1 | 450.1 | ||||||
| Net (increase) decrease in wholesale receivables on new trucks |
(1.1 | ) | 641.8 | |||||
| Net decrease in sales-type finance leases and dealer direct loans on new trucks |
67.1 | 81.6 | ||||||
| All other operating activities |
411.8 | (100.1 | ) | |||||
| Net Cash Provided by Operating Activities |
1,551.4 | 1,373.3 | ||||||
| INVESTING ACTIVITIES: |
||||||||
| Acquisition of property, plant and equipment |
(168.4 | ) | (127.7 | ) | ||||
| Acquisition of equipment for operating leases |
(715.4 | ) | (843.3 | ) | ||||
| Net decrease in financial services receivables |
393.5 | 1,006.8 | ||||||
| Net increase in marketable securities |
(233.7 | ) | (42.8 | ) | ||||
| All other investing activities |
256.9 | 317.6 | ||||||
| Net Cash (Used in) Provided by Investing Activities |
(467.1 | ) | 310.6 | |||||
| FINANCING ACTIVITIES: |
||||||||
| Cash dividends paid |
(251.7 | ) | (232.1 | ) | ||||
| Stock compensation transactions |
22.0 | 17.6 | ||||||
| Net decrease in debt |
(730.7 | ) | (1,601.7 | ) | ||||
| Net Cash Used in Financing Activities |
(960.4 | ) | (1,816.2 | ) | ||||
| Effect of exchange rate changes on cash |
4.9 | 89.1 | ||||||
| Net Increase (Decrease) in Cash and Cash Equivalents |
128.8 | (43.2 | ) | |||||
| Cash and cash equivalents at beginning of period |
1,912.0 | 1,955.2 | ||||||
| Cash and cash equivalents at end of period |
$ | 2,040.8 | $ | 1,912.0 | ||||