Attached files
| file | filename |
|---|---|
| EX-99.1 - EX-99.1 - Forestar Group Inc. | d79392exv99w1.htm |
| 8-K - FORM 8-K - Forestar Group Inc. | d79392e8vk.htm |
Exhibit 99.2
| 1 Fourth Quarter and Full Year 2010 Financial Results February 2, 2011 |
| 2 Forward Looking Statements This presentation contains "forward-looking statements" within the meaning of the federal securities laws. These statements reflect management's current views with respect to future events and are subject to risk and uncertainties. We note that a variety of factors and uncertainties could cause our actual results to differ significantly from the results discussed in the forward-looking statements. Factors and uncertainties that might cause such differences include, but are not limited to: general economic, market, or business conditions; the opportunities (or lack thereof) that may be presented to us and that we may pursue; fluctuations in costs and expenses including development costs; demand for new housing, including impacts from mortgage credit availability; lengthy and uncertain entitlement processes; cyclicality of our businesses; accuracy of accounting assumptions; competitive actions by other companies; changes in laws or regulations; and other factors, many of which are beyond our control. Except as required by law, we expressly disclaim any obligation to publicly revise any forward- looking statements contained in this presentation to reflect the occurrence of events after the date of this presentation. |
| 3 3 Strategy and Initiative Execution Have Forestar Well Positioned Financials2010 HighlightsBusiness Performance Positioned For The Future |
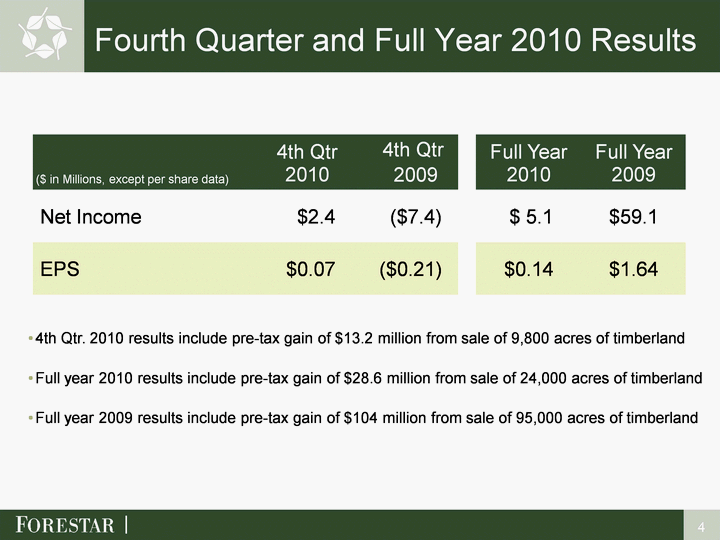
| 4 Fourth Quarter and Full Year 2010 Results Fourth Quarter and Full Year 2010 Results 4th Qtr. 2010 results include pre-tax gain of $13.2 million from sale of 9,800 acres of timberlandFull year 2010 results include pre-tax gain of $28.6 million from sale of 24,000 acres of timberlandFull year 2009 results include pre-tax gain of $104 million from sale of 95,000 acres of timberland |
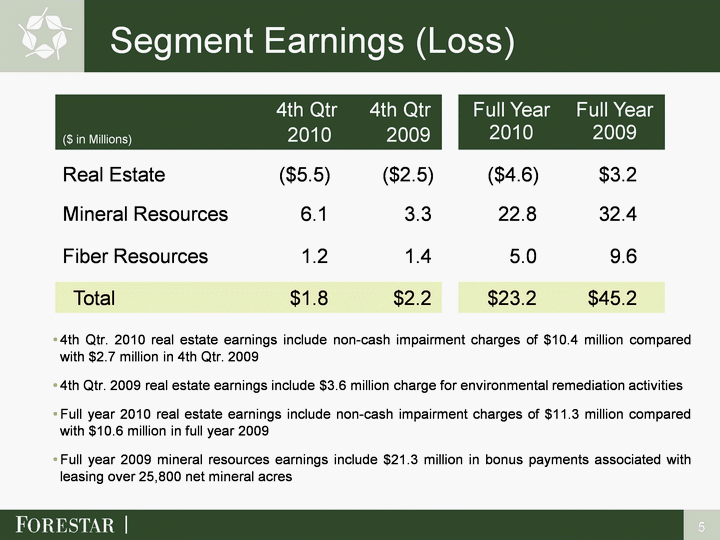
| 5 Segment Earnings (Loss) 4th Qtr. 2010 real estate earnings include non-cash impairment charges of $10.4 million compared with $2.7 million in 4th Qtr. 20094th Qtr. 2009 real estate earnings include $3.6 million charge for environmental remediation activities Full year 2010 real estate earnings include non-cash impairment charges of $11.3 million compared with $10.6 million in full year 2009Full year 2009 mineral resources earnings include $21.3 million in bonus payments associated with leasing over 25,800 net mineral acres leasing over 25,800 net mineral acres leasing over 25,800 net mineral acres leasing over 25,800 net mineral acres leasing over 25,800 net mineral acres leasing over 25,800 net mineral acres leasing over 25,800 net mineral acres leasing over 25,800 net mineral acres |
| Recognize and Responsibly Deliver the Greatest Value From Every Acre 6 |
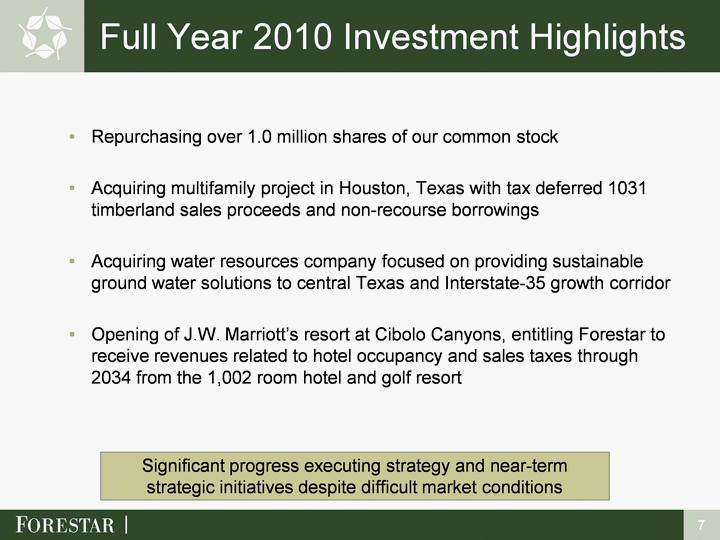
| Full Year 2010 Investment Highlights Repurchasing over 1.0 million shares of our common stockAcquiring multifamily project in Houston, Texas with tax deferred 1031 timberland sales proceeds and non-recourse borrowingsAcquiring water resources company focused on providing sustainable ground water solutions to central Texas and Interstate-35 growth corridorOpening of J.W. Marriott's resort at Cibolo Canyons, entitling Forestar to receive revenues related to hotel occupancy and sales taxes through 2034 from the 1,002 room hotel and golf resort Significant progress executing strategy and near-term strategic initiatives despite difficult market conditions 7 |
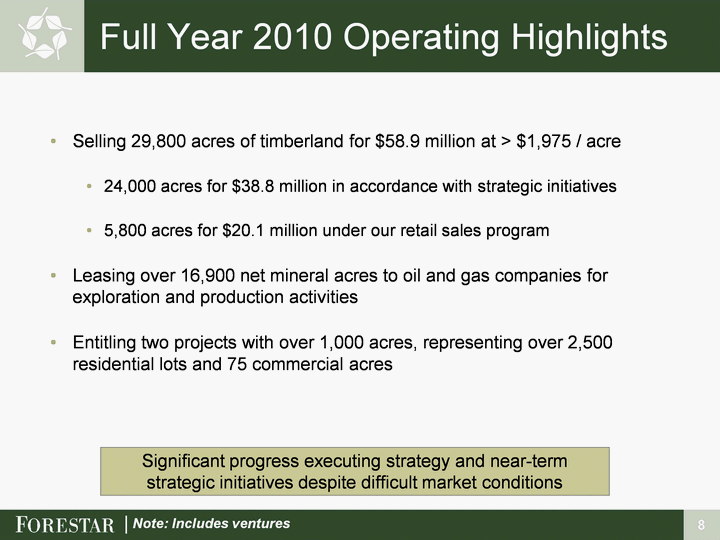
| Full Year 2010 Operating Highlights Selling 29,800 acres of timberland for $58.9 million at > $1,975 / acre 24,000 acres for $38.8 million in accordance with strategic initiatives5,800 acres for $20.1 million under our retail sales programLeasing over 16,900 net mineral acres to oil and gas companies for exploration and production activitiesEntitling two projects with over 1,000 acres, representing over 2,500 residential lots and 75 commercial acres Significant progress executing strategy and near-term strategic initiatives despite difficult market conditions Note: Includes ventures 8 |
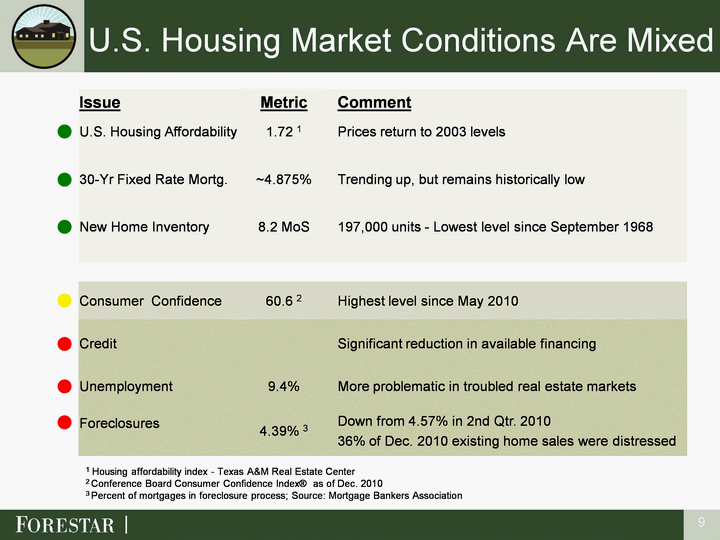
| U.S. Housing Market Conditions Are Mixed Issue Metric Comment U.S. Housing Affordability 1.72 1 Prices return to 2003 levels 30-Yr Fixed Rate Mortg. ~4.875% Trending up, but remains historically low New Home Inventory 8.2 MoS 197,000 units - Lowest level since September 1968 Consumer Confidence 60.6 2 Highest level since May 2010 Credit Significant reduction in available financing Unemployment 9.4% More problematic in troubled real estate markets Foreclosures 4.39% 3 Down from 4.57% in 2nd Qtr. 201036% of Dec. 2010 existing home sales were distressed 1 Housing affordability index - Texas A&M Real Estate Center 2 Conference Board Consumer Confidence Index(r) as of Dec. 2010 3 Percent of mortgages in foreclosure process; Source: Mortgage Bankers Association 9 |
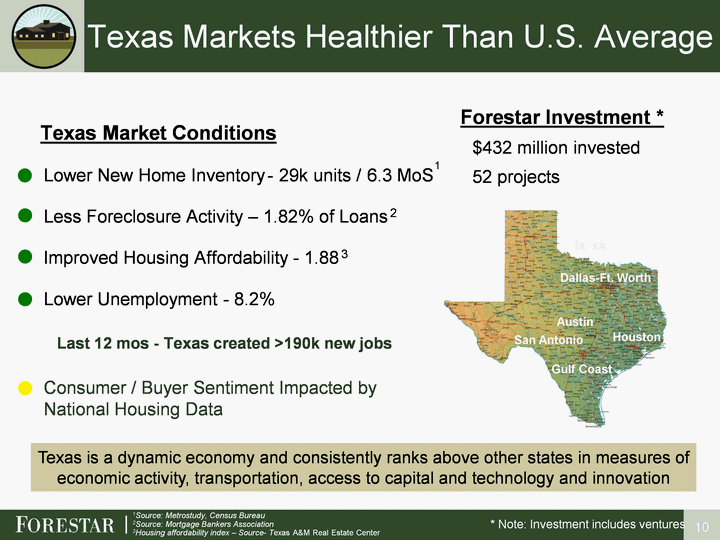
| Texas Markets Healthier Than U.S. Average Texas Market ConditionsLower New Home Inventory - 29k units / 6.3 MoSLess Foreclosure Activity - 1.82% of Loans 2Improved Housing Affordability - 1.88 3Lower Unemployment - 8.2% Last 12 mos - Texas created >190k new jobsConsumer / Buyer Sentiment Impacted by National Housing Data 10 Texas is a dynamic economy and consistently ranks above other states in measures of economic activity, transportation, access to capital and technology and innovation * Note: Investment includes ventures Forestar Investment * $432 million invested 52 projects Dallas Houston San Antonio Austin Gulf Coast Dallas-Ft. Worth 1Source: Metrostudy, Census Bureau2Source: Mortgage Bankers Association3Housing affordability index - Source- Texas A&M Real Estate Center 1 |
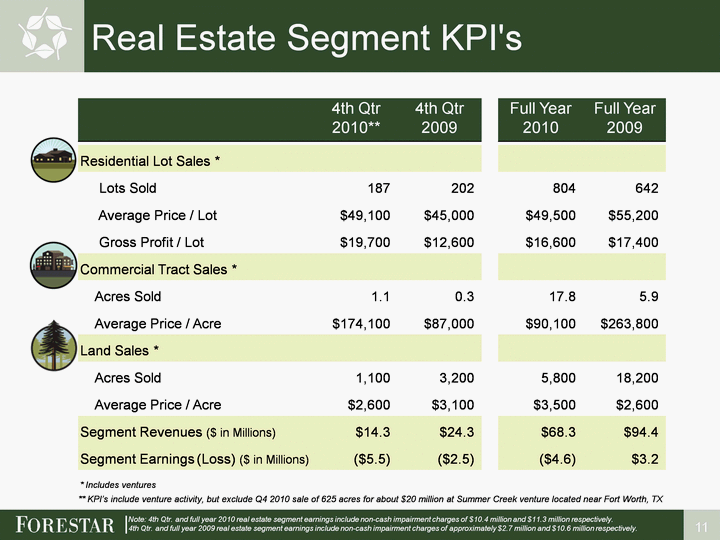
| 11 Real Estate Segment KPI's Real Estate Segment KPI's Note: 4th Qtr. and full year 2010 real estate segment earnings include non-cash impairment charges of $10.4 million and $11.3 million respectively. 4th Qtr. and full year 2009 real estate segment earnings include non-cash impairment charges of approximately $2.7 million and $10.6 million respectively. ** KPI's include venture activity, but exclude Q4 2010 sale of 625 acres for about $20 million at Summer Creek venture located near Fort Worth, TX * Includes ventures |
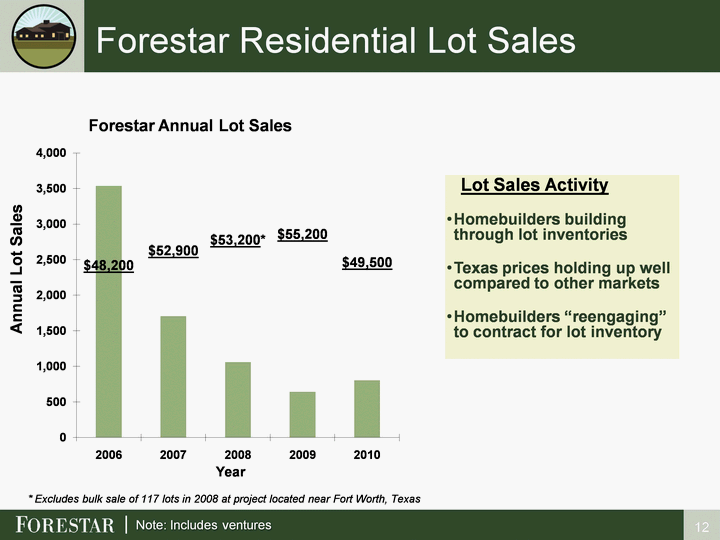
| Forestar Residential Lot Sales 12 Note: Includes ventures * Excludes bulk sale of 117 lots in 2008 at project located near Fort Worth, Texas (CHART) Annual Lot Sales Lot Sales ActivityHomebuilders building through lot inventoriesTexas prices holding up well compared to other marketsHomebuilders "reengaging" to contract for lot inventory Year |
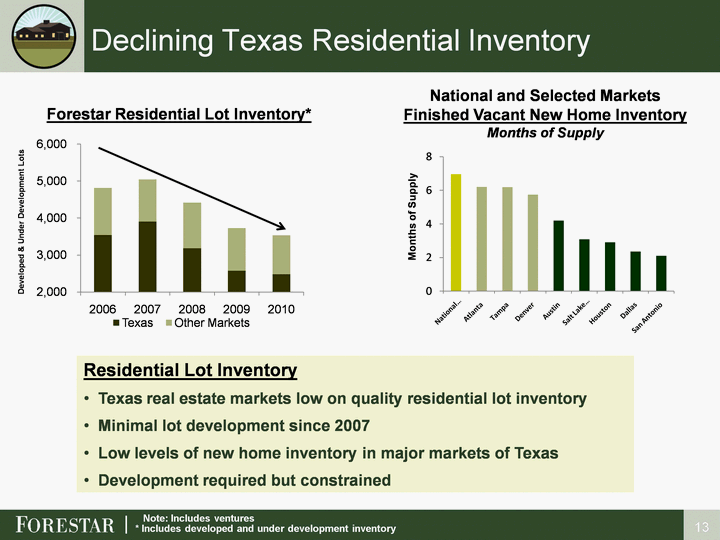
| Declining Texas Residential Inventory Declining Texas Residential Inventory 13 Forestar Residential Lot Inventory* * Includes developed and under development inventory Residential Lot InventoryTexas real estate markets low on quality residential lot inventoryMinimal lot development since 2007Low levels of new home inventory in major markets of TexasDevelopment required but constrained National and Selected MarketsFinished Vacant New Home InventoryMonths of Supply (CHART) Note: Includes ventures Months of Supply |
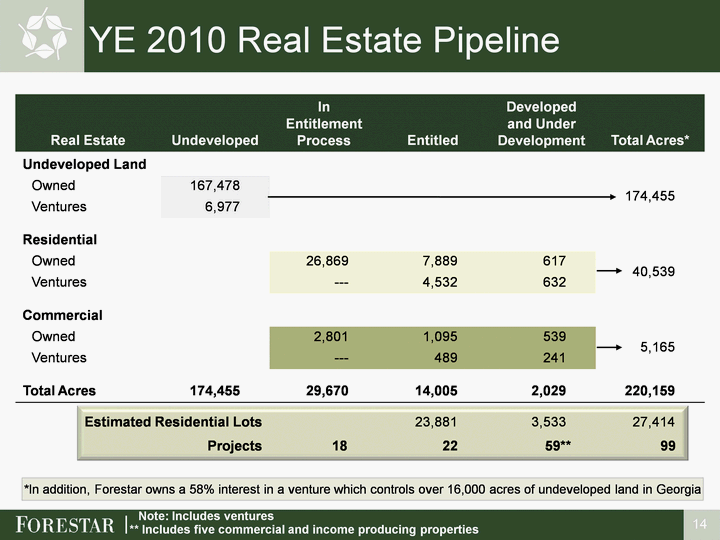
| Real Estate Real Estate Undeveloped In Entitlement Process Entitled Developed and Under Development Total Acres* Undeveloped Land Undeveloped Land Owned Owned 167,478 174,455 Ventures Ventures 6,977 174,455 Residential Residential Owned Owned 26,869 7,889 617 40,539 Ventures Ventures --- 4,532 632 40,539 Commercial Commercial Owned Owned 2,801 1,095 539 5,165 Ventures Ventures --- 489 241 5,165 Total Acres Total Acres 174,455 29,670 14,005 2,029 220,159 Estimated Residential Lots Estimated Residential Lots Estimated Residential Lots 23,881 3,533 27,414 Projects Projects 18 22 59** 99 YE 2010 Real Estate Pipeline *In addition, Forestar owns a 58% interest in a venture which controls over 16,000 acres of undeveloped land in Georgia 14 Note: Includes ventures ** Includes five commercial and income producing properties |
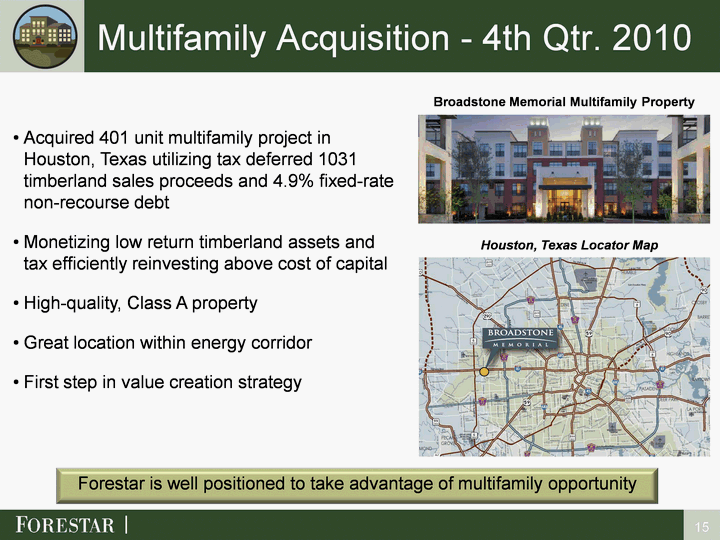
| Multifamily Acquisition - 4th Qtr. 2010 15 Forestar is well positioned to take advantage of multifamily opportunity Acquired 401 unit multifamily project in Houston, Texas utilizing tax deferred 1031 timberland sales proceeds and 4.9% fixed-rate non-recourse debtMonetizing low return timberland assets and tax efficiently reinvesting above cost of capitalHigh-quality, Class A propertyGreat location within energy corridorFirst step in value creation strategy Broadstone Memorial Multifamily Property Houston, Texas Locator Map |
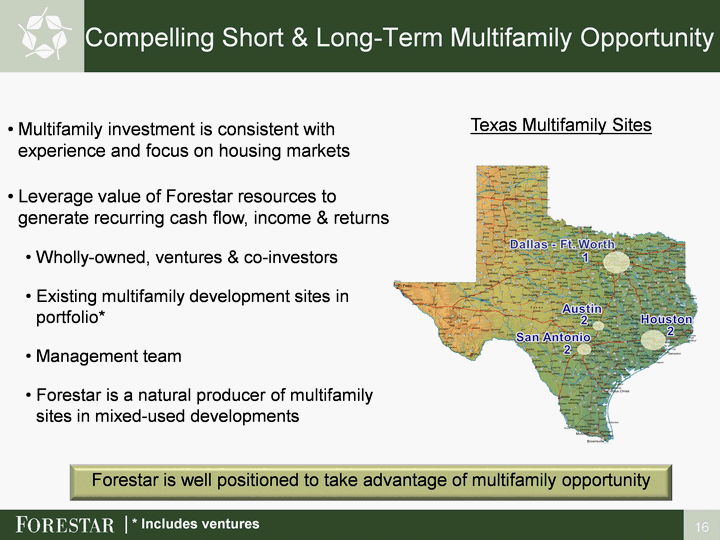
| Compelling Short & Long-Term Multifamily Opportunity 16 Forestar is well positioned to take advantage of multifamily opportunity * Includes ventures Multifamily investment is consistent with experience and focus on housing marketsLeverage value of Forestar resources to generate recurring cash flow, income & returnsWholly-owned, ventures & co-investorsExisting multifamily development sites in portfolio*Management teamForestar is a natural producer of multifamily sites in mixed-used developments Texas Multifamily Sites 1 2 2 2 |
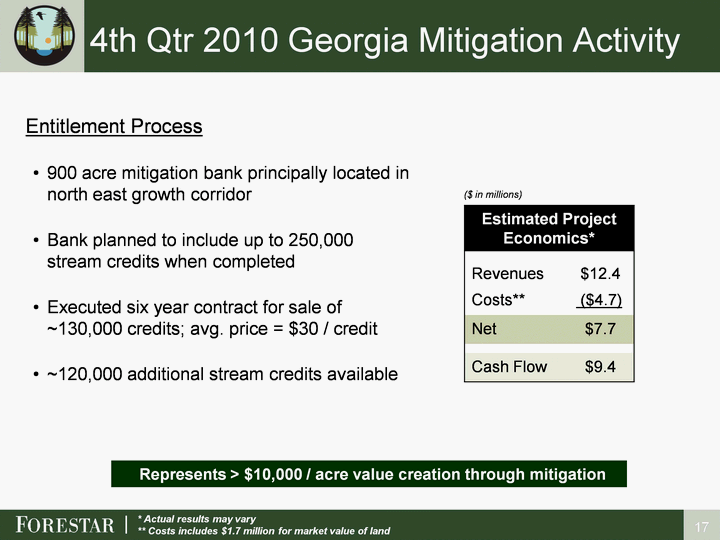
| 4th Qtr 2010 Georgia Mitigation Activity 17 Entitlement Process 900 acre mitigation bank principally located in north east growth corridorBank planned to include up to 250,000 stream credits when completedExecuted six year contract for sale of ~130,000 credits; avg. price = $30 / credit~120,000 additional stream credits available Estimated Project Economics* Estimated Project Economics* Revenues $12.4 Costs** ($4.7) Net $7.7 Cash Flow $9.4 ($ in millions) * Actual results may vary** Costs includes $1.7 million for market value of land Represents > $10,000 / acre value creation through mitigation |
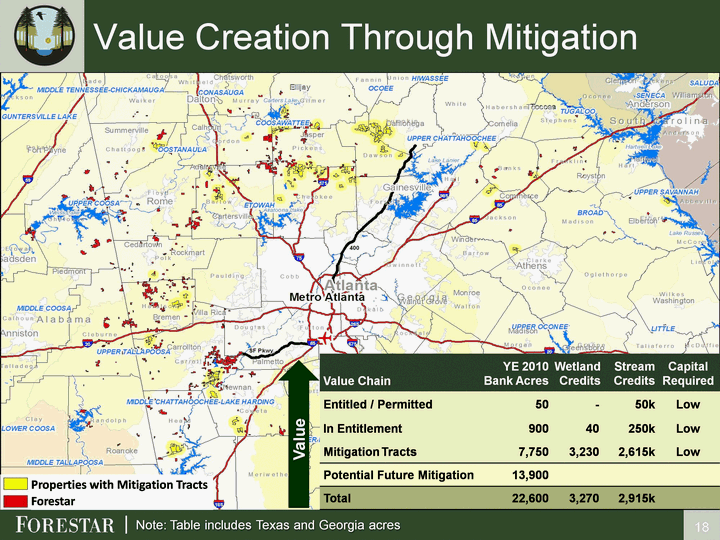
| Value Creation Through Mitigation 18 Value Chain YE 2010 Bank Acres Wetland Credits Stream Credits Capital Required Entitled / Permitted 50 - 50k Low In Entitlement 900 40 250k Low Mitigation Tracts 7,750 3,230 2,615k Low Potential Future Mitigation 13,900 Total 22,600 3,270 2,915k Note: Table includes Texas and Georgia acres Properties with Mitigation TractsForestar Value |
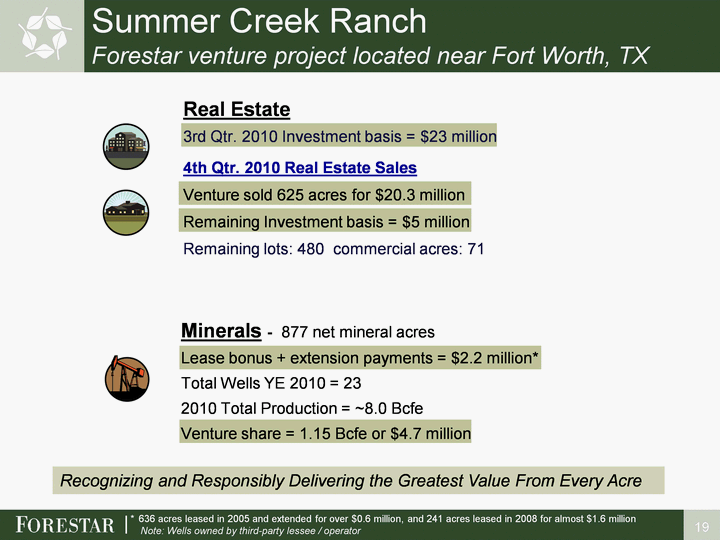
| Summer Creek Ranch Forestar venture project located near Fort Worth, TX 19 Recognizing and Responsibly Delivering the Greatest Value From Every Acre * 636 acres leased in 2005 and extended for over $0.6 million, and 241 acres leased in 2008 for almost $1.6 million Note: Wells owned by third-party lessee / operator Real Estate3rd Qtr. 2010 Investment basis = $23 million4th Qtr. 2010 Real Estate SalesVenture sold 625 acres for $20.3 millionRemaining Investment basis = $5 millionRemaining lots: 480 commercial acres: 71 Minerals - 877 net mineral acres Lease bonus + extension payments = $2.2 million* Total Wells YE 2010 = 232010 Total Production = ~8.0 BcfeVenture share = 1.15 Bcfe or $4.7 million |
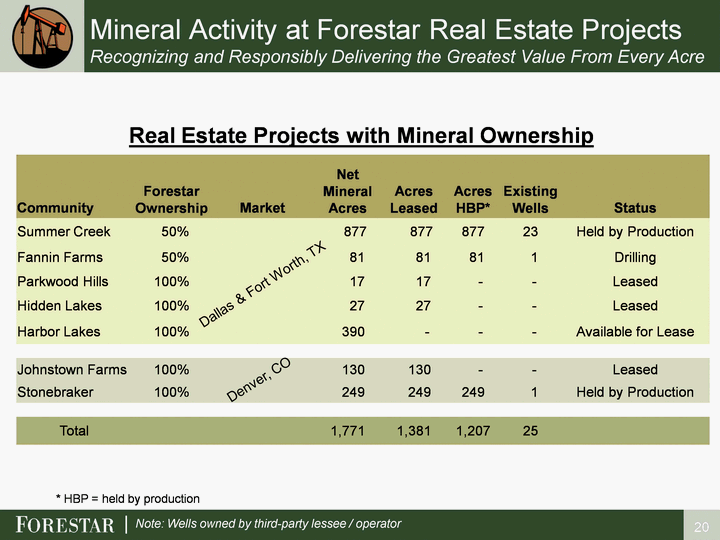
| Mineral Activity at Forestar Real Estate Projects Recognizing and Responsibly Delivering the Greatest Value From Every Acre 20 Community Forestar Ownership Market Net Mineral Acres Acres Leased Acres HBP* Existing Wells Status Summer Creek 50% 877 877 877 23 Held by Production Fannin Farms 50% 81 81 81 1 Drilling Parkwood Hills 100% 17 17 - - Leased Hidden Lakes 100% 27 27 - - Leased Harbor Lakes 100% 390 - - - Available for Lease Johnstown Farms 100% 130 130 - - Leased Stonebraker 100% 249 249 249 1 Held by Production Total 1,771 1,381 1,207 25 Real Estate Projects with Mineral Ownership Note: Wells owned by third-party lessee / operator * HBP = held by production Dallas & Fort Worth, TX Denver, CO |
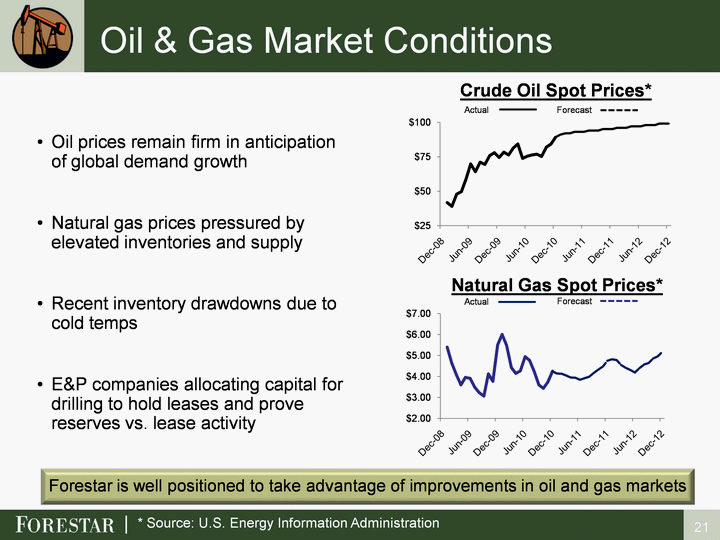
| Oil & Gas Market Conditions 21 Oil prices remain firm in anticipation of global demand growthNatural gas prices pressured by elevated inventories and supplyRecent inventory drawdowns due to cold tempsE&P companies allocating capital for drilling to hold leases and prove reserves vs. lease activity Forestar is well positioned to take advantage of improvements in oil and gas markets (CHART) (CHART) Crude Oil Spot Prices* Natural Gas Spot Prices* * Source: U.S. Energy Information Administration Actual Forecast Actual Forecast |
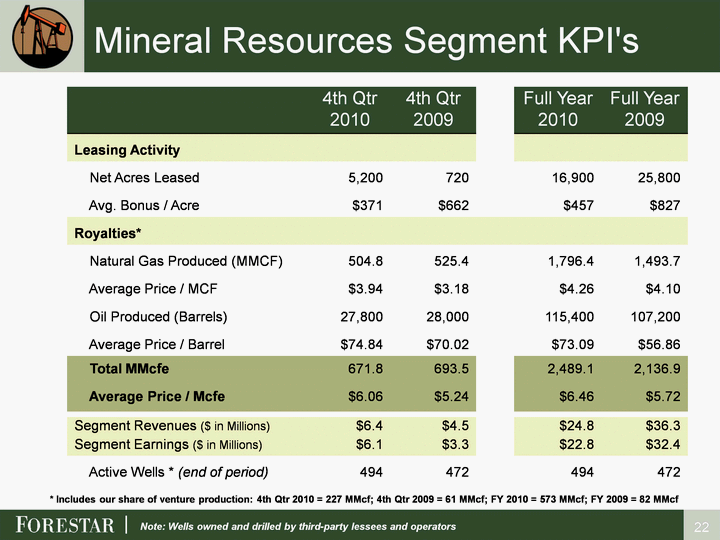
| 22 Mineral Resources Segment KPI's Mineral Resources Segment KPI's Note: Wells owned and drilled by third-party lessees and operators * Includes our share of venture production: 4th Qtr 2010 = 227 MMcf; 4th Qtr 2009 = 61 MMcf; FY 2010 = 573 MMcf; FY 2009 = 82 MMcf |
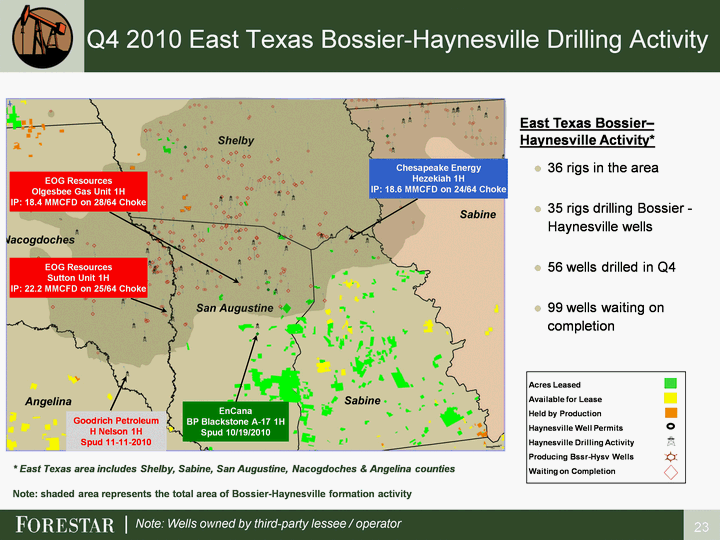
| Q4 2010 East Texas Bossier-Haynesville Drilling Activity 23 Note: Wells owned by third-party lessee / operator 36 rigs in the area35 rigs drilling Bossier - Haynesville wells56 wells drilled in Q499 wells waiting on completion Acres LeasedAvailable for LeaseHeld by ProductionHaynesville Well PermitsHaynesville Drilling ActivityProducing Bssr-Hysv WellsWaiting on Completion East Texas Bossier- Haynesville Activity* * East Texas area includes Shelby, Sabine, San Augustine, Nacogdoches & Angelina counties Goodrich PetroleumH Nelson 1HSpud 11-11-2010 EnCanaBP Blackstone A-17 1HSpud 10/19/2010 EOG ResourcesOlgesbee Gas Unit 1HIP: 18.4 MMCFD on 28/64 Choke EOG ResourcesSutton Unit 1HIP: 22.2 MMCFD on 25/64 Choke Chesapeake EnergyHezekiah 1HIP: 18.6 MMCFD on 24/64 Choke Note: shaded area represents the total area of Bossier-Haynesville formation activity |
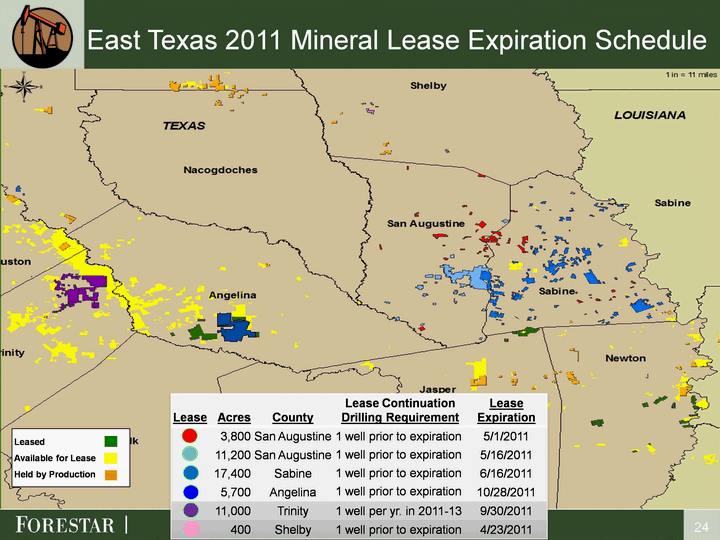
| 24 Lease Acres County Lease ContinuationDrilling Requirement Lease Expiration 3,800 San Augustine 1 well prior to expiration1 well prior to expiration1 well prior to expiration1 well prior to expiration 5/1/2011 11,200 San Augustine 1 well prior to expiration1 well prior to expiration1 well prior to expiration1 well prior to expiration 5/16/2011 17,400 Sabine 1 well prior to expiration1 well prior to expiration1 well prior to expiration1 well prior to expiration 6/16/2011 5,700 Angelina 1 well prior to expiration1 well prior to expiration1 well prior to expiration1 well prior to expiration 10/28/2011 11,000 Trinity 1 well per yr. in 2011-13 9/30/2011 400 Shelby 1 well prior to expiration 4/23/2011 LeasedAvailable for LeaseHeld by Production East Texas 2011 Mineral Lease Expiration Schedule |
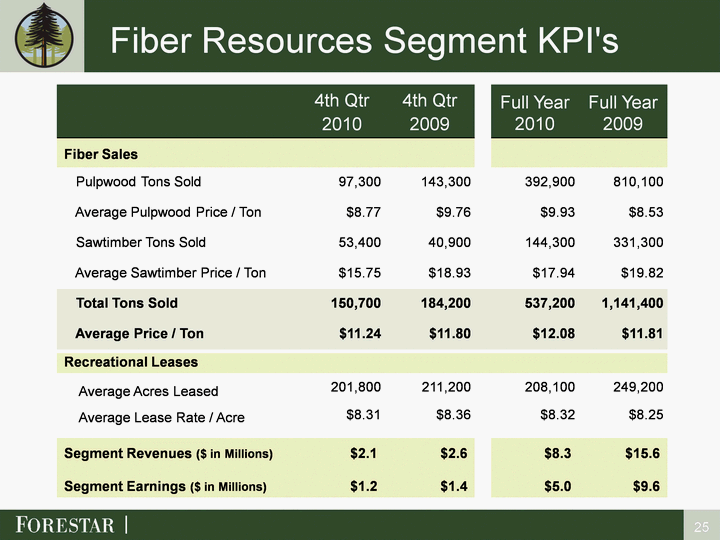
| 25 Fiber Resources Segment KPI's Fiber Resources Segment KPI's |
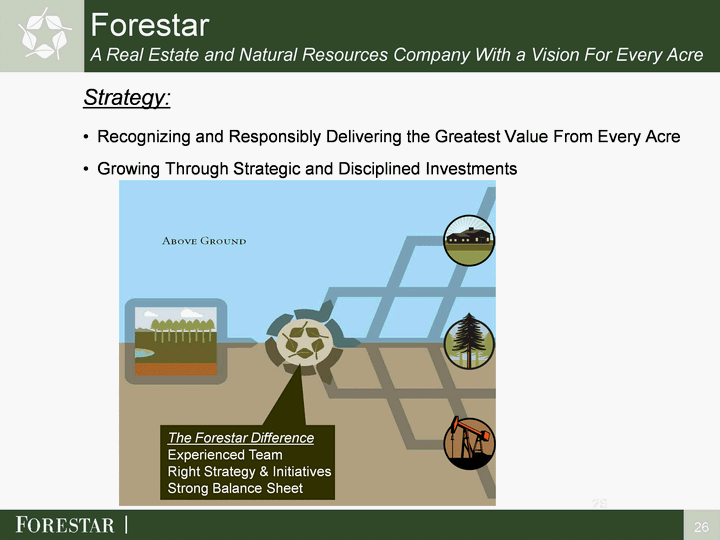
| 26 26 Strategy:Recognizing and Responsibly Delivering the Greatest Value From Every AcreGrowing Through Strategic and Disciplined Investments Forestar A Real Estate and Natural Resources Company With a Vision For Every Acre The Forestar DifferenceExperienced TeamRight Strategy & InitiativesStrong Balance Sheet |

| 27 27 |
