Attached files
| file | filename |
|---|---|
| 8-K - FORM 8-K - Prologis, Inc. | y89358e8vk.htm |
| EX-99.1 - EX-99.1 - Prologis, Inc. | y89358exv99w1.htm |
Exhibit
99.2

| Merger of Equals (r) January 31, 2011 |

| Forward-Looking Statements In addition to historical information, this document contains forward-looking statements within the meaning of Section 27A of the U.S. Securities Act of 1933, as amended, and Section 21E of the U.S. Securities Exchange Act of 1934, as amended. These forward- looking statements, which are based on current expectations, estimates and projections about the industry and markets in which AMB Property Corporation ("AMB") and ProLogis operate and beliefs of and assumptions made by AMB management and ProLogis management, involve uncertainties that could significantly affect the financial results of AMB or ProLogis or the combined company. Words such as "expects," "anticipates," "intends," "plans," "believes," "seeks," "estimates," variations of such words and similar expressions are intended to identify such forward-looking statements, which generally are not historical in nature. Such forward- looking statements include, but are not limited to, statements about the benefits of the business combination transaction involving AMB and ProLogis, including future financial and operating results, the combined company's plans, objectives, expectations and intentions. All statements that address operating performance, events or developments that we expect or anticipate will occur in the future - including statements relating to rent and occupancy growth, development activity and changes in sales or contribution volume of developed properties, general conditions in the geographic areas where we operate and the availability of capital in existing or new property funds - are forward-looking statements. These statements are not guarantees of future performance and involve certain risks, uncertainties and assumptions that are difficult to predict. Although we believe the expectations reflected in any forward-looking statements are based on reasonable assumptions, we can give no assurance that our expectations will be attained and therefore, actual outcomes and results may differ materially from what is expressed or forecasted in such forward-looking statements. Some of the factors that may affect outcomes and results include, but are not limited to: (i) national, international, regional and local economic climates, (ii) changes in financial markets, interest rates and foreign currency exchange rates, (iii) increased or unanticipated competition for our properties, (iv) risks associated with acquisitions, (v) maintenance of status as a real estate investment trust, (vi) availability of financing and capital, (vii) changes in demand for developed properties, (viii) risks of achieving expected revenue synergies or cost savings, (ix) risks associated with the ability to consummate the merger and the timing of the closing of the merger, and (x) those additional risks and factors discussed in reports filed with the U.S. Securities and Exchange Commission ("SEC") by AMB and ProLogis from time to time, including those discussed under the heading "Risk Factors" in their respective most recently filed reports on Form 10-K and 10-Q. Neither AMB nor ProLogis undertakes any duty to update any forward-looking statements appearing in this document. |

| Additional Information About this Transaction In connection with the proposed transaction, AMB Property Corporation ("AMB") expects to file with the SEC a registration statement on Form S-4 that will include a joint proxy statement of ProLogis and AMB that also constitutes a prospectus of AMB. AMB and ProLogis also plan to file other relevant documents with the SEC regarding the proposed transaction. INVESTORS ARE URGED TO READ THE JOINT PROXY STATEMENT/PROSPECTUS AND OTHER RELEVANT DOCUMENTS FILED WITH THE SEC IF AND WHEN THEY BECOME AVAILABLE, BECAUSE THEY WILL CONTAIN IMPORTANT INFORMATION. You may obtain a free copy of the joint proxy statement/prospectus (if and when it becomes available) and other relevant documents filed by AMB and ProLogis with the SEC at the SEC's website at www.sec.gov. Copies of the documents filed by AMB with the SEC will be available free of charge on AMB's website at www.amb.com or by contacting AMB Investor Relations at (415) 394-9000. Copies of the documents filed by ProLogis with the SEC will be available free of charge on ProLogis' website at www.prologis.com or by contacting ProLogis Investor Relations at (303) 567-5690. AMB and ProLogis and their respective directors and executive officers and other members of management and employees may be deemed to be participants in the solicitation of proxies in respect of the proposed transaction. You can find information about AMB's executive officers and directors in AMB's definitive proxy statement filed with the SEC on March 24, 2010. You can find information about ProLogis' executive officers and directors in ProLogis' definitive proxy statement filed with the SEC on March 30, 2010. Additional information regarding the interests of such potential participants will be included in the joint proxy statement/prospectus and other relevant documents filed with the SEC if and when they become available. You may obtain free copies of these documents from AMB or ProLogis using the sources indicated above. This document shall not constitute an offer to sell or the solicitation of an offer to buy any securities, nor shall there be any sale of securities in any jurisdiction in which such offer, solicitation or sale would be unlawful prior to registration or qualification under the securities laws of any such jurisdiction. No offering of securities shall be made except by means of a prospectus meeting the requirements of Section 10 of the U.S. Securities Act of 1933, as amended. |
| Shared Vision for Success The undisputed leader in the industrial sector The best customer franchise in the real estate industry The only player in industrial real estate active on four continents The world's leading industrial property developer A global leader in real estate investment management The best and most diverse real estate organization |

| Transaction Overview Company will be named ProLogis Ticker symbol will be (NYSE: PLD) ~60% former ProLogis shareholders ~40% former AMB shareholders Corporate - San Francisco Operational - Denver ~$80 million annual run rate Expected by the end of second quarter 2011 100% stock merger of equals Each ProLogis share to be converted into 0.4464 of an AMB share Preserves UPREIT structure Merger Company Name Ownership Headquarters Gross G&A Synergies Closing |

| Leadership / Integration The combined Board comprises six ProLogis board members and five AMB board members Hamid Moghadam will be Chairman of the Board Walt Rakowich will be Chairman of the Executive Committee of the Board Irving "Bud" Lyons III will be Lead Independent Director Walt Rakowich Co-CEO (1) / Chairman of Executive Committee Hamid Moghadam Co-CEO / Chairman (1) Walt Rakowich will retire on December 31, 2012. (2) Bill Sullivan will be CFO of the combined company until retirement on December 31, 2012, at which time Tom Olinger will succeed Bill Sullivan. Bill Sullivan (2) Chief Financial Officer Tom Olinger (2) Chief Integration Officer Guy Jaquier CEO Private Capital Gary Anderson CEO Europe & Asia Gene Reilly CEO The Americas Ed Nekritz Chief Legal Officer General Counsel Nancy Hemmenway Chief Human Resources Officer Mike Curless Chief Investment Officer |

| Transaction Benefits Improved credit profile from synergies Unsecured credit will be one of the most liquid in REIT space Cost of equity will reflect accelerating growth in FFO/share Shares and OP units will be attractive acquisition currencies Deep global presence with ~600 million square feet owned and under management Enhanced common platforms in North America, Western Europe and Japan Complementary platforms in UK & CEE (PLD) and China & Brazil (AMB) Aligned talent and resources Land, development and acquisitions Expanded relationships with large, repeat multi-national customers Strong combined entrepreneurial management team Eliminating duplicative gross G&A saves ~$80 million per year Equates to ~$0.19 per combined company share Broad range of product offerings across major regions AUM of $25.7 billion in 19 co-investment ventures World Class Platform Vibrant Private Capital Franchise Improved Combined Cost of Capital Organizational Synergies |

| Pre-eminent Global Real Estate Company (MM sq. ft.) Asia Americas Europe ($Bn) Note: Data estimated as of 12/31/2010. (1) Represents owned / managed assets at 100% share. (2) AUM defined as gross book value of owned / managed properties. 438 160 598 Square Feet Owned / Managed(1) Total AUM(2) $31 $15 $46 Asia Americas Europe |
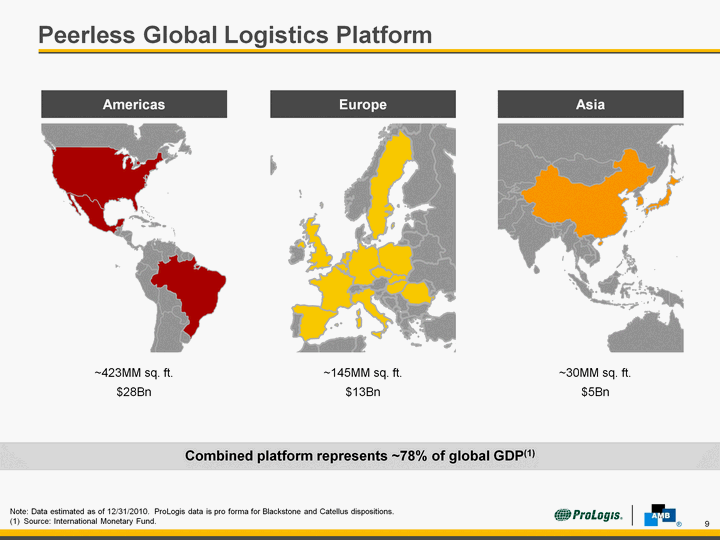
| Peerless Global Logistics Platform Combined platform represents ~78% of global GDP(1) Note: Data estimated as of 12/31/2010. ProLogis data is pro forma for Blackstone and Catellus dispositions. (1) Source: International Monetary Fund. Americas ~423MM sq. ft. $28Bn Europe ~145MM sq. ft. $13Bn ~30MM sq. ft. $5Bn Asia |

| Diverse Customer Base (% Combined ABR) Largest single customer represents only 2.6% of estimated combined ABR Top 10 represents ~10% of estimated combined ABR |
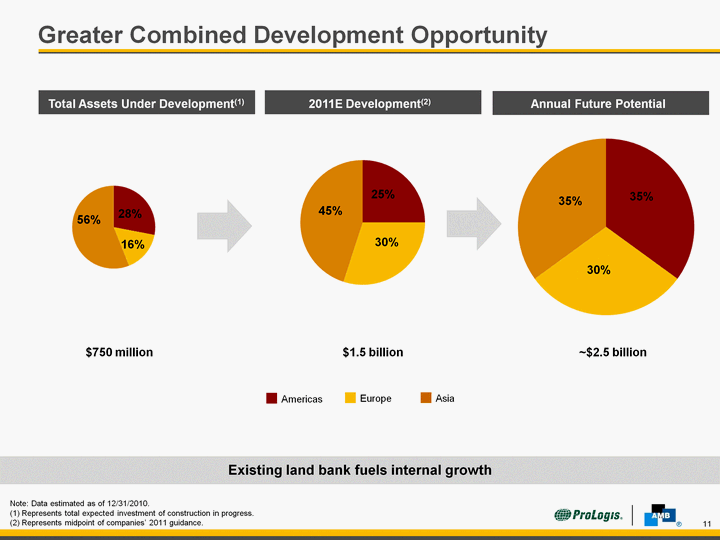
| Greater Combined Development Opportunity $750 million $1.5 billion Total Assets Under Development(1) 2011E Development(2) Note: Data estimated as of 12/31/2010. (1) Represents total expected investment of construction in progress. (2) Represents midpoint of companies' 2011 guidance. Annual Future Potential ~$2.5 billion Existing land bank fuels internal growth Americas Europe 30% 45% 25% 30% 35% 35% 16% 56% 28% |

| $0.1Bn $8.8Bn $8.6Bn Market Leading Private Capital Business Note: Data represents gross book value of AUM in funds and co-investment ventures. Combined AUM 19 co-investment ventures $25.7 billion AUM $13.9Bn $10.0Bn $1.8Bn 9 co-investment ventures $8.2 billion AUM AMB AUM $1.3Bn $1.7Bn $5.2Bn 10 funds $17.5 billion AUM ProLogis AUM Americas Europe |

| ($MM, Except per Share Data) ProLogis (1) AMB (1) Combined(2) Share Price (As of 1/28/2011) $15.21 $32.93 $32.93 Basic Common Shares and Units 573 172 428 Equity Market Capitalization $8,720 $5,657 $14,084 S&P 500 Rank 326 N/A 195 Total Balance Sheet Debt $6,556 $3,344 $9,900 Total Market Capitalization $15,276 $9,001 $23,984 Debt / 2010PF EBITDA (Inc. Syn. for combined company)(3) 7.8x 7.6x 7.3x(4) 2010PF 4QA Fixed Charge Coverage (Inc. Syn. for combined company)(3) 2.3x 2.6x 2.5x(4) Debt as % of Gross Book Value of Real Estate(3) 44.0% 40.0% 42.6% Debt as % of Total Market Capitalization 42.9% 37.2% 41.3% Credit Ratings (Moody's/S&P/Fitch) Baa2/BBB-/BB+ Baa1/BBB/BBB Strong Combined Capitalization and Balance Sheet (1) Data estimated as of 12/31/2010. (2) Calculated using AMB's share price at 1/28/2011 of $32.93 and an exchange ratio of 0.4464x. (3) Statistics calculated based on balance sheet debt, EBITDA, and book value figures; EBITDA includes pro rata FFO contribution from unconsolidated joint ventures. See reporting definitions. (4) Pro forma EBITDA figures include realization of $80MM estimated synergies. |

| Well-Staggered Debt Maturity Schedule (1) Data estimated as of December 31, 2010 Note: Excludes discounts; stated debt maturities may not reflect debt repayments as projected in companies forecasts. Pro Forma Debt Maturity Schedule as of December 31, 2010 ($MM) (1) Global Lines of Credit ($MM) Balance Sheet Debt |

| ($MM) Annual Gross G&A Savings Operating $65 M Corporate Infrastructure Costs $15 M Total Synergies ($) $80 M Per Combined Company Share ($) ~$0.19 per share G&A Synergies ~50% run rate expected by year end 2011 100% realized by year end 2012 |
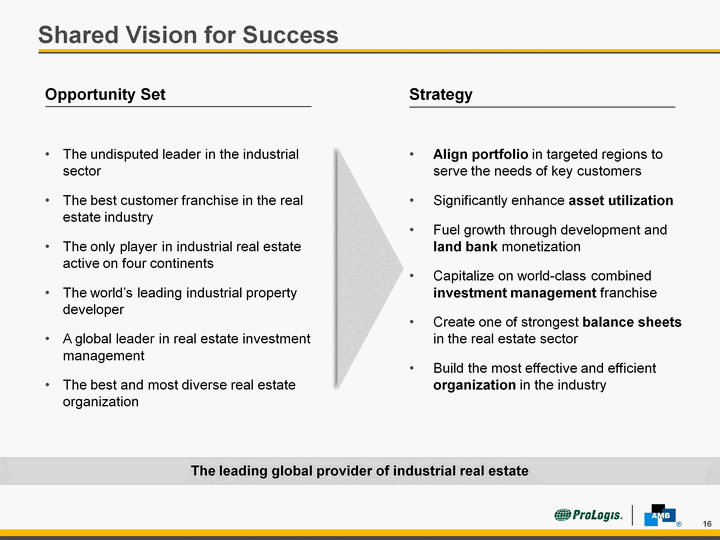
| Shared Vision for Success Opportunity Set The undisputed leader in the industrial sector The best customer franchise in the real estate industry The only player in industrial real estate active on four continents The world's leading industrial property developer A global leader in real estate investment management The best and most diverse real estate organization Strategy Align portfolio in targeted regions to serve the needs of key customers Significantly enhance asset utilization Fuel growth through development and land bank monetization Capitalize on world-class combined investment management franchise Create one of strongest balance sheets in the real estate sector Build the most effective and efficient organization in the industry The leading global provider of industrial real estate |

| Reporting Definitions . Core EBITDA, as Adjusted: The companies use core adjusted earnings before interest, tax, depreciation and amortization, impairment charges, gains or losses from the disposition of real estate investments, losses on early extinguishment of debt and derivatives contracts (including cash charges), and other non- cash charges (such as stock based compensation amortization, unrealized gains or losses on foreign currency and derivative activity) , including the companies share of these items (other than interest and current taxes) from their unconsolidated investees or ("Core EBITDA, as adjusted"), to measure both their operating performance and liquidity. The companies consider Core EBITDA, as adjusted to provide investors relevant and useful information because it permits investors to view income from operations on an unleveraged basis before the effects of tax, non-cash depreciation and amortization expense and other items(including stock-based compensation amortization and certain unrealized gains and losses), gains from the disposition of real estate investments, and other significant non-cash items. By excluding interest expense, adjusted EBITDA allows investors to measure the company's operating performance independent of their capital structure and indebtedness and, therefore, allows for a more meaningful comparison of its operating performance to that of other companies, both in the real estate industry and in other industries. The impairment charges were principally a result of the companies' changed intent with respect to the holding period of certain of its real estate properties and decreases in fair value due to increases in capitalization rates and deterioration in market conditions that adversely impacted values. Losses on the early extinguishment of debt and derivatives contracts generally included the costs of repurchasing debt securities. Although difficult to predict, these items may be recurring given the uncertainty of the current economic climate and its adverse effects on the real estate and financial markets. While not infrequent or unusual in nature, these items result from market fluctuations that can have inconsistent effects on each company's results of operations. The economics underlying these items reflect market and financing conditions in the short-term but can obscure each company's performance and the value of each company's long-term investment decisions and strategies. As a liquidity measure, the companies believe that Core EBITDA, as adjusted helps investors to analyze their ability to meet interest payment obligations and to make quarterly preferred share dividends and unit distributions. The companies believe that investors should consider Core EBITDA, as adjusted , in conjunction with net income (the primary measure of each company's performance) and the other required Generally Accepted Accounting Principles ("GAAP") measures of its performance and liquidity, to improve their understanding of each company's operating results and liquidity, and to make more meaningful comparisons of their performance against other companies. By using Core EBITDA, as adjusted, an investor is assessing the earnings generated by each company's operations, but not taking into account the eliminated expenses or gains incurred in connection with such operations. As a result, adjusted EBITDA has limitations as an analytical tool and should be used in conjunction with each company's required GAAP presentations. Core EBITDA, as adjusted does not reflect each company's historical cash expenditures or future cash requirements for working capital, capital expenditures distribution requirements or contractual commitments. Core EBITDA, as adjusted also does not reflect the cash required to make interest and principal payments on each company's outstanding debt. While Core EBITDA, as adjusted is a relevant and widely used measure of operating performance and liquidity, it does not represent net income or cash flow from operations as defined by GAAP and it should not be considered as an alternative to those indicators in evaluating operating performance or liquidity. Further, the companies' computation of Core EBITDA, as adjusted may not be comparable to EBITDA reported by other companies. The companies compensate for the limitations of Core EBITDA, as adjusted by providing investors with financial statements prepared according to U.S. GAAP, along with this detailed discussion of Core EBITDA, as adjusted and a reconciliation of Core EBITDA, as adjusted to net income (or loss), a U.S. GAAP measurement. |

| Definitions . The following table reconciles Core EBITDA, as adjusted to estimated net earnings (loss) for the quarter ended December 31, 2010 (dollars in thousands): |
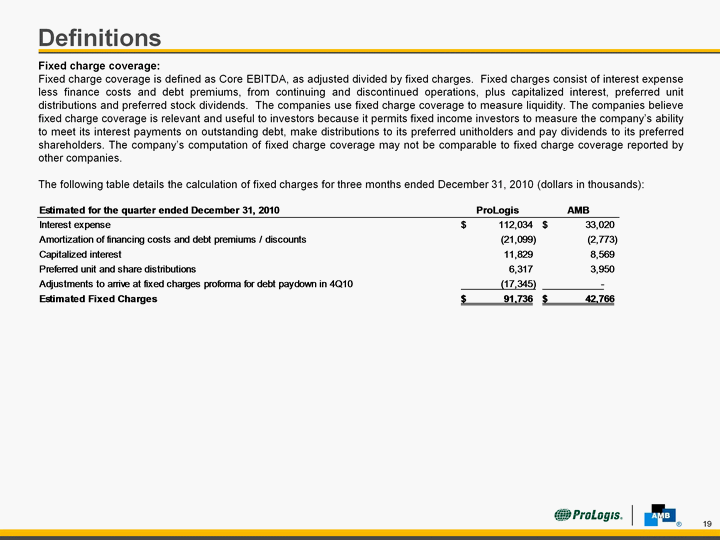
| Definitions . Fixed charge coverage: Fixed charge coverage is defined as Core EBITDA, as adjusted divided by fixed charges. Fixed charges consist of interest expense less finance costs and debt premiums, from continuing and discontinued operations, plus capitalized interest, preferred unit distributions and preferred stock dividends. The companies use fixed charge coverage to measure liquidity. The companies believe fixed charge coverage is relevant and useful to investors because it permits fixed income investors to measure the company's ability to meet its interest payments on outstanding debt, make distributions to its preferred unitholders and pay dividends to its preferred shareholders. The company's computation of fixed charge coverage may not be comparable to fixed charge coverage reported by other companies. The following table details the calculation of fixed charges for three months ended December 31, 2010 (dollars in thousands): |
