Attached files
| file | filename |
|---|---|
| 8-K - FORM 8-K - TESSERA TECHNOLOGIES INC | d8k.htm |
| EX-99.1 - PRESS RELEASE - TESSERA TECHNOLOGIES INC | dex991.htm |
Exhibit 99.2

Q4 and FY 2010 Earnings Prepared Remarks
Summary Results
2010 was a record revenue year for Tessera. Total revenue for 2010 was $301.4 million, compared to $299.4 million of total revenue in 2009. The year-over-year increase in our Micro-electronics revenue was 20% when adjusting for discrete items such as the $15.0 million payment from United Test and Assembly Center Ltd. (UTAC) in 2010 resulting from the settlement of the breach of contract lawsuit we filed against them and $60.6 million as part of a $64.1 million award paid by Amkor to us in 2009 for the breach of its license agreement. Additionally, Imaging & Optics revenue grew approximately 25% to $37.3 million in 2010.
2010 GAAP Net income was $57.3 million, or $1.14 per diluted share. Non-GAAP Net income was $91.2 million, or $1.77 per diluted share. 2009 GAAP Net income was $69.8 million, or $1.42 per diluted share. 2009 Non-GAAP Net income was $101.5 million, or $2.02 per diluted share. Cash, cash equivalents, and investments at December 31, 2010 were $475 million, an increase of $71.4 million for the year.
Segment Review
Micro-electronics
In our Micro-electronics segment, we develop, license and deliver advanced integrated circuit (IC) packaging solutions that are primarily used in the high growth markets of mobile wireless and DRAM devices. Our chip scale packaging (CSP), multi chip packaging (MCP), and Package-on-Package (POP) solutions are backed by hundreds of patents and patent applications, some of which run through September 2029. We generate the majority of these patents through internally funded research and development, and also selectively acquire patent assets to further strengthen our position.
In the DRAM market, our CSP solutions are used for DRAM chips such as DDR2, DDR3 and potentially DDR4. Gartner Dataquest forecasts that the DRAM market will grow approximately 22% in 2011 over 2010. The four largest DRAM producers have either directly licensed our CSP solutions, or are using a
1
licensed subcontract manufacturer. Two of our major DRAM licensees have volume pricing adjustments that will cause our aggregate annual DRAM royalty revenue to grow less rapidly than DRAM shipments in the overall DRAM segment. An additional effect may include quarter-to-quarter fluctuations in growth of our revenues from DRAM, depending on the overall unit growth of the DRAM market and the relative DRAM market share enjoyed by these two DRAM manufacturers. This occurred in the fourth quarter of 2010, when there was a negative sequential impact in our business from the third quarter to fourth quarter of $6.6 million due to the volume pricing adjustments.
In the mobile wireless device market, our CSP, MCP and POP solutions are used for chips such as baseband processors, Digital Signal Processors (DSP) and Power Management Integrated Circuits. Due to increasing performance requirements, MCP and POP solutions are being used more frequently in mobile wireless devices such as smartphones. Gartner Dataquest forecasts smartphones will grow approximately 50% in 2011 over 2010, in terms of units shipped. Motorola, one of the world’s largest cell phone manufacturers headquartered in North America, signed its license agreement with us after the U.S. International Trade Commission (ITC) ruled in May 2009 that the patents we asserted in what we term the “ITC 605 Wireless case” were valid and infringed.
Our success in licensing our innovative, patented technology has generated significant revenue growth in our Micro-electronics segment. We engage in licensing discussions with companies on the merits of our patents, know how, and trade secrets in order to facilitate license agreements. If through negotiations we are not successful obtaining or renewing license agreements from companies that ship products that incorporate our intellectual property, we may pursue the matter in court or before the ITC, which in each case is typically a multi-year process. In the period from 2004 through 2010, we spent approximately $200 million on litigation expenses. During that same period, our litigation and licensing efforts generated approximately $1.2 billion in revenue and our total Micro-electronics revenue grew at a Compound Annual Growth Rate of approximately 28%.
In 2010, we renewed our license agreement with Fujitsu, and we signed a license agreement with a new licensee, Nanium, a leading European subcontract assembler. In addition, we settled the breach of contract lawsuit we filed against UTAC, which resulted in an updated license agreement. We filed a lawsuit against Sony Corporation, Sony Electronics, Inc. (collectively “Sony”) and Renesas Electronics (the merged entity of NEC Electronics and Renesas Technology Corp.) on October 1, 2010, as our licensing discussions with them to secure their lawful access to our technology did not sufficiently advance.
2
We devoted significant research and development resources in 2010 to expand our technology offerings beyond CSP to advanced packaging technologies such as 3D packaging, Through Silicon Via (TSV) and flip chip, as well as circuit designs and memory modules. We are offering the benefits of these new technologies to companies with whom we are in licensing discussions.
Another area of innovation for us is thermal management, through technology we term silent air cooling. Our primary target market for this product is ultra thin elite laptops. We are preparing to ramp production with contract manufacturers who will be assembling our product, with the goal of being high volume manufacturing ready prior to the end of 2011.
Imaging & Optics
Our primary market for Imaging & Optics is camera phones. We also license our imaging technologies into the digital still camera market and manufacture and sell optical products into specialist applications.
In 2010, Imaging & Optics revenue grew approximately 25% to $37.3 million. The biggest revenue contributors were sales from our Product and Services that recovered from depressed 2009 levels related to the semiconductor equipment market, license fees from new customers, and increased royalties from technologies such as our Extended Depth of Field (EDOF). New licensees in 2010 included Fujitsu and Samsung. Samsung is now a customer licensing multiple Imaging & Optics technologies
In May of 2010, we completed our sixth Imaging & Optics acquisition with the purchase of Siimpel, a developer and manufacturer of micro electro mechanical systems (MEMS) based camera solutions for mobile imaging applications. These MEMS-based solutions complement our EDOF technology, expanding the Auto Focus portion of our Image Enhancement Technology portfolio to address camera modules above 5MP.
We also broadened our Imaging & Optics technology offerings in 2010 through internal technology development. We continued development work on our Zoom technology. We announced our newest Embedded Image Enhancement technology – Video Tools, in which we combine image processing hardware acceleration and software into a single solution. In the fourth quarter of 2010, Fujitsu licensed our Video Tools technology.
3
There are three main trends driving our Imaging & Optics growth. The first is the emerging video capture market in mobile devices. The second is the increased number of mobile devices that have a second camera, many of which are used for video capture. The third is the emerging ubiquity of barcodes for use in smartphone applications such as mobile shopping. We believe our EDOF, Zoom, and MEMS Auto Focus technologies are well positioned to capitalize on the growth of these applications.
We received our initial EDOF royalties in the first quarter of 2010, and they grew each subsequent quarter. We expect our royalty growth will generally track that of the overall EDOF market, which industry analyst Techno Systems Research forecasts will grow to more than 120 million camera phones with EDOF in 2011.
Negotiations continue towards the goal of signing our first Zoom licensee. We continue our development of Zoom in collaboration with major handset OEM’s with goal of delivering a solution which provides optical zoom like performance within the size and cost constraints of the mobile market.
In 2010 we made great progress developing our MEMS Auto Focus products. In 2011, we are preparing for outsourced high volume manufacturing, positioning MEMS Auto Focus to be a significant revenue growth driver for Tessera starting in 2012. Our target market, namely camera phones incorporating auto focus, is expected to grow from approximately 500 million units in 2011 to more than 730 million units in 2013, according to industry analyst Yole.
With regard to the other areas and technologies in our Imaging & Optics segment, we continue to manufacture our more mature, profitable Micro Optics products. We face a challenge in our consumer Micro Optics efforts, where a high volume order did not materialize in the fourth quarter of 2010 as anticipated. Also, growth in the digital still camera space has slowed, affecting our Embedded Image Enhancement business line.
Consequently, in 2011, we are reorganizing our Imaging & Optics segment to focus on key growth opportunities including EDOF, Zoom and MEMS Auto Focus and we are aligning our expenses accordingly. Today we announced a reduction of Imaging & Optics employees that is anticipated to be up to 15% of our worldwide employee base, primarily in the Micro Optics and Embedded Image Enhancement business lines, along with certain headquarters support functions.
4
Patent Assets
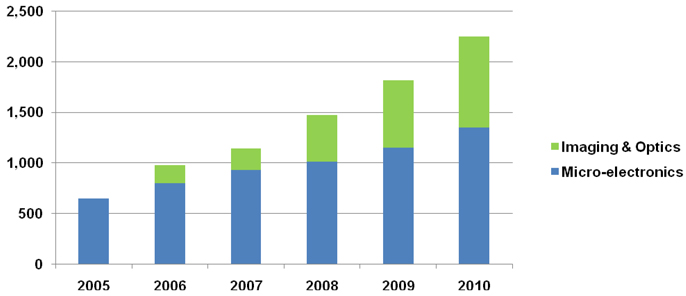
We continue to foster innovation and dedicate significant resources to inventing and acquiring new technology. High-quality patents are the international currency of innovation. As of December 31, 2010, Tessera and its subsidiaries owned approximately 2,250 domestic and international patents and patent applications. Nearly 1,350 of these patents and patent applications are for technologies related to our Micro-electronics segment. Approximately 900 patents and patent applications are for technologies related to our Imaging & Optics segment. The lives of certain patents extend to September 2029.
5
Financial Discussion
Quarterly Revenue
| Q4 2010 | Q4 2009 | Y-o-Y % | Q3 2010 | Q-o-Q % | ||||||||||||||||
| Total Revenue |
$ | 80.4 | $ | 56.5 | 42 | % | $ | 82.1 | (2 | %) | ||||||||||
| Micro-electronics |
$ | 71.2 | $ | 48.5 | 47 | % | $ | 72.0 | (1 | %) | ||||||||||
| Imaging & Optics |
$ | 9.2 | $ | 8.0 | 16 | % | $ | 10.1 | (8 | %) | ||||||||||
| Imaging & Optics – Royalties |
$ | 3.5 | $ | 1.5 | 131 | % | $ | 3.2 | 10 | % | ||||||||||
(in Millions, except %)
Revenue for the fourth quarter of 2010 was $80.4 million, which was slightly above the high end of our $79.0 million guidance provided in our October 28, 2010 earnings report.
Total Micro-electronics revenue was $71.2 million for the fourth quarter of 2010 and included $6.0 million received from UTAC as a result of our first quarter of 2010 settlement. We received a similar payment from UTAC in the third quarter of 2010 as well. We benefitted by $3.3 million in the quarter from a one-time catch up royalty payment and a license fee. Volume pricing adjustments resulted in a sequential decline of $6.6 million, as mentioned previously. In aggregate, ongoing royalty payments increased $2.5 million or 4% sequentially.
Imaging & Optics revenue, comprised of royalties and license fees and products and services, was $9.2 million for the fourth quarter of 2010. Royalties and license fees were $5.2 million, up 31% quarter-over-quarter, and 61% year-over-year. Royalties were $3.5 million, up 10% quarter-over-quarter and up 131% year-over-year. The increase in royalties is primarily related to continued market adoption of our EDOF technology. As we have previously indicated, quarterly revenue from royalties and license fees is expected to fluctuate due to the timing and amount of license fees, which can be significant relative to ongoing royalties.
Products and services revenue was $4.0 million, $2.0 million below our guidance. Due to our position in the semiconductor capital equipment supply chain, it is often difficult to predict our orders on a quarterly basis.
6
Quarterly GAAP Results
Total GAAP operating expenses in the fourth quarter of 2010 were $55.0 million as follows:
| • | Cost of revenues: $5.3 million, |
| • | R&D: $19.2 million, |
| • | SG&A: $20.8 million, |
| • | Litigation expense: $6.2 million , and |
| • | Impairment of long lived assets: $3.5 million. |
Included in the GAAP functional operating expenses above are the following:
| • | Stock-based compensation expense: $6.8 million, and |
| • | Amortization of acquired intangibles: $4.0 million. |
In addition, Other income, net of expense, was $0.9 million, and GAAP tax expense was $12.8 million, representing a 48.6% effective tax rate for the quarter. In the fourth quarter of 2010 we made an election that resulted in an increase in our effective tax rate for the fourth quarter, which we anticipate will benefit our fiscal 2011 effective tax rate.
Fourth quarter total GAAP operating expenses were up 10% quarter-over-quarter. The sequential increase was mainly due to two factors. First, a $3.5 million impairment charge of long-lived assets in our Imaging and Optics segment. As a reminder, we announced the cessation of development of our Wafer-Level Optics technology in our October 28, 2010 earnings report. Second, a $1.4 million increase in litigation expense. Litigation expense was up 30% sequentially due in part to complaints we filed against UTAC (Taiwan) Corporation on September 30, 2010, and against Sony and Renesas Electronics Corporation on October 1, 2010. Our ongoing litigation efforts also include the Hynix antitrust action, the Amkor arbitration, the appeals related to our International Trade Commission (ITC) 605 and 630 cases, and an appeal by Powertech Technology, Inc. resulting from our victory in dismissing a declaratory judgment action filed against us in early 2010.
Quarterly GAAP Net Income and EPS
| Q4 2010 | Q4 2009 | Y-o-Y % | Q3 2010 | Q-o-Q % | ||||||||||||||||
| GAAP Net Income |
$ | 13.5 | $ | 6.4 | 112 | % | $ | 19.0 | (29 | %) | ||||||||||
| GAAP EPS |
$ | 0.27 | $ | 0.13 | $ | 0.38 | ||||||||||||||
| Fully Diluted Shares |
50.9 | 50.1 | 50.5 | |||||||||||||||||
(in Millions, except per share and %)
7
Quarterly Non GAAP Results
Total Non-GAAP operating expenses in the fourth quarter of 2010 were $40.7 million as follows:
| • | Cost of revenues: $3.4 million, |
| • | R&D: $15.7 million, |
| • | SG&A: $15.4 million, and |
| • | Litigation expense: $6.2 million. |
Fourth quarter total Non-GAAP operating expenses were up $1.2 million or 3% quarter-over-quarter and up $6.4 million or 19% year-over-year. Cost of revenues was down $0.1 million or 5% quarter-over-quarter. R&D expense was down $1.4 million or 8% quarter-over-quarter, due to a reduction in patent maintenance expense. SG&A expenses were up $1.3 million or 9% quarter-over-quarter mainly related to an increase in IP analysis reports and personnel related costs. Non-GAAP results exclude stock-based compensation, charges for acquired in-process research and development, acquired intangibles amortization, impairment charges on long-lived assets, and related tax effects. We have included a detailed reconciliation between our GAAP and Non-GAAP net income in both our earnings release and on our web site for your convenient reference.
Quarterly Non-GAAP Net Income and EPS
Tax adjustments in the fourth quarter of 2010 for Non-GAAP items were approximately $4.7 million.
| Q4 2010 | Q4 2009 | Y-0-Y % | Q3 2010 | Q-o-Q % | ||||||||||||||||
| Non-GAAP Net Income |
$ | 23.1 | $ | 16.0 | 44 | % | $ | 27.0 | (15 | %) | ||||||||||
| Non-GAAP EPS |
$ | 0.44 | $ | 0.31 | $ | 0.52 | ||||||||||||||
| Fully Diluted Shares |
52.5 | 51.5 | 51.6 | |||||||||||||||||
(in Millions, except per share and EPS)
Annual Revenue
| FY 2010 | FY 2009 | Y-o-Y $ | Y-o-Y % | |||||||||||||
| Total Revenue |
$ | 301.4 | $ | 299.4 | $ | 2.0 | 1 | % | ||||||||
| Micro-electronics |
$ | 264.1 | $ | 269.7 | ($ | 5.6 | ) | (2 | %) | |||||||
| Imaging & Optics |
$ | 37.3 | $ | 29.7 | $ | 7.6 | 25 | % | ||||||||
| Imaging & Optics - Royalties |
$ | 11.4 | $ | 5.5 | $ | 5.9 | 109 | % | ||||||||
(in Millions, except %)
8
Revenue for 2010 was $301.4 million, up $2.0 million or 1% year-over-year. Total Micro-electronics revenue was $264.1 million, down $5.6 million or 2% year-over-year. The year-over-year increase in our Micro-electronics revenue was 20% when adjusting for discrete items such as the $15 million payment from United Test and Assembly Center Ltd. in 2010 resulting from the settlement of the breach of contract lawsuit we filed against them, and $60.6 million as part of an award paid by Amkor to us in 2009 for the breach of its license agreement.
Imaging & Optics revenue was $37.3 million, an increase of $7.6 million or 25%. The biggest revenue contributors in 2010 were sales from our Product and Services that recovered from depressed 2009 levels related to the semiconductor equipment market, license fees from new customers, and increased royalties from technologies such as our Extended Depth of Field (EDOF).
Annual GAAP and Non-GAAP Results
GAAP Net Income for 2010 was $57.3 million or $1.14 per share on a fully diluted weighted average share count of 50.5 million shares. In comparison to 2009, GAAP Net Income was $69.8 million or $1.42 per share on a fully diluted weighted average share count of 49.3 million shares.
Non-GAAP Net Income for 2010 was $91.2 million or $1.77 per share on a fully diluted weighted average share count of 51.5 million shares. In comparison to 2009, Non-GAAP Net Income was $101.5 million or $2.02 per share on a fully diluted weighted average share count of 50.4 million shares.
Balance Sheet Metrics
We ended the quarter with $475.0 million in cash, cash equivalents, and investments, a $1.0 million increase over the prior quarter. Net cash provided by operations for the quarter was $16.1 million. Major uses of cash in the quarter included $23.0 million in tax payments and $15.4 million of patent acquisitions.
Cash, cash equivalents and investments are up $71.4 million from 2009. Net cash provided by operations in 2010 was $106.1 million. Major uses of non-operating cash in 2010 included $20.1 million of patent acquisitions, $15.0 million for the acquisition of Siimpel and $9.8 million of capital equipment purchases.
9
First Quarter 2011 Guidance
Total revenue for the first quarter 2011 will range between $65 million and $68 million, which compares to first quarter 2010 total revenues of $64.3 million.
Micro-electronics revenue will range between $54 million and $56 million, all of which will be royalties and license fees. As a comparison, first quarter 2010 Micro-electronics royalties and license fees were $55.8 million and included a $3.0 million payment for past royalties from United Test and Assembly Center Ltd (UTAC), under a litigation settlement.
Our first quarter 2011 guidance reflects the fact that five licensees or former licensees are either in breach of contract or have not renewed their license agreements. We are pursuing UTAC (Taiwan) Corporation and Amkor for breaches of their contracts. In its most recent royalty report, Amkor indicated there will not be any royalty bearing packages for the six months ending March 31, 2011, which impacts our first quarter 2011 guidance and potentially guidance thereafter. Amkor’s action will be the subject of further arbitration.
We are also pursuing Sony (collective Sony Corporation and Sony Electronics, Inc.) and Renesas Electronics (the merged entity of NEC Electronics and Renesas Technology Corp.) for patent infringement. Tessera is pursuing these actions based on its long standing practice of to protecting its intellectual property and licensees in good standing. The timing of resolution of these litigation and arbitration matters is difficult to predict. In addition, we are in active licensing negotiations with a fifth company.
Two major DRAM manufacturers have volume pricing adjustments in their licenses that may cause, only for these two DRAM manufacturers when unit shipment volumes are high, our aggregate annual DRAM royalty revenue to grow less rapidly than annual growth in overall unit shipments in the DRAM market.
First quarter 2011 Imaging & Optics revenue, in total, is expected to range between $11 million and $12 million. This compares to first quarter of 2010 Imaging & Optics revenue of $8.5 million. Royalties and license fees are expected to be approximately $6.5 million to $7.0 million as we anticipate continued increases in royalties from our EDOF licensees and additional licenses for our Red Eye Reduction technology. Sequentially, royalties and license fees are expected to be up approximately $1.3 million to $1.8 million from $5.2 million in the fourth quarter of 2010. For reference, royalties and license fees were $3.1 million in the first quarter of 2010, which included $0.8 million of license fees and $2.3 million of royalties.
10
First quarter 2011 Products and services revenue is expected to range between $4.5 million and $5.0 million. For reference, products and services revenues were $5.4 million in the first quarter of 2010.
First quarter 2011 Non-GAAP operating expenses, less litigation expense and a one-time charge related to a planned workforce reduction, are expected to range between $35 million and $36 million.
Non-GAAP cost of revenues is expected to be up approximately 2% to 4% sequentially.
Non-GAAP R&D is expected to be up approximately 9% to 11% sequentially as we anticipate additional costs to support the continued advancement of our MEMS technology, including non-recurring engineering and material cost related to establishing our outsourced manufacturing. In addition, we continue to increase expenses related to our Silent Air Cooling development.
Non-GAAP SG&A is expected to be down approximately 2% to 4% sequentially.
We expect our litigation expense in the first quarter of 2011 to be flat in comparison to the prior quarter. We anticipate continued efforts related to the Hynix antitrust action, the Amkor arbitration, the UTAC (Taiwan) breach of contract case, the Sony and Renesas Electronics Corporation patent infringement cases, and legal activity related to appeals pending in the U.S. Court of Appeals for the Federal Circuit.
We expect first quarter 2011 stock-based compensation to be approximately $6.8 million and amortization charges to be $4.3 million.
In connection with our Imaging & Optics reorganization, we expect to incur severance and other related costs in the range of $2.5 million to $3.0 million, which we will recognize in the first quarter of 2011.
In terms of long-term impact, as a result of this action, we anticipate our Non-GAAP total operating expenses in 2011 will be reduced ratably over the year by approximately $10 million. We plan to expand our efforts in MEMS Auto Focus, EDOF and Zoom, which will result in an increase of approximately $2 million in the year. Additionally, we expect to increase our investment in our Micro-electronics segment by approximately $16 million for the year, primarily in the areas of Advanced Packaging and Silent Air Cooling development, Patent Analysis and Licensing.
11
Our estimated tax rate for fiscal year 2011 is expected to be approximately 39%.
Litigation Review
On December 21, 2010, the U.S. Court of Appeals for the Federal Circuit comprehensively affirmed the ITC’s Final Determination in Tessera’s favor in our ITC 605 Wireless case, finding our asserted patents to be valid and infringed. The respondents have 45 days to petition the panel and/or the full Court of Appeals for rehearing and may also petition the U.S. Supreme Court within 90 days after entry of the judgment or a request for rehearing is denied, whichever is later. We intend to pursue our stayed district court actions as soon as the stays are lifted, which we expect will occur once the appellate process is completed.
In the appeal of the ITC 630 DRAM case, we participated in oral argument before the U.S. Court of Appeals for the Federal Circuit on January 14, 2011, and await the Court’s ruling.
A third matter, Powertech Technology, Inc. v. Tessera, is also before the U.S. Court of Appeals for the Federal Circuit. This case was originally filed in the U.S. District Court for the Northern District of California in March of 2010 by Powertech Technology Inc. (“PTI”), which sought a declaratory judgment of noninfringement and invalidity of Tessera’s U.S. Patent No. 5,663,106. In June 2010, that Court granted Tessera’s motion to dismiss the complaint for lack of subject matter jurisdiction, and afterwards PTI appealed. We have filed our brief with the Court of Appeals and expect a ruling sometime later this year.
In the Tessera v. Hynix antitrust lawsuit we filed in 2006, which is now before the California Superior Court in San Francisco, we are progressing through the final remaining aspects of the pretrial phase of the case, but the Court has not yet set a trial date.
Similarly, we are making progress, albeit slowly, in the Amkor arbitration. The arbitration panel held a two day mini-trial on December 9-10, 2010 on a discrete part of the dispute, focused in significant part on whether Amkor has complied with the panel’s rulings arising from the previous arbitration. We expect a ruling on this “Phase One” of the case in the first half of 2011. A trial on Phase Two, which will address the remaining issues in the case, is currently scheduled to begin in the third quarter of 2011. As a reminder, the previous Amkor arbitration took approximately three years before being resolved in Tessera’s favor.
12
In addition, as previously reported, we filed two new lawsuits in the second half of 2010. On September 30, 2010, we filed a complaint in the United States District Court for the Northern District of California against UTAC Taiwan Corporation alleging breach of contract, breach of the covenant of good faith and fair dealing, and seeking declaratory relief. On October 1, 2010, we filed a patent infringement lawsuit against Sony and Renesas Electronics Corporation in the United States District Court for the District of Delaware. Both of these cases remain in their preliminary phases.
Finally, as part of our ongoing efforts to strengthen and improve the U.S. patent system, we are preparing an amicus brief in the Microsoft v. i4i case currently before the U.S. Supreme Court. The central issue in the case is whether a longstanding legal rule – that litigation challenges to the validity of patents must be proved by clear and convincing evidence – will survive, as we believe it should. We believe that innovation protected by patents is one of our nation’s most important resources and are involved in this case to do our part to ensure that America’s historically unique system of monetizing invention through patents will remain intact. Our brief in support of i4i is due on March 18, 2011.
Safe Harbor Statement
This document contains forward-looking statements, which are made pursuant to the safe harbor provisions of the Private Securities Litigation Reform Act of 1995. Forward-looking statements involve risks and uncertainties that could cause actual results to differ significantly from those projected, particularly with respect to the company’s financial results whether for the full year of 2010 or otherwise, the impact of the reorganization of our Imaging & Optics segment, the size of market opportunities, growth of the company’s served markets, industry and technology trends, use of the company’s technology in additional applications, impact of volume pricing adjustments in our Micro-electronics segment and revenue growth in our Imaging & Optics segment, future investment and development resources, the expansion of the company’s intellectual property portfolios, and the company’s IP protection efforts, including litigation. Material factors that may cause results to differ from the statements made include delays, setbacks or losses relating to our intellectual property or intellectual property litigations, or any invalidation or limitation of our key patents; fluctuations in our operating results due to the timing of new license agreements and royalties, or due to legal costs; changes in patent laws, regulation or enforcement, or other factors that might affect our ability to protect our intellectual property; the risk of a decline in demand for semiconductor products; failure by
13
the industry to adopt our technologies; competing technologies; the future expiration of our patents; the future expiration of our license agreements and the cessation of related royalty income; the failure or refusal of licensees to pay royalties; failure to achieve the growth prospects and synergies expected from acquisition transactions; and delays and challenges associated with integrating acquired companies with our existing businesses. You are cautioned not to place undue reliance on the forward-looking statements, which speak only as of the date of this release. Tessera’s filings with the Securities and Exchange Commission, including its Annual Report on Form 10-K for the year ended Dec. 31, 2009, and Form 10-Q for the quarter ended September 30, 2010 include more information about factors that could affect the company’s financial results. Tessera assumes no obligation to update information contained in this press release. Although this release may remain available on Tessera’s website or elsewhere, its continued availability does not indicate that Tessera is reaffirming or confirming any of the information contained herein.
Non-GAAP Financial Measures
In addition to disclosing financial results calculated in accordance with U.S. generally accepted accounting principles (GAAP), this document contains non-GAAP financial measures adjusted for either one-time or ongoing non-cash acquired intangibles amortization charges, acquired in-process research and development, all forms of stock-based compensation, impairment charges on long-lived assets, and related tax effects. The non-GAAP financial measures also exclude the effects of FASB Accounting Standards Codification Topic 718 – Stock Compensation upon the number of diluted shares used in calculating non-GAAP earnings per share. Management believes that the non-GAAP measures used in this report provide investors with important perspectives into the company’s ongoing business performance. The non-GAAP financial measures disclosed by the company should not be considered a substitute for, or superior to, financial measures calculated in accordance with GAAP, and the financial results calculated in accordance with GAAP and reconciliations to those financial statements should be carefully evaluated. The non-GAAP financial measures used by the company may be calculated differently from, and therefore may not be comparable to, similarly titled measures used by other companies.
14