Attached files
| file | filename |
|---|---|
| 8-K - FORM 8-K - SUSQUEHANNA BANCSHARES INC | d8k.htm |
| EX-2.1 - MERGER AGREEMENT - SUSQUEHANNA BANCSHARES INC | dex21.htm |
| EX-99.1 - PRESS RELEASE - SUSQUEHANNA BANCSHARES INC | dex991.htm |
 1
Strategic acquisition
of Abington Bancorp
January 27, 2011 |
 Forward-looking statements
During the course of this conference call, we may make projections and other
forward-looking statements regarding events, the future financial performance
of
Susquehanna
and
the
impact
of
the
acquisition
on
Susquehanna,
and
its
business and financial operations. We wish to caution you that these
forward- looking statements may differ materially from actual results
due to a number of
risks and uncertainties. For a more detailed description of the
factors that may
affect Susquehanna’s operating results, we refer you to our filings with the
Securities & Exchange Commission, including our quarterly report
on Form 10-
Q for the quarter ended September 30, 2010, and our annual report on Form
10-K for the year ended December 31, 2009. Susquehanna assumes no
obligation to update the forward-looking statements made during this
presentation.
For more information, please visit our Web site at:
www.susquehanna.net
2 |
 Transaction highlights
Strong Strategic
Rationale
Attractive Financial
Returns
Low Risk
Low-risk fill-in acquisition of an in-market community bank in
Montgomery and Bucks counties
—
Adds 20 branches and $900mm of deposits; no branch overlap
Strengthens presence in attractive Montgomery and Delaware counties and provides
entry into Bucks County
—
Top
10
market
share
in
Montgomery
County
–
20
th
wealthiest
in
U.S.
—
3 counties rank among top 5 highest HHI in PA
Tremendous opportunity for deposit, loan and fee income growth
—
Wealth management and insurance subsidiaries (Valley Forge, Stratton, and
Addis) located in Montgomery County with strong customer contacts
—
Expand Susquehanna’s in-market mortgage origination capability
—
Potential for commercial loan growth
20% IRR
100bps accretive to Tier I common at close
Breakeven to 2012 EPS, without considering benefits of excess capital
Comprehensive due diligence process
In-market transaction with similar demographics
Proven track record of integrating acquisitions
3 |
 Consideration:
100% Stock
Stock consideration at a fixed exchange ratio of 1.3200x of
Susquehanna common stock for each share of Abington
Transaction value:¹
$268mm
Price per share:¹
$12.80 / Premium to closing price 10.3%
Board composition:
ABBC receives 1 seat on the pro forma 15 member Board of
Directors
Due diligence:
Completed
Management
Bob White (CEO) will take a senior leadership role in Delaware
Valley division and be appointed to a Susquehanna Board
position
Required approval:
Regulatory approval required for both companies
Shareholder approval required for both companies
Termination fee:
$11.0mm
Anticipated closing:
3Q2011
Transaction overview
Transaction overview
4
1
As of January 26
th
, 2011; based on diluted shares of 20.9mm |
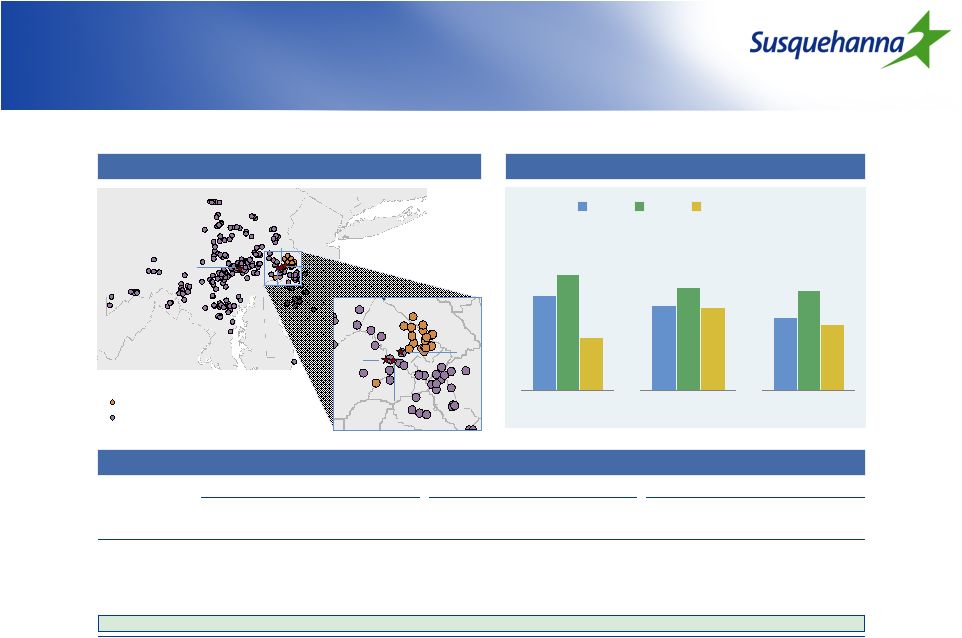  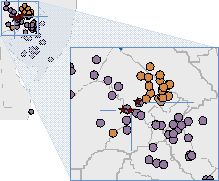 Expands
Susquehanna into attractive markets
Expands Susquehanna into attractive
markets
SUSQ
ABBC
Projected population
change 2010-2015
Pennsylvania
Projected HH income
change 2010-2015
Median HH income
2010 ($000)
Source: SNL Financial
Note: Branch and deposit data as of June 2010
0.9%
1.1%
0.5%
13.3%
16.4%
13.6%
$52.7
$79.7
$58.6
ABBC (20 branches)
SUSQ (221 branches)
NJ
DE
PA
VA
WV
MD
Bucks
Montgomery
Chester
Philadelphia
Delaware
Susquehanna
Bank
Valley
Forge
Addis
Group
Stratton Management
Susquehanna
Abington
Pro forma
Deposit mkt
Deposit mkt
Deposit mkt
Market
Deposits
share
Market
Deposits
share
Market
Deposits
share
rank
Branches
($mm)
(%)
rank
Branches
($mm)
(%)
rank
Branches
($mm)
(%)
Montgomery, PA
18
6
$271
1.2%
8
14
$728
3.3%
7
20
$999
4.6%
Bucks, PA
-
-
-
-
22
5
155
1.1%
22
5
155
1.1%
Delaware, PA
16
3
138
1.2%
29
1
31
0.3%
14
4
169
1.5%
All other counties
212
8,723
0
0
212
8,723
Pro forma franchise
221
$9,132
20
$913
241
$10,045
5
S.M
A.G
V.F
SUSQ / ABBC branch map
Susquehanna Demographics
Pro forma market share by county |
 Improved scale in Pennsylvania
Deposits
Dep. Market share
Rank
Name
Branches
($mm)
(%)
1
PNC
512
$58,206
20.4%
2
Wells Fargo
293
37,198
13.0%
3
Royal Bank of Scotland
385
22,214
7.8%
4
Toronto-Dominion
94
9,632
3.4%
5
Banco Santander
170
8,722
3.1%
6
M&T
208
8,385
2.9%
7
Bank of America
104
7,530
2.6%
8
Bank of New York Mellon
6
7,382
2.6%
9
Fulton
138
7,137
2.5%
10
First Niagara
149
6,909
2.4%
11
F.N.B.
238
6,866
2.4%
12
Pro forma
166
6,646
2.3%
12
National Penn
130
6,365
2.2%
13
Susquehanna
146
5,733
2.0%
14
Northwest Bancshares
142
5,019
1.8%
15
First Commonwealth
115
4,750
1.7%
34
Abington
20
913
0.3%
Source: SNL Financial
Note: Deposit data as of June 30, 2010
6
Rank
Name
Branches
Deposits
($000)
Dep. Market share
(%)
1
Wells Fargo
43
$3,865,720
17.56
2
Royal Bank of Scotland
44
2,709,841
12.31
3
Toronto-Dominion
24
2,515,432
11.42
4
PNC
27
1,761,413
8.00
5
First Niagara
34
1,604,457
7.29
6
Univest Corp. of Pennsylvania
21
1,260,512
5.73
7
Pro Forma
20
998,739
4.52
7
Firstrust Savings
7
758,387
3.44
8
Abington
14
727,541
3.30
9
Banco Santander
18
667,191
3.03
10
Bryn Mawr
5
600,401
2.73
11
Bank of America
24
571,458
2.60
12
National Penn
11
518,420
2.35
13
Harleysville
7
515,641
2.34
14
Royal Bancshares of PA
6
427,010
1.94
15
Beneficial Mutual (MHC)
9
406,490
1.85
18
Susquehanna (PA)
6
271,198
1.22
Rank
Name
Branches
Deposits
($000)
Dep. Market share
(%)
1
Wells Fargo
36
$3,018,692
20.87
2
Toronto-Dominion
19
1,679,284
11.61
3
Royal Bank of Scotland
22
1,282,006
8.86
4
PNC
17
865,227
5.98
5
FSB Mutual Holdings
12
700,691
4.84
6
FNB Bancorp
16
632,592
4.37
7
Banco Santander
9
588,628
4.07
8
Bank of America
12
518,472
3.58
9
First FS&LA of Bucks County
10
467,897
3.23
10
QNB Corp.
8
452,037
3.12
11
National Penn
11
431,046
2.98
12
First Niagara
10
379,987
2.63
13
Fulton
6
373,195
2.58
14
Univest Corp. of Pennsylvania
19
359,174
2.48
15
Firstrust Savings
5
279,495
1.93
22
Abington
5
154,664
1.07
Delaware
County
pro
forma
ranked
14
th
, with 4
branches and $169mm deposits
3
rd
largest independent bank headquartered in Pennsylvania
Deposit market share in Pennsylvania
Deposit market share in Montgomery, PA
Deposit market share in Bucks, PA |
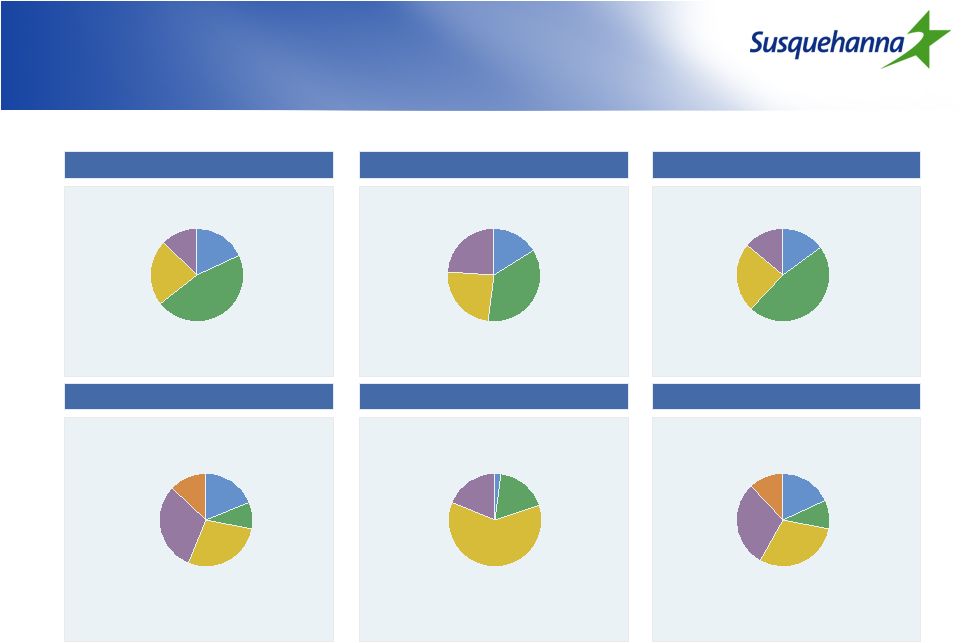 Pro
forma loan and deposit composition
Pro forma loan and deposit
composition
Total deposits = $9,191mm
Cost of int. bearing deposits = 1.13%
Total deposits = $900mm
Cost of int. bearing deposits = 1.51%
Total deposits = $10,091mm
+
=
Total loans = $9,633mm
Yield = 5.55%
Loans / deposits = 105%
Source: SNL Financial; Financial data as of December 31, 2010
Retail time
24%
MMDA & Savings
48%
Jumbo time
13%
Transaction
15%
Retail time
24%
MMDA & Savings
36%
Jumbo time
24%
Transaction
16%
Retail time
24%
MMDA & Savings
47%
Jumbo time
14%
Transaction
15%
Commercial financial &
agriculture
19%
Real estate -
commercial
31%
Consumer & leases
13%
Real estate -
residential
28%
Total loans = $701mm
Yield = 5.45%
Loans / deposits = 78%
Commercial financial &
agriculture
2%
Real estate -
Commercial
19%
Real estate -
construction
18%
Real estate -
residential
61%
Total loans = $10,334mm
Loans / deposits = 102%
Commercial financial &
agriculture
18%
Real estate -
construction
10%
Real estate -
residential
30%
Consumer & leases
12%
Real estate -
commercial
30%
Real estate -
construction
9%
SUSQ deposits
ABBC deposits
Pro forma deposits
SUSQ loans
ABBC loans
Pro forma loans
+
=
7 |
 Pro-forma financial impact
Attractive
financial
returns:
20% IRR
60 bps accretive to TCE and 100bps to Tier I common
Breakeven
accretive
in
2012
without
considering
any
benefit
from
excess
capital
Tangible book value dilution less than 2%
Strong
pro-forma
capital
position
(approximately
$95mm
capital
accretive):
Assumptions:
Cost savings of $8.1mm or 31%¹, phased in 50% in 2011 and 100% in 2012
One time pre-tax restructuring charge of $21mm
CDI of 1.5%, amortized straight-line over 10 years; goodwill of approximately
$66mm 8
12/31/2010
Actual (%)
Pro forma (%)
TCE/TA
7.6%
8.2%
Tier I common
9.6%
10.6%
Tier I
12.7%
13.5%
¹
Excluding stock based compensation expenses, core cost synergies are approximately
24% of non interest expenses |
 Financial impact –
cost saves
Financial impact –
cost saves
($mm)
Cost savings are approximately 31% of non-interest expense¹
No branch closures are assumed
Compensation and Benefits
$5.2
Systems and technology
1.8
Professional fees
0.8
Marketing & other
0.3
Total cost saves (pre-tax)
$8.1
One-time restructuring charge (pre-tax)
$21.2
9
¹
Excluding stock based compensation expenses, core cost synergies are approximately
24% of non interest expenses |
 Comprehensive due diligence
10
Extensive
bottoms
–
up
diligence
approach
Comprehensive loan review completed by our credit team
—
Analyzed underwriting standards and credit files
—
Reviewed Top 25 relationships
—
100% of substandard loans over $1mm
—
100% of other real estate owned (OREO)
—
Analyzed 40% of residential mortgage portfolio, and applied Susquehanna’s
risk rating method to determine marks Total loans
Credit mark
($mm)
$mm
$mm
% of loans
Real Estate Residential
$393
$1
0.4%
Real Estate Commercial
141
11
8.0%
Construction Loans
108
17
15.3%
Consumer Loans
41
1
2.5%
Commercial & Industrial Loans
17
1
5.4%
Total loans
$701
$31
4.4%
2008 - Q4'2010 Losses (NCO's)¹
$27
3.9%
Cumulative losses through cycle (since 2008)¹
$58
8.5%
¹ As a % of 2007 gross loans |
 Pricing metrics
11
Based on Jan. 26, 2011
(Announcement date)
Based on Jan. 25, 2011
1 day
1 day
5 - day average
Deal price per share ($)
$12.80
$13.04
$13.16
Implied premium (%)
10.3%
13.8%
14.8%
Price / 4Q net income annualized (incl. synergies)¹
20.5x
20.9x
21.1x
Price / Tangible book value
1.22x
1.24x
1.25x
Price / Adjusted tangible book value²
1.33x
1.35x
1.37x
Core deposit premium³
8.2%
9.0%
9.4%
Memo:
Susquehanna price per share ($)
$9.70
$9.88
$9.97
Financial information as of December 31, 2010
¹Include $8.1mm of pre-tax synergies
²Adjusted for credit marks of $31mm and loan loss reserve of $4mm
³ Core deposits of $680 excludes time deposits >$100mm |
 Summary
12
Low-risk, fill-in transaction expanding Susquehanna’s footprint into
highly attractive demographic markets
Significant opportunity for deposit, loan, and fee income generation
by delivering on Susquehanna’s full-service platform to wealthy
markets
Capital accretive transaction; potential to drive earnings accretion
through deployment of excess capital |
 13
4
th
Quarter earnings update |
 14
Questions & answers |