Attached files
| file | filename |
|---|---|
| 8-K - POLARIS INDUSTRIES INC. 8-K - Polaris Inc. | a6587696.htm |
| EX-99.1 - EXHIBIT 99.1 - Polaris Inc. | a6587696_ex991.htm |
Exhibit 99.2

Fourth Quarter & Fiscal Year 2010 Earnings Results – January 27, 2011 Polaris Industries Inc.
2 Safe Harbor Except for historical information contained herein, the matters set forth in this document, including but not limited to management’s expectations regarding 2011 sales, shipments, net income, cash flow, and manufacturing realignment transition costs and savings, are forward-looking statements that involve certain risks and uncertainties that could cause actual results to differ materially from those forward-looking statements. Potential risks and uncertainties include such factors as product offerings, promotional activities and pricing strategies by competitors; manufacturing realignment transition costs; warranty expenses; impact of changes in Polaris stock prices on incentive compensation; foreign currency exchange rate fluctuations; environmental and product safety regulatory activity; effects of weather; commodity costs; uninsured product liability claims; uncertainty in the retail and wholesale credit markets; changes in tax policy and overall economic conditions, including inflation, consumer confidence and spending and relationships with dealers and suppliers. Investors are also directed to consider other risks and uncertainties discussed in our 2009 annual report and Form 10-K filed by the Company with the Securities and Exchange Commission. The Company does not undertake any duty to any person to provide updates to its forward-looking statements. The data source for retail sales figures included in this presentation is registration information provided by Polaris dealers in North America and compiled by the Company or Company estimates. The Company must rely on information that its dealers supply concerning retail sales, and other retail sales data sources and this information is subject to revision. Jan 2011
Scott Wine CEO Fourth Quarter & Fiscal Year 2010 Earnings Results January 27, 2011
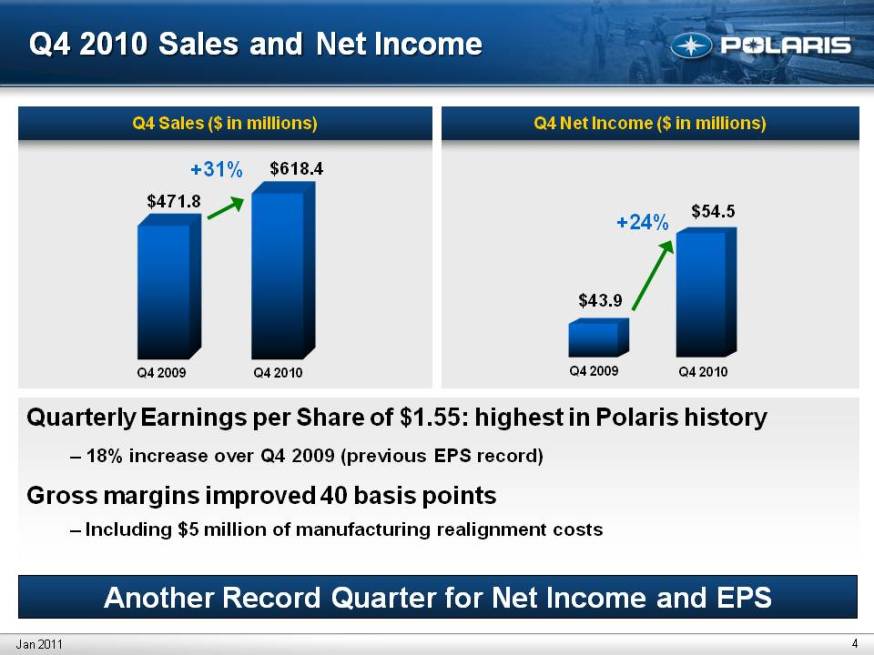
4 Q4 2010 Sales and Net Income Another Record Quarter for Net Income and EPS Q4 Net Income ($ in millions Q4 Sales ($ in millions) $43.9 $54.5 +24% $471.8 $618.4 +31% Jan 2011 Q4 2010 Q4 2009 Q4 2010 Q4 2009 Quarterly Earnings per Share of $1.55: highest in Polaris history – 18% increase over Q4 2009 (previous EPS record) Gross margins improved 40 basis points – Including $5 million of manufacturing realignment costs
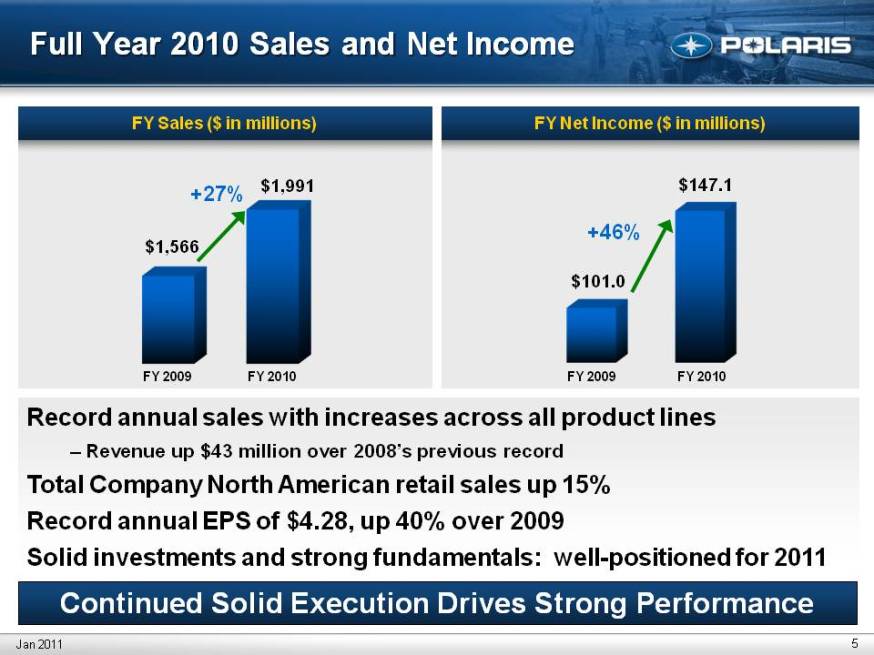
5 Continued Solid Execution Drives Strong Performance Full Year 2010 Sales and Net Income FY Net Income ($ in millions) FY Sales ($ in millions)$101.0 $147.1 +46% $1,566 $1,991 +27% Jan 2011 FY 2010 FY 2009 FY 2010 FY 2009 Record annual sales with increases across all product lines – Revenue up 43 million over 2008’s previous record Total Company North American retail sales up 15% Record annual EPS of $4.28, up 40% over 2009 Solid investments and strong fundamentals: well-positioned for 2011
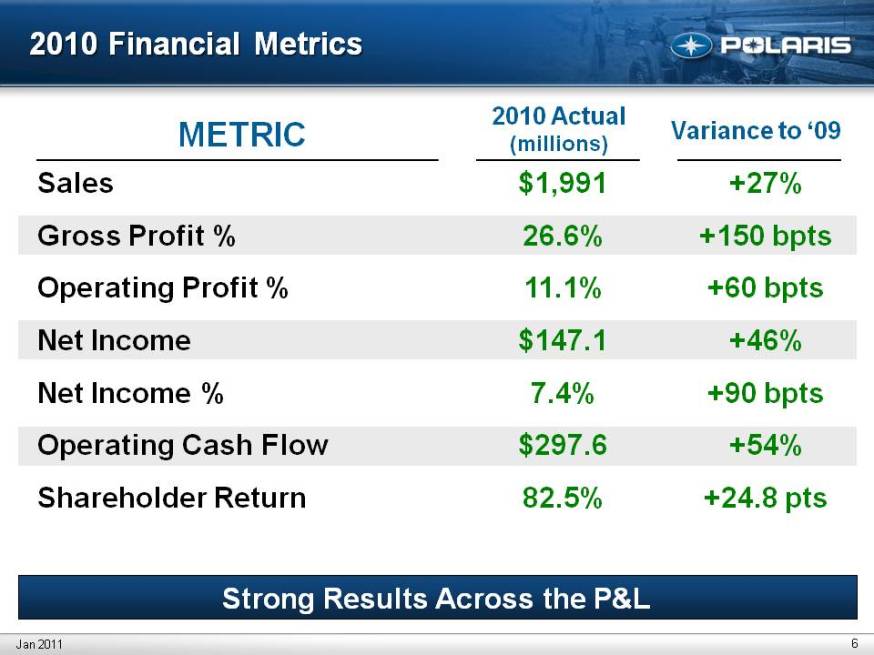
2010 Financial Metrics 6 Sales Gross Profit % Operating Profit % Net Income Net Income % Operating Cash Flow Shareholder Return $1,991 26.6% 11.1% $147.1 7.4% $297.6 82.5% METRIC 2010 Actual (millions)Jan 2011 Variance to ’09 +27% +150 bpts +60 bpts +46% +90 bpts +54% +24.8 pts (Gp:) Strong Results Across the P&L
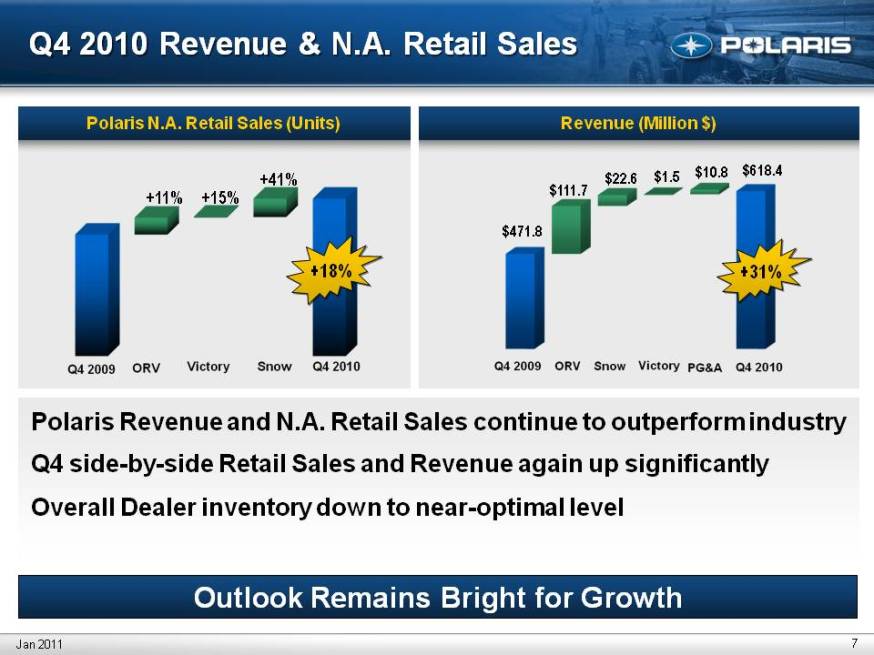
7 Q4 2010 Revenue & N.A. Retail Sales Outlook Remains Bright for Growth Revenue (Million $) Polaris N.A. Retail Sales (Units) $471.8 $111.7 $22.6 $1.5 $10.8 $618.4 +18% +11% +15% +41% +31% Jan 2011 Polaris Revenue and N.A. Retail Sales continue to outperform industry Q4 side-by-side Retail Sales and Revenue again up significantly Overall Dealer inventory down to near-optimal level
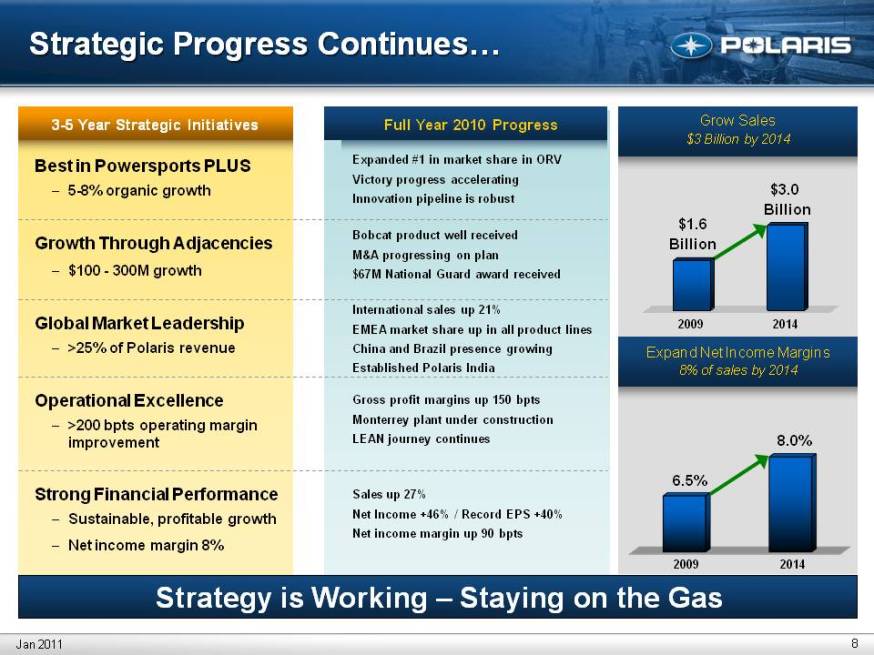
Strategic Progress Continues … 8 Jan 2011 $1.6 Billion $3.0 Billion Grow Sales $3 Billion by 2014 Expand Net Income Margins 8% of sales by 2014 Strategy is Working – Staying on the Gas Full Year 2010 Progress 3-5 Year Strategic Initiatives Best in Powersports PLUS 5-8% organic growth Growth Through Adjacencies $100 - 300M growth Global Market Leadership >25% of Polaris revenue Operational Excellence >200 bpts operating margin improvement Strong Financial Performance Sustainable, profitable growth Net income margin 8% Sales up 27% Net Income +46% / Record EPS +40% Net income margin up 90 bpts Expanded #1 in market share in ORV Victory progress accelerating Innovation pipeline is robust Bobcat product well received M&A progressing on plan $67M National Guard award received International sales up 21% EMEA market share up in all product lines China and Brazil presence growing Established Polaris India Gross profit margins up 150 bpts Monterrey plant under construction LEAN journey continues 6.5% 8.0% 2009 2009 2014 2014
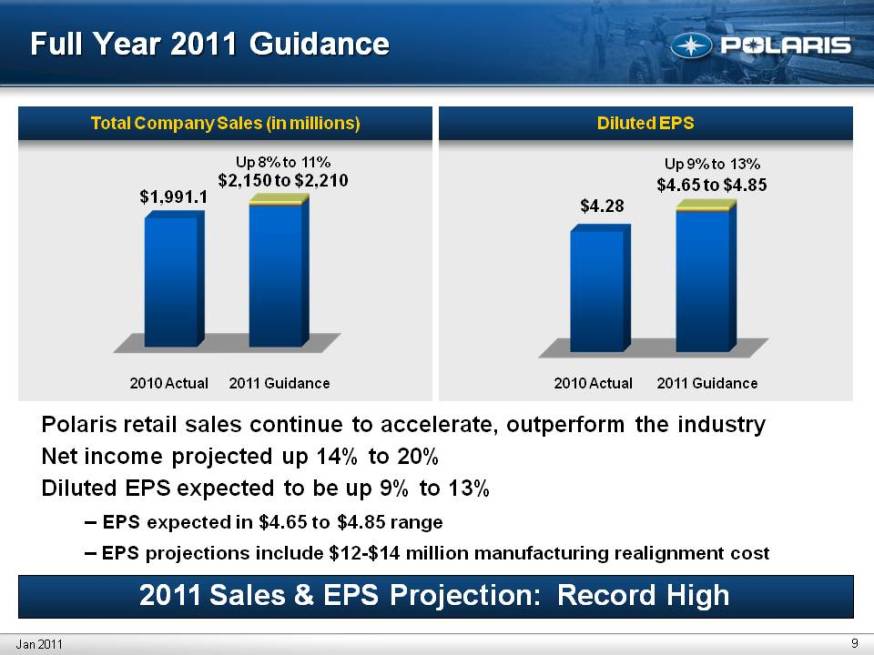
Total Company Sales (in millions)Diluted EPS Full Year 2011 Guidance 9 $1,991.1 Up 8% to 11% $2,150 to $2,210 2010 Actual 2011 Guidance $4.28 Up 9% to 13% $4.65 to $4.85 2010 Actual 2011 Guidance 2011 Sales & EPS Projection: Record High Polaris retail sales continue to accelerate, outperform the industry Net income projected up 14% to 20% Diluted EPS expected to be up 9% to 13% – EPS expected in $4.65 to $4.85 range – EPS projections include $12-$14 million manufacturing realignment cost Jan 2011
Bennett Morgan President & COO Fourth Quarter & Fiscal Year 2010 Earnings Results January 27, 2011
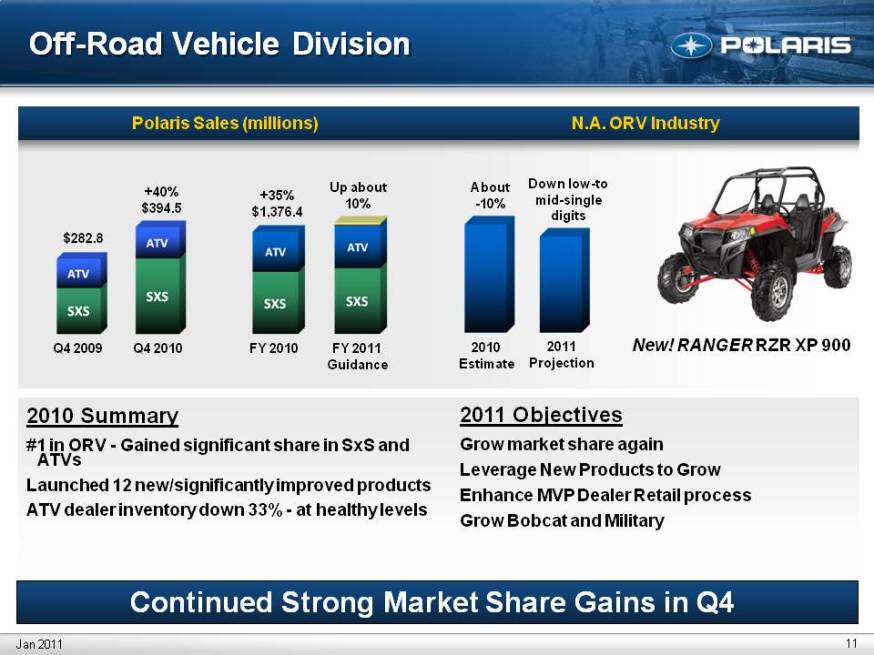
11 Off-Road Vehicle Division New! RANGER RZR XP 900 Polaris Sales (millions) FY 2011 Guidance FY 2010 Q4 2010 Q4 2009 $282.8 +35% $1,376.4 +40% $394.5 Up about 10% Jan 2011 2010 Summary #1 in ORV – Gained significant share in SxS and ATVs Launched 12 new/significantly improved products ATV dealer inventory down 33% - at healthy levels 2011 Objectives Grow market share again Leverage New Products to Grow Enhance MVP Dealer Retail process Grow Bobcat and Military 2011 Projection 2010 Estimate About -10% Down low-to mid-single digits N.A. ORV Industry Continued Strong Market Share Gains in Q4
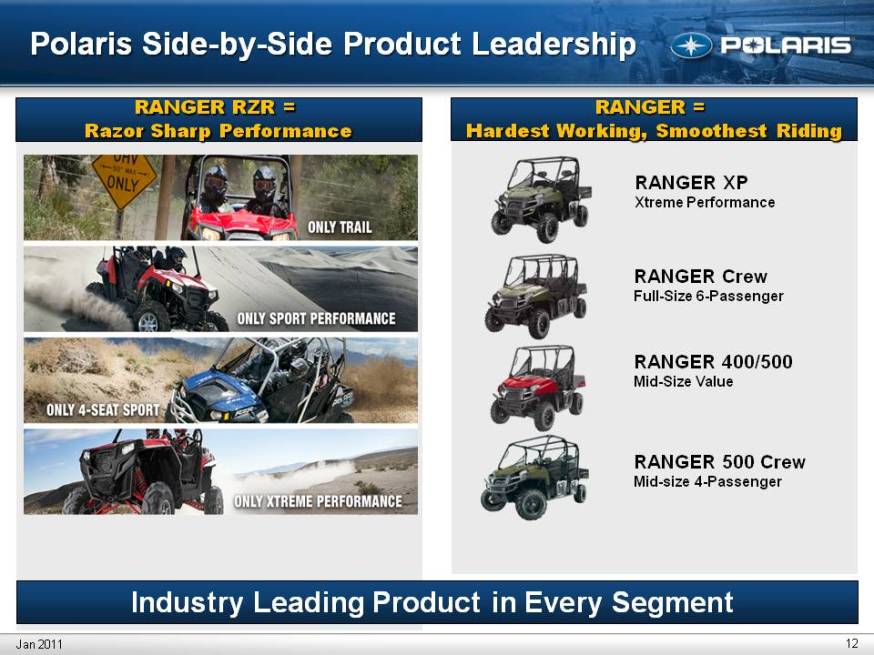
RANGER RZR = Razor Sharp Performance RANGER = Hardest Working, Smoothest Riding RANGER XP Xtreme Performance RANGER Crew Full-Size 6-Passenger RANGER 400/500 Mid-Size Value RANGER 500 Crew Mid-size 4-Passenger Industry Leading Product in Every Segment Polaris Side-by-Side Product Leadership 12 Jan 2011 Only Trail Only Sport Performance Only 4-Seat Sport Only Xtreme Performance
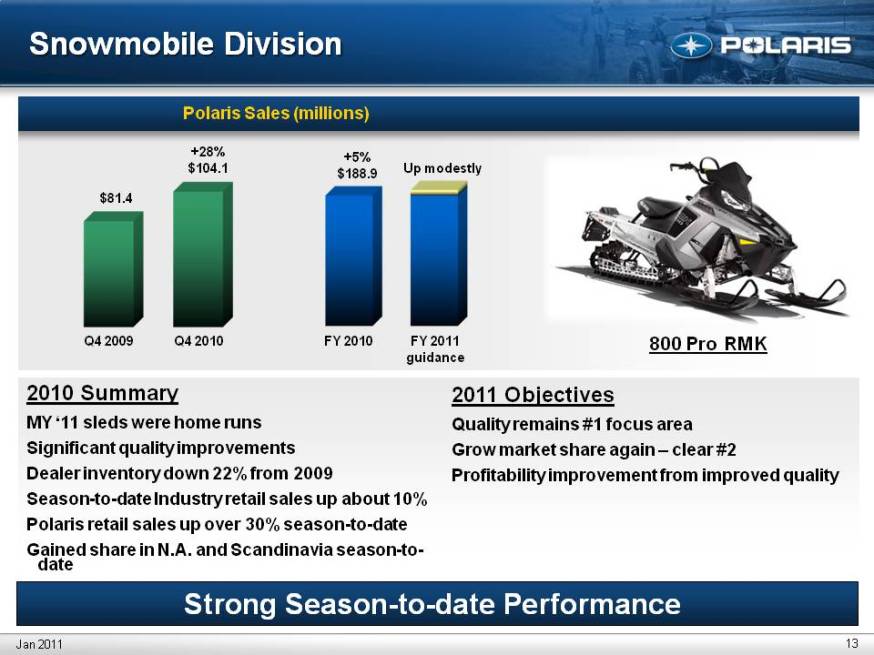
13 Snowmobile Division $81.4 +28% $104.1 FY 2011 guidance +5% $188.9 Up modestly FY 2010 Q4 2010 Q4 2009 Polaris Sales (millions) Jan 2011 2010 Summary MY ‘11 sleds were home runs Significant quality improvements Dealer inventory down 22% from 2009 Season-to-date Industry retail sales up about 10% Polaris retail sales up over 30% season-to-date Gained share in N.A. and Scandinavia season-to-date 2011 Objectives Quality remains #1 focus area Grow market share again – clear #2 Profitability improvement from improved quality Strong Season-to-date Performance 800 Pro RMK
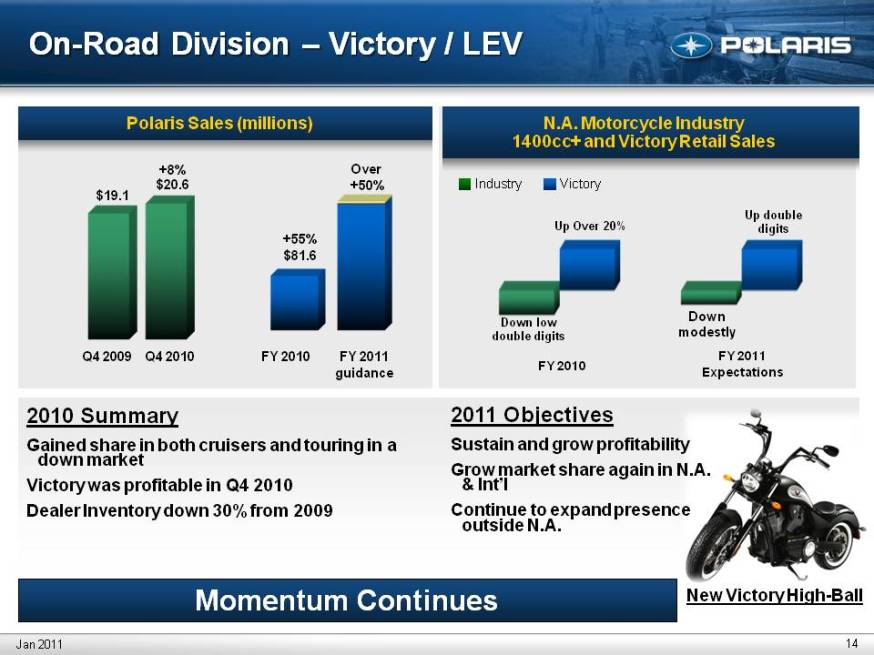
14 Momentum Continues Polaris Sales (millions) On-Road Division – Victory / LEV $19.1 +8% $20.6 +55% $81.6 Over +50% Up double digits (Gp:) Victory (Gp:) Industry Down modestly N.A. Motorcycle Industry 1400cc+ and Victory Retail Sales FY 2011 guidance FY 2010 Q4 2010 Q4 2009 Jan 2011 2010 Summary Gained share in both cruisers and touring in a down market Victory was profitable in Q4 2010 Dealer Inventory down 30% from 2009 2011 Objectives Sustain and grow profitability Grow market share again in N.A. & Int’l Continue to expand presence outside N.A. Down low double digits Up Over 20% FY 2010 FY 2011 Expectations New Victory High-Ball
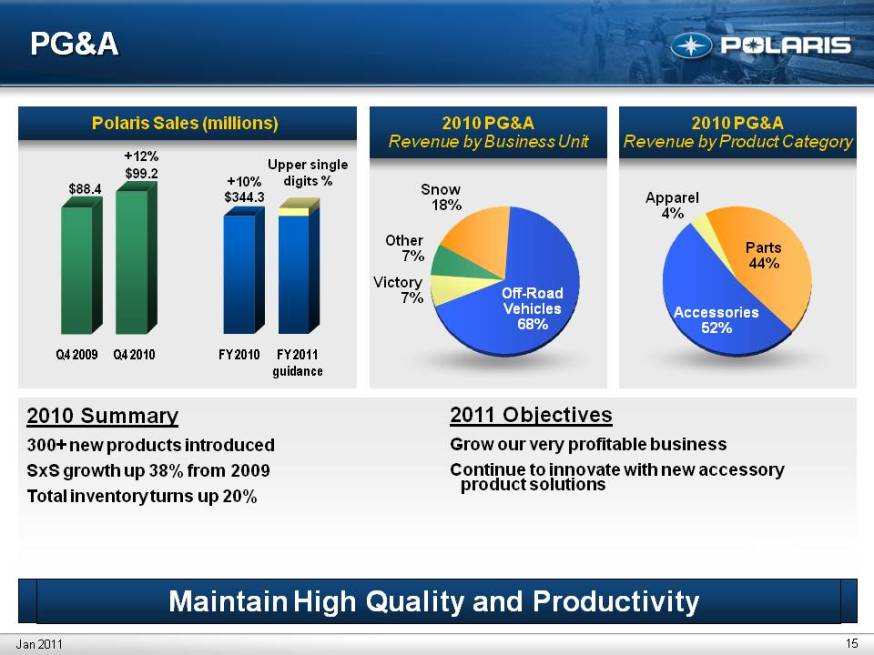
15 PG&A Maintain High Quality and Productivity Polaris Sales (millions) 2010 PG&A Revenue by Business Unit 2010 PG&A Revenue by Product Category Other 7% Aus/NZ 13% Snow 18% Off-Road Vehicles 68% Parts 44% Accessories 52% Apparel 4% Victory 7% $88.4 +12% $99.2 FY 2011 guidance FY 2010 Q4 2010 Q4 2009 +10% $344.3 Jan 2011 2010 Summary 300+ new products introduced SxS growth up 38% from 2009 Total inventory turns up 20% 2011 Objectives Grow our very profitable business Continue to innovate with new accessory product solutions Upper single digits %
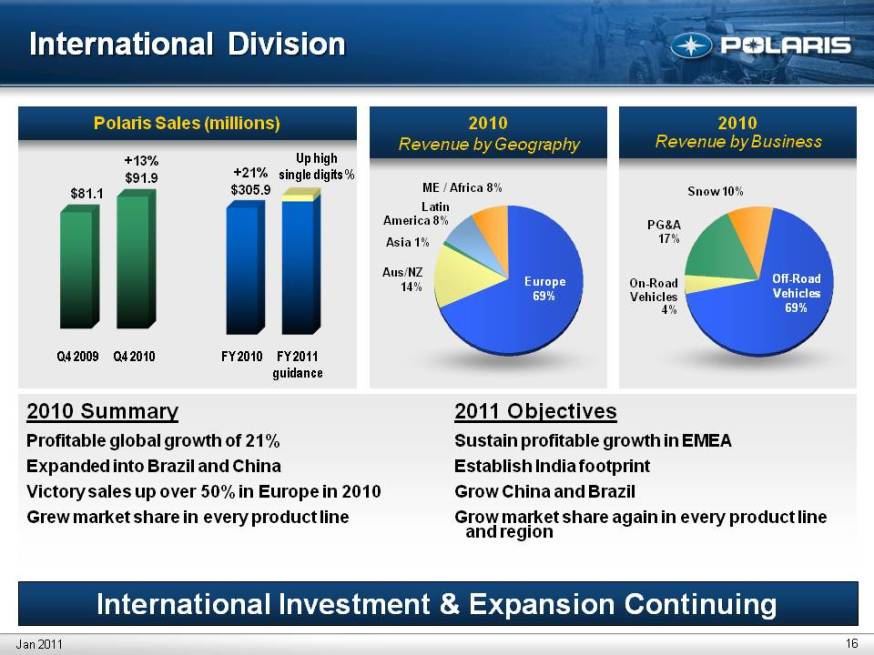
16 International Investment & Expansion Continuing International Division $81.1 +13% $91.9 +21% $305.9 Polaris Sales (millions)2010 Revenue by Geography 2010 Revenue by Business FY 2011 guidance FY 2010 Q4 2010 Q4 2009 ME / Africa 8% Latin America 8% Asia 1% Aus/NZ 14% Europe 69% Off-Road Vehicles 69% On-Road Vehicles 4% PG&A 17% Snow 10% Jan 2011 2010 Summary Profitable global growth of 21% Expanded into Brazil and China Victory sales up over 50% in Europe in 2010 Grew market share in every product line 2011 Objectives Sustain profitable growth in EMEA Establish India footprint Grow China and Brazil Grow market share again in every product line and region Up highsingle digits %
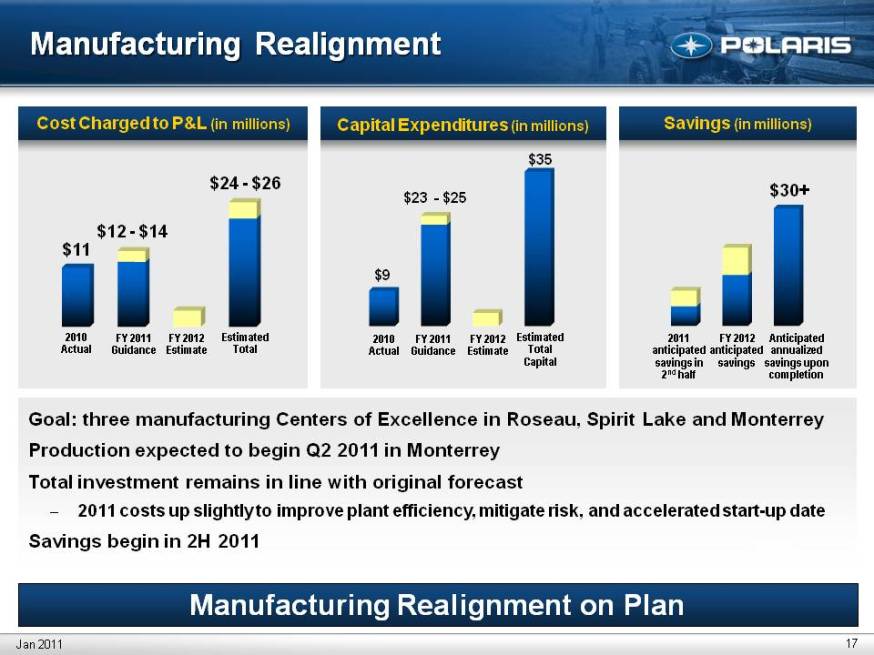
17 Manufacturing Realignment Goal: three manufacturing Centers of Excellence in Roseau, Spirit Lake and Monterrey Production expected to begin Q2 2011 in Monterrey Total investment remains in line with original forecast 2011 costs up slightly to improve plant efficiency, mitigate risk, and accelerated start-up date Savings begin in 2H 2011 Manufacturing Realignment on Plan Cost Charged to P&L (in millions) Aus/NZ 13% Capital Expenditures (in millions) Savings (in millions) Anticipated annualized savings upon completion 2011 anticipated savings in 2nd half $24 - $26 $12 - $14 $11 $35 $9 $30+ Estimated Total FY 2011 Guidance 2010 Actual Jan 2011 $23 - $25 FY 2012 Estimate FY 2012 anticipated savings Estimated Total Capital FY 2011 Guidance 2010 Actual FY 2012 Estimate
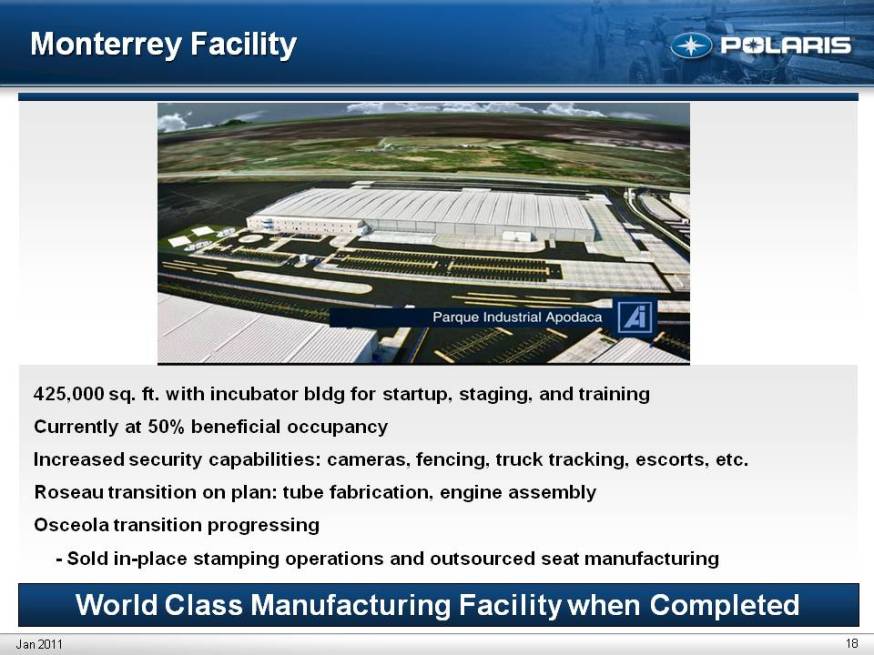
Monterrey Facility 425,000 sq. ft. with incubator bldg for startup, staging, and training Currently at 50% beneficial occupancy Increased security capabilities: cameras, fencing, truck tracking, escorts, etc. Roseau transition on plan: tube fabrication, engine assembly Osceola transition progressing - Sold in-place stamping operations and outsourced seat manufacturing Jan 2011 World Class Manufacturing Facility when Completed 18
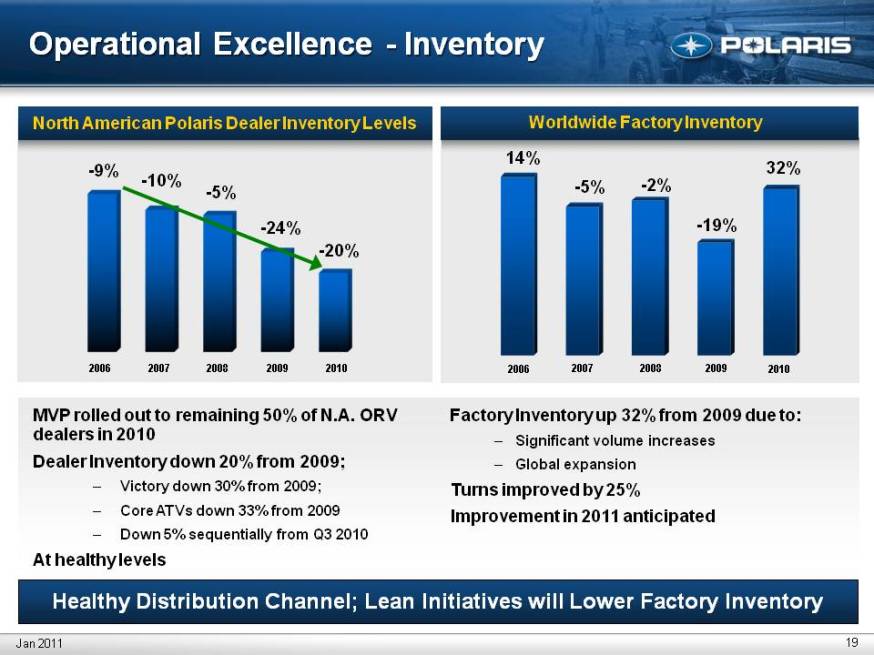
19 Operational Excellence – Inventory Healthy Distribution Channel; Lean Initiatives will Lower Factory Inventory North American Polaris Dealer Inventory Levels MVP rolled out to remaining 50% of N.A. ORV dealers in 2010 Dealer Inventory down 20% from 2009; Victory down 30% from 2009; Core ATVs down 33% from 2009 Down 5% sequentially from Q3 2010 At healthy levels Jan 2011 -20% -5% -10% 2006 2007 2008 2009 2010 -24% -9% 32% -2% -5% 2006 2007 2008 2009 2010 -19% 14% Worldwide Factory Inventory Factory Inventory up 32% from 2009 due to: Significant volume increases Global expansion Turns improved by 25% Improvement in 2011 anticipated
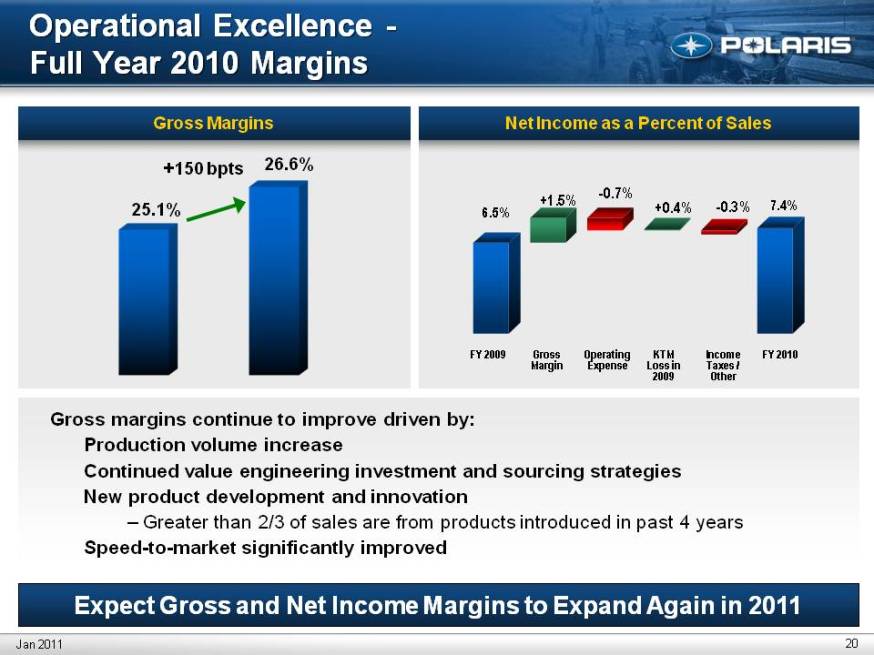
20 Operational Excellence - Full Year 2010 Margins Net Income as a Percent of Sales Gross Margins Gross Margin Operating Expense KTM Loss in 2009 Income Taxes /Other FY 2009 FY 2010 25.1% 26.6% 6.5% 7.4% +150 bpts Gross margins continue to improve driven by: Production volume increase Continued value engineering investment and sourcing strategies New product development and innovation – Greater than 2/3 of sales are from products introduced in past 4 years Speed-to-market significantly improved Jan 2011 Expect Gross and Net Income Margins to Expand Again in 2011

Mike Malone V.P. Finance and CFO Fourth Quarter & Fiscal Year 2010 Earnings Results January 27, 2011
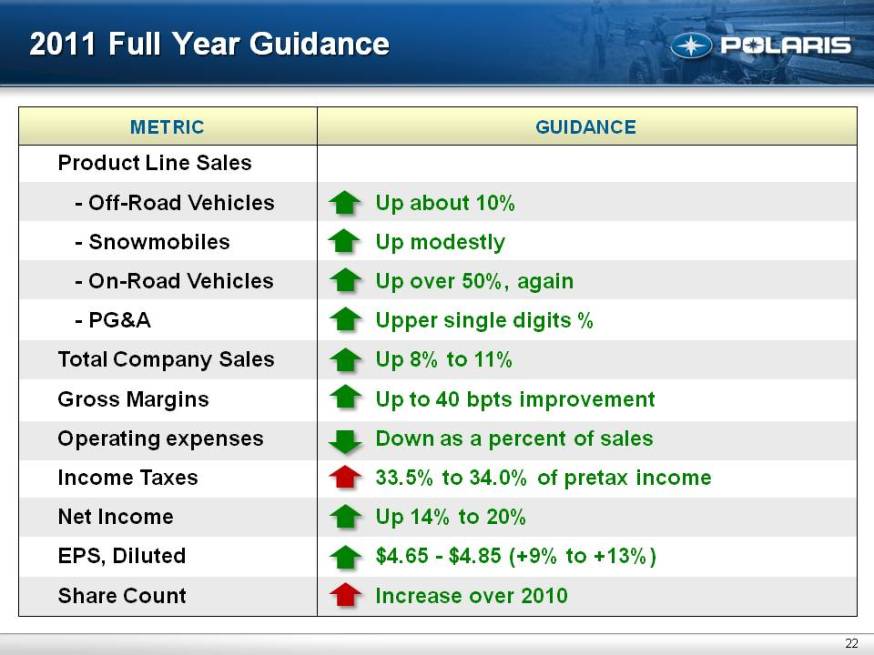
22 2011 Full Year Guidance Product Line Sales - Off-Road Vehicles Snowmobiles - On-Road Vehicles - PG&A Total Company Sales Gross Margins Operating expenses Income Taxes Net Income EPS, Diluted Share Count Up about 10% Up modestly Up over 50%, again Upper single digits %Up 8% to 11% Up to 40 bpts improvement Down as a percent of sales 33.5% to 34.0% of pretax income Up 14% to 20% $4.65 - $4.85 (+9% to +13%)Increase over 2010 METRIC GUIDANCE
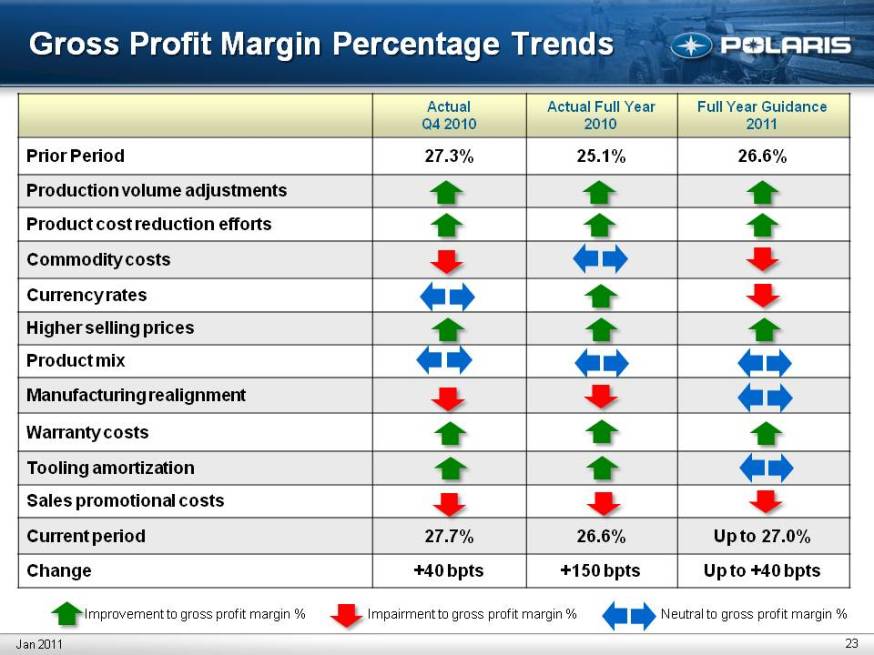
23 Gross Profit Margin Percentage Trends (Gp:) Improvement to gross profit margin % (Gp:) Impairment to gross profit margin % (Gp:) Neutral to gross profit margin % Jan 2011 Prior Period 27.3% 25.1% 26.6% Production volume adjustments Product cost reduction efforts Commodity costs Currency rates Higher selling prices Product mix Manufacturing realignment Warranty costs Tooling amortization Sales promotional costs Current period Change
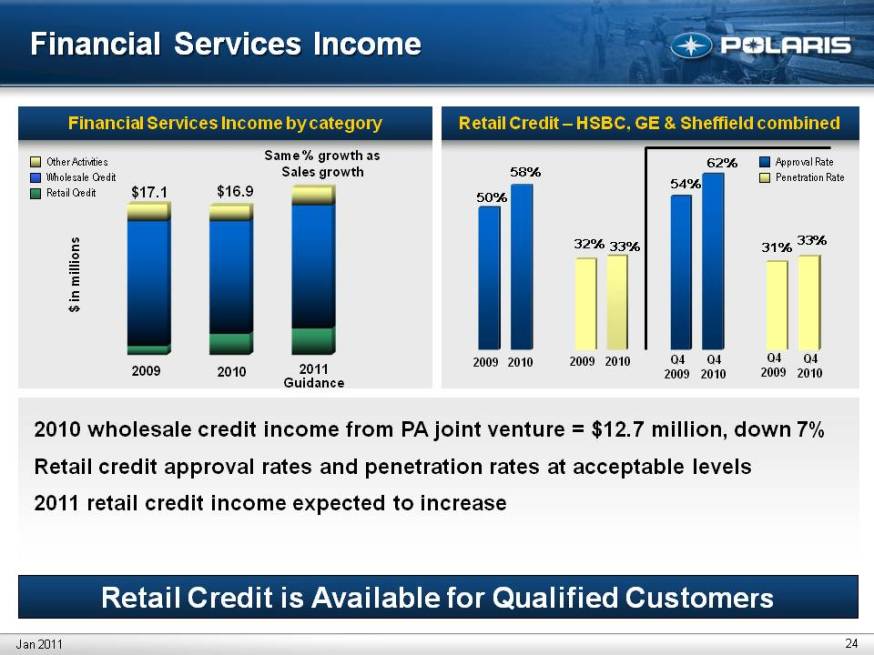
24 Financial Services Income Retail Credit is Available for Qualified Customers 2010 wholesale credit income from PA joint venture = $12.7 million, down 7% Retail credit approval rates and penetration rates at acceptable levels 2011 retail credit income expected to increase Retail Credit – HSBC, GE & Sheffield combined Financial Services Income by category Same % growth as Sales growth $17.1 $ in millions Other Activities Wholesale Credit Retail Credit Approval Rate Penetration Rate 2009 2010 2009 2010 Q4 2009 Q4 2010 Jan 2011 2011 Guidance $16.9 2009 2010 Q4 2009 Q4 2010
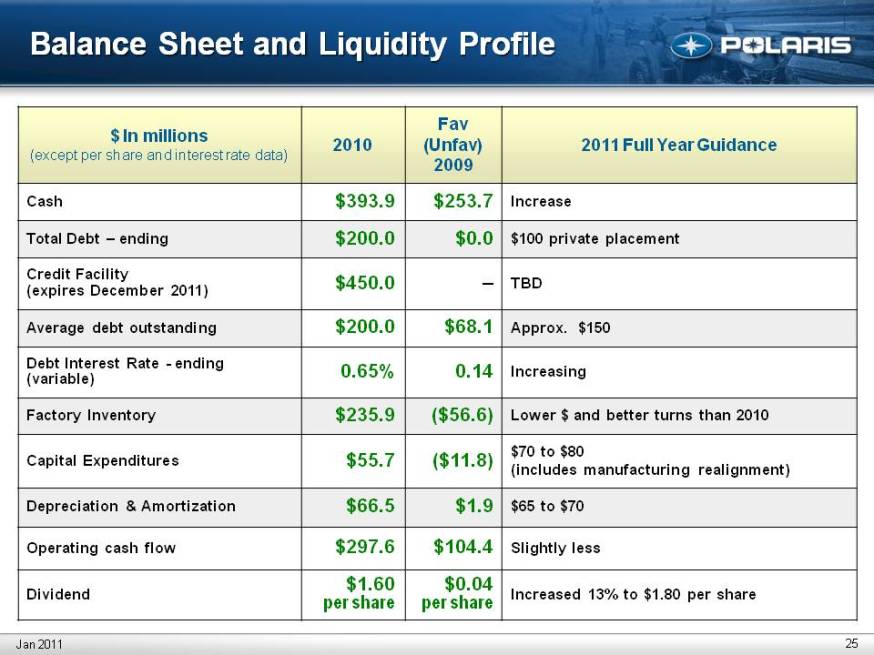
25 Balance Sheet and Liquidity Profile Jan 2011 $ In Millions (except per share and interest rate data) 2010 Fav (Unfav) 2009 2011 Full Year Guidance Cash Total Debt – ending Credit Facility (expires December 2011) Average debt outstanding Debt Interest Rate – ending (variable) Factory Inventory Capital Expenditures Depreciation & Amortization Operating cash flow Dividend Increa $100 private placement TBB – Approx. $150 Increasing Lower $ and better turns than 2010 $70 to $80 (includes manufacturing realignment) $65 to $70 Slightly less Increased 13% to $1.80 per share $393.9 $200.0 $450.0 $200.0 0.65% $235.9 $55.7 $66.5 $297.6 $1.60 per share $253.7 $0.0 $68.1 0.14 ($56.6) ($11.8) $1.9 $104.4 $0.04 per share

Scott Wine CEO Fourth Quarter & Fiscal Year 2010 Earnings Results January 27, 2011
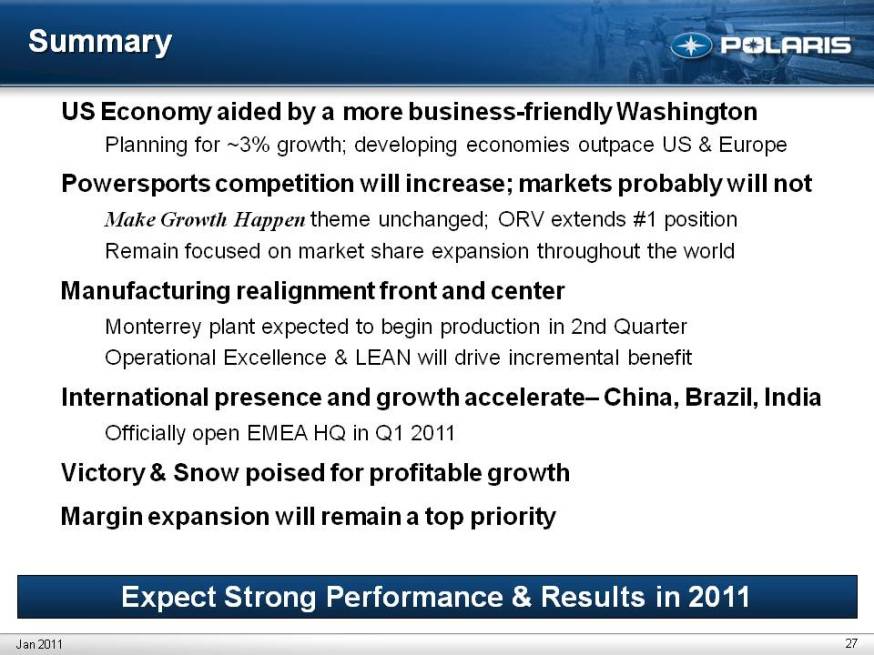
Summary 27 Jan 2011 US Economy aided by a more business-friendly Washington Planning for ~3% growth; developing economies outpace US & Europe Powersports competition will increase; markets probably will not Make Growth Happen theme unchanged; ORV extends #1 position Remain focused on market share expansion throughout the world Manufacturing realignment front and center Monterrey plant expected to begin production in 2nd Quarter Operational Excellence & LEAN will drive incremental benefit International presence and growth accelerate– China, Brazil, India Officially open EMEA HQ in Q1 2011 Victory & Snow poised for profitable growth Margin expansion will remain a top priority 27 Expect Strong Performance & Results in 2011
28 Thank you. Q & A Polaris Industries Inc. Jan 2011