Attached files
| file | filename |
|---|---|
| 8-K - FORM 8-K - Super Micro Computer, Inc. | d8k.htm |
| EX-99.1 - PRESS RELEASE - Super Micro Computer, Inc. | dex991.htm |
 2nd
Quarter Fiscal 2011 Earnings Conference Presentation
January 25, 2011
Exhibit 99.2 |
 2
Safe Harbor Statement
This presentation contains forward-looking statements within the meaning of
Section 27A of the Securities Act of 1933, as amended, and Section 21E of
the Securities Exchange Act of 1934, as amended. These forward-looking
statements may relate, among other things, to our expected financial
and operating results, our ability to build and grow Supermicro, the benefit of our products
and our ability to achieve our goals, plans and objectives.
Such forward-looking statements do not constitute guarantees of future
performance and are subject to a variety of risks and uncertainties that
could cause our actual results to differ materially from those anticipated.
These include, but are not limited to: our dependence on continued growth in the markets
for X86 based servers, blade servers and embedded applications, increased
competition, difficulties of predicting timing of new product
introductions, customer acceptance of new products, difficulties in
establishing and maintaining successful relationships with our distributors and
vendors, shortages or price fluctuations in our supply chain, our ability
to protect our intellectual property rights, our ability to control the
rate of expansion domestically and internationally, difficulty managing rapid growth and
general political, economic and market conditions and events.
For a further list and description of risks and uncertainties, see the reports
filed by Supermicro with the Securities and Exchange Commission. Supermicro
disclaims any intention or obligation to update
or revise any forward-looking statements, whether as a result of new
information, future events or otherwise. Supplemental information,
condensed balance sheets and statements of operations follow. All monetary
amounts are stated in U.S. dollars. |
 3
Non-GAAP Financial Measures
Non-GAAP gross margin in this presentation excludes stock-based
compensation expense. Non- GAAP net income and net income per share in
this presentation exclude stock-based compensation expense, a provision
for litigation costs and the related tax effect of the applicable items.
Management presents non-GAAP financial measures because it considers them to
be important supplemental measures of performance. Management uses the
non-GAAP financial measures for planning purposes, including analysis
of the Company's performance against prior periods, the preparation of
operating budgets and to determine appropriate levels of operating and capital
investments.
Management also believes that non-GAAP financial measures provide additional
insight for analysts and investors in evaluating the Company's financial
and operational performance. However, these non-GAAP financial measures
have limitations as an analytical tool, and are not intended to be an
alternative to financial measures prepared in accordance with GAAP.
Pursuant to the requirements of SEC Regulation G, detailed reconciliations between
the Company's GAAP and non-GAAP financial results is provided at the
end of the press release that was issued announcing
the
Company’s
operating
and
financial
results
for
the
quarter
ended
December
31,
2010.
In addition, a reconciliation from GAAP to non-GAAP results is contained in
the financial summary attached to today’s presentation and is
available in the Investor Relations section of our website at
www.supermicro.com
in the Events and Presentations section. Investors are advised to carefully
review and consider this information as well as the GAAP financial results that
are disclosed in the Company's SEC filings. |
 4
Q2’FY2011 Non-GAAP Financial Highlights
(in millions, except per share data)
Q2'11
YoY
Sequential
Revenue
$240.8
32.3%
16.2%
Profit after Tax
$13.3
44.4%
43.9%
EPS
$0.31
40.9%
40.9%
Change |
 5
Summary of Results
Another record for revenue with $241 million and 32%
higher than last year
Our margins improved again and are moving in the right
direction
Our Supermicro Brand is gaining market share
We saw continued strong growth in Blades and GPU
products
Our systems revenue increased to 41% of total revenue
We grew in our overseas markets and particularly in the
Asia region
Our growth strategy of expanding overseas and in new
markets is positioning us for future growth |
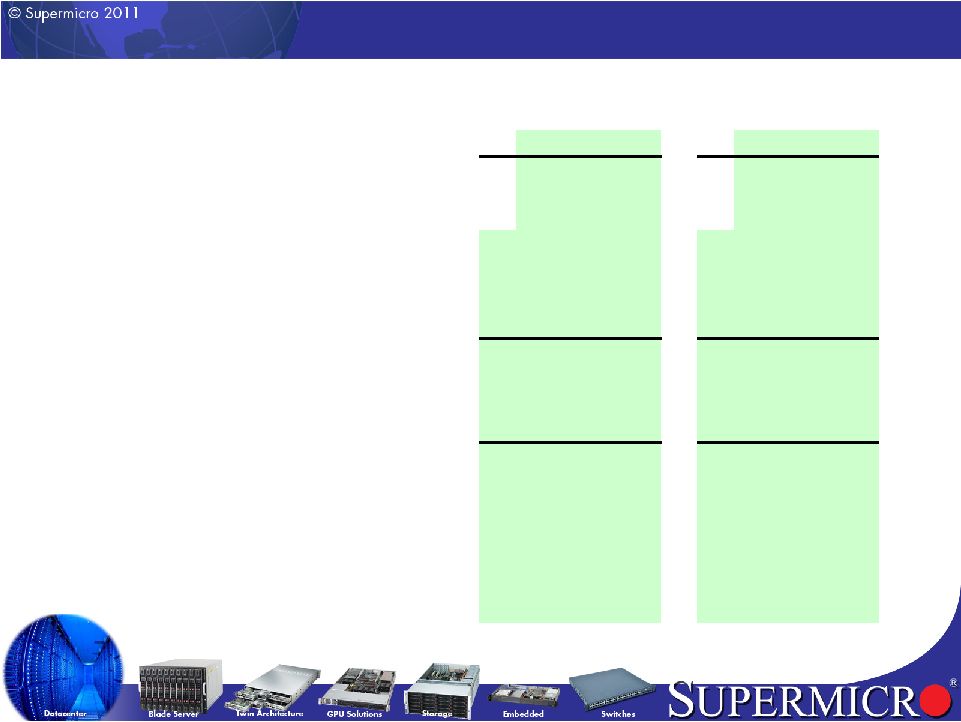
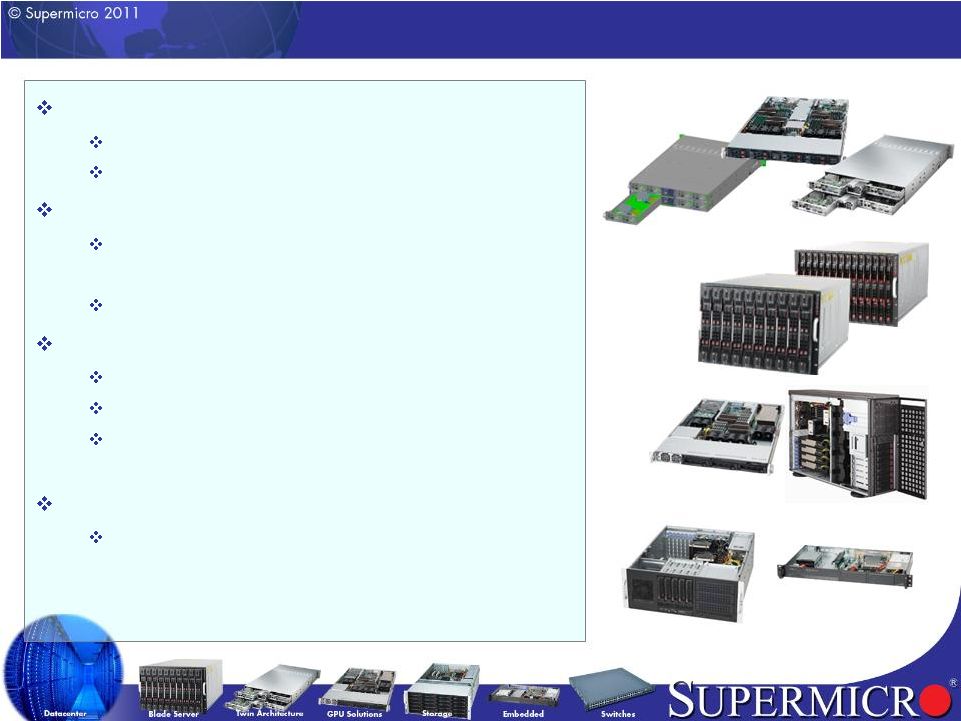 Leading Products
Twin Architecture
New -
2U Twin³
(8 nodes in 2U)
1U
Twin,
2U
Twin²,
2U
Twin
(6x
3.5”
HDD
or
12x
2.5”
HDD)
SuperBlade™
-
TwinBlade™
and GPU Blade
20/28
DP
nodes
in
7U,
support
40Gb/s
Infiniband
or
10G
Ethernet
connectivity
GPU in blade, leverage Twin architecture
GPU optimized product lines (1U, 2U and 4U)
4 GPUs
in 1U project kick off!
Extreme performance for calculation-intensive applications
Scientific computation, imaging processing and CFD
(Computational Fluid Dynamic) simulation
IPC and Embedded Applications
Atom-based low power server: fan-less / long life cycle, for
embedded and server appliances
Twin Architectures
GPU-optimized
TwinBlade™
ATOM server
Industrial Solution |
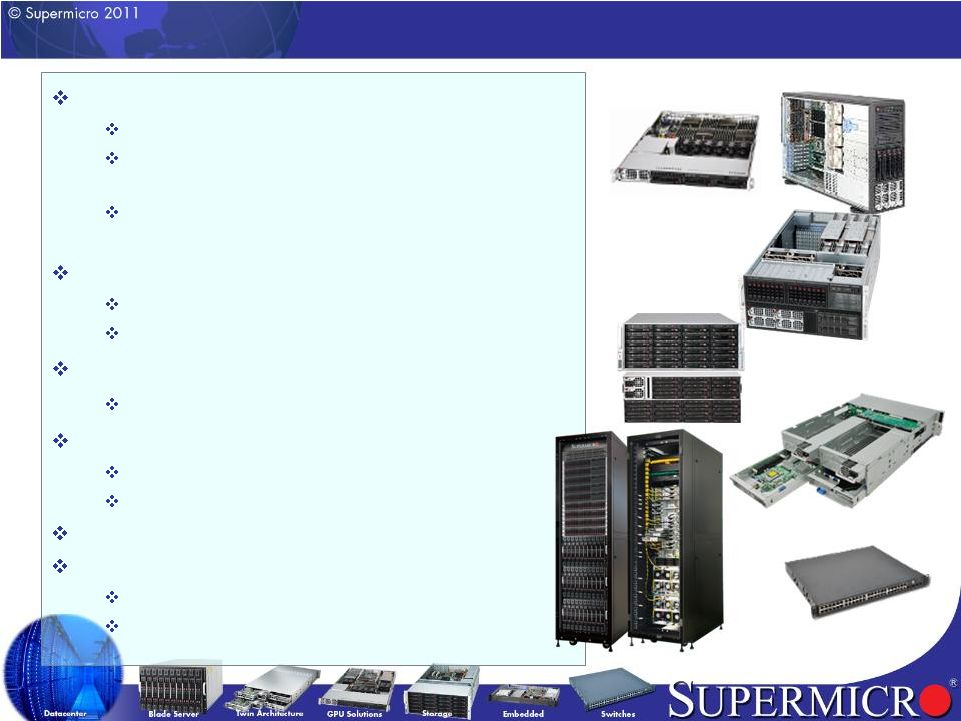 New
Generation 8-way/4-way Systems Addressing (8-way) high-end
high-margin solution Boxboro-EX MP (Nehalem-EX) and G34 MP
system in 1U/4U
Addressing HPC application needs as well as enterprise
market
Storage product line expansion
Super SBB product line
Higher density storage subsystems: Double-Sided
SuperRack
Double side access, cable management, water cooling
Switch Products: 10GbE, IB, FCoE
10GbE onboard and 10GbE standalone switch
FCoE
solution coming soon
MicroCloud
Software Optimization
Remote management, power management
HPC/DC management toolset
Front
Back
Super-SBB
Double-Sided Storage
1U, 4U / 4-way
Leading Products
5U / 8-way
10GbE Switch
SuperRack |
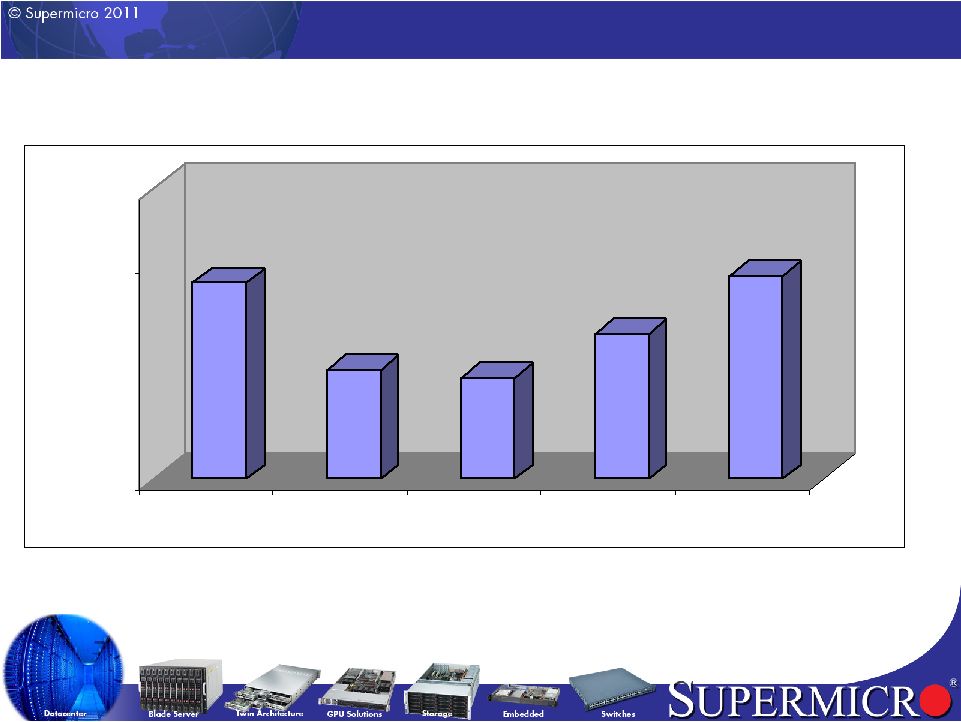
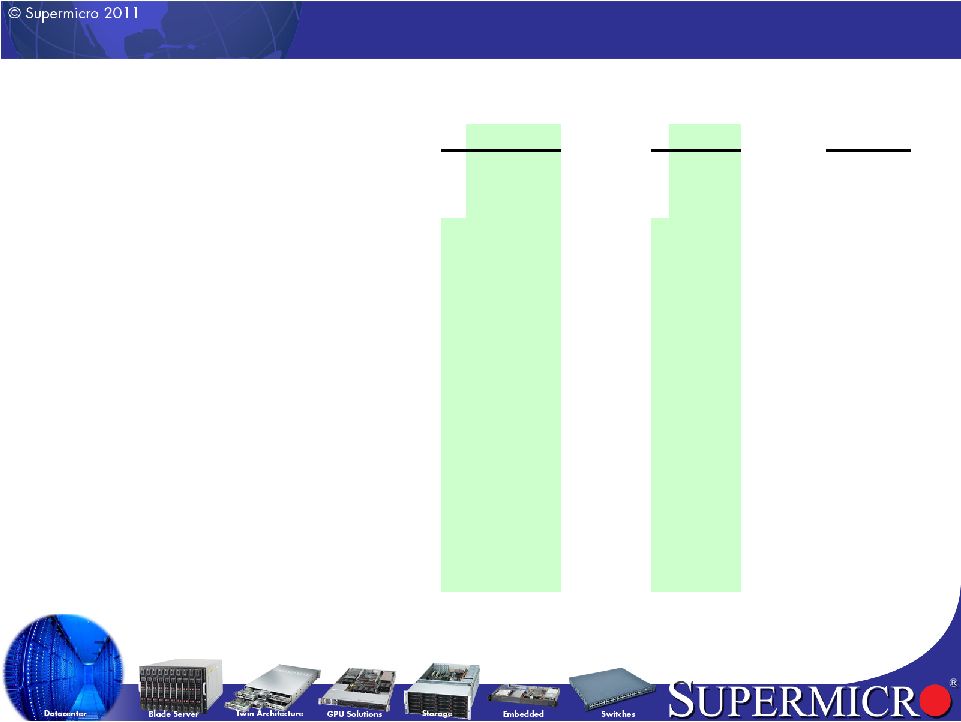
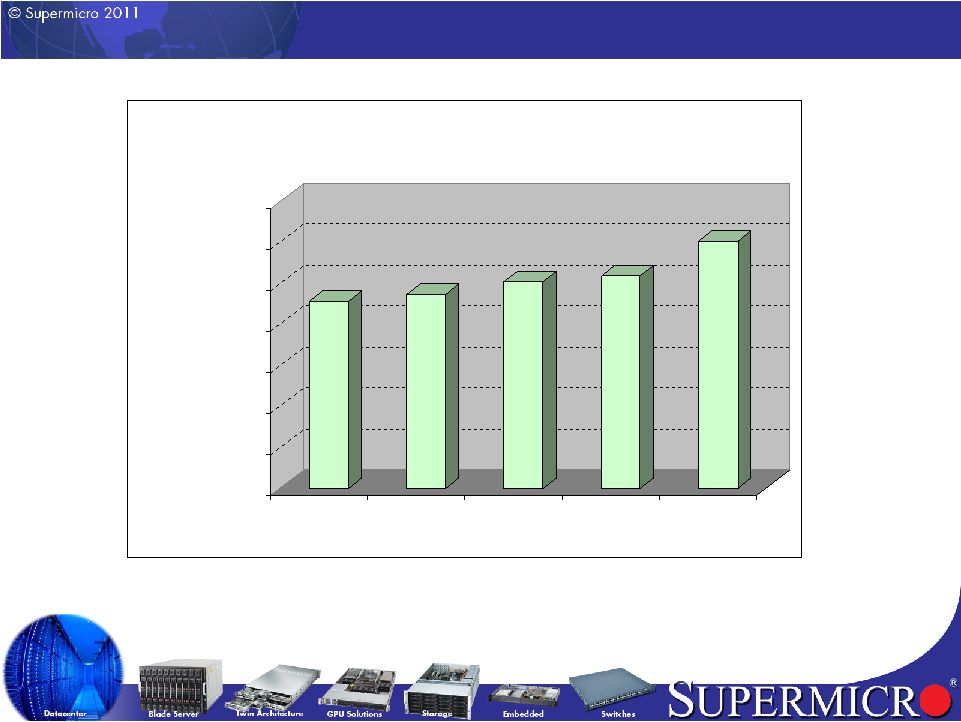 8
Revenue Comparables
$182
$189
$202
$207
$241
$0
$40
$80
$120
$160
$200
$240
$280
$'s millions
Q2'10
Q3'10
Q4'10
Q1'11
Q2'11
Supermicro Revenue Trend
Y/Y
41.5%
72.8%
63.4%
39.5%
32.3%
Seq.
22.5%
4.0%
6.5%
2.7%
16.2% |
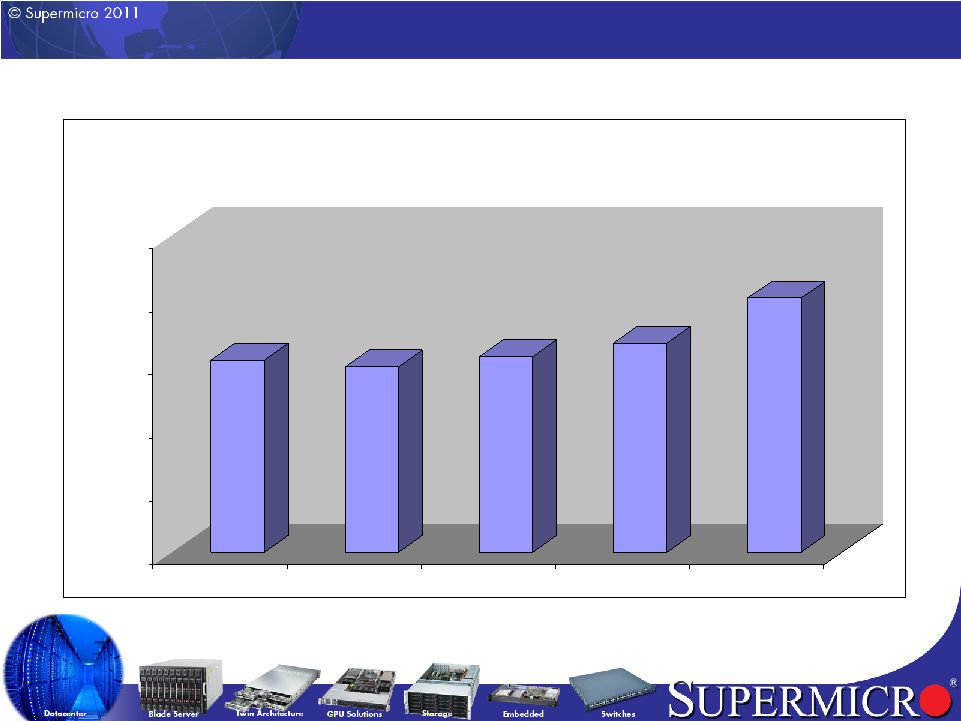
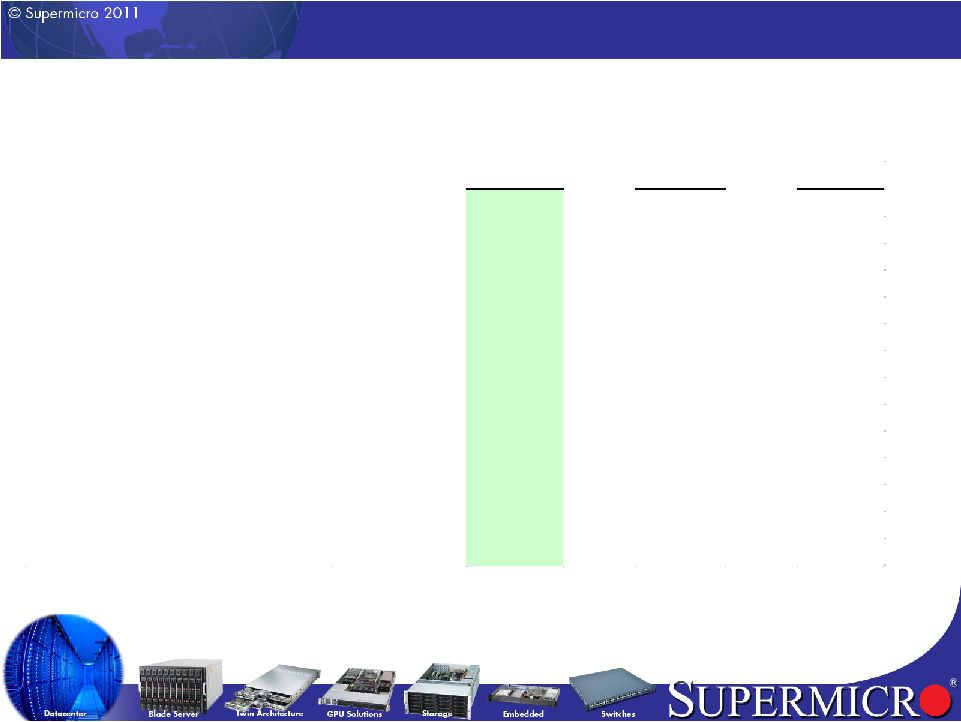
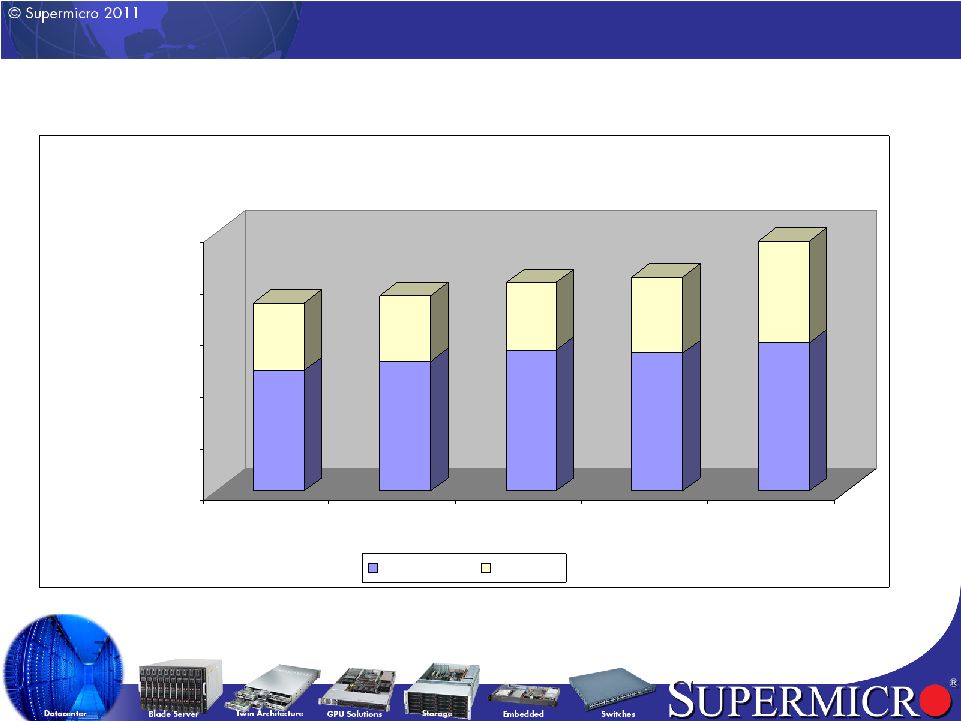 9
Revenue Analysis
$117
$65
$126
$63
$137
$65
$133
$74
$143
$98
$-
$50
$100
$150
$200
$250
$'s millions
Q2'10
Q3'10
Q4'10
Q1'11
Q2'11
Supermicro Subsystems/System Revenue
Subsystems
Systems |
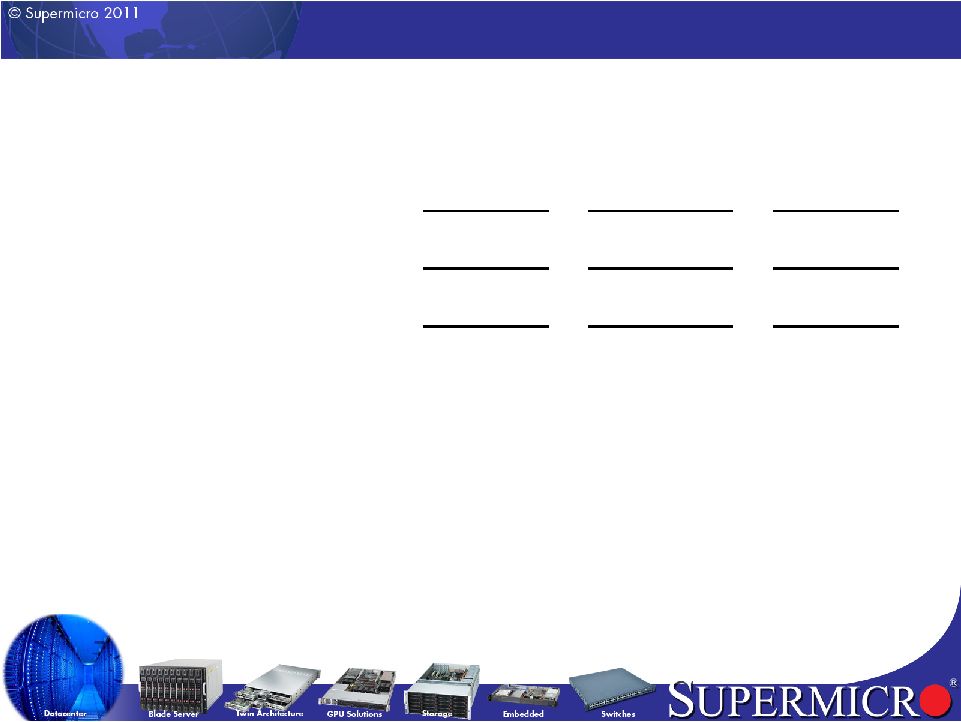
 10
Non-GAAP Gross Margins
16.7%
15.5%
15.4%
16.0%
16.8%
14.0%
17.0%
Q2'10
Q3'10
Q4'10
Q1'11
Q2'11 |
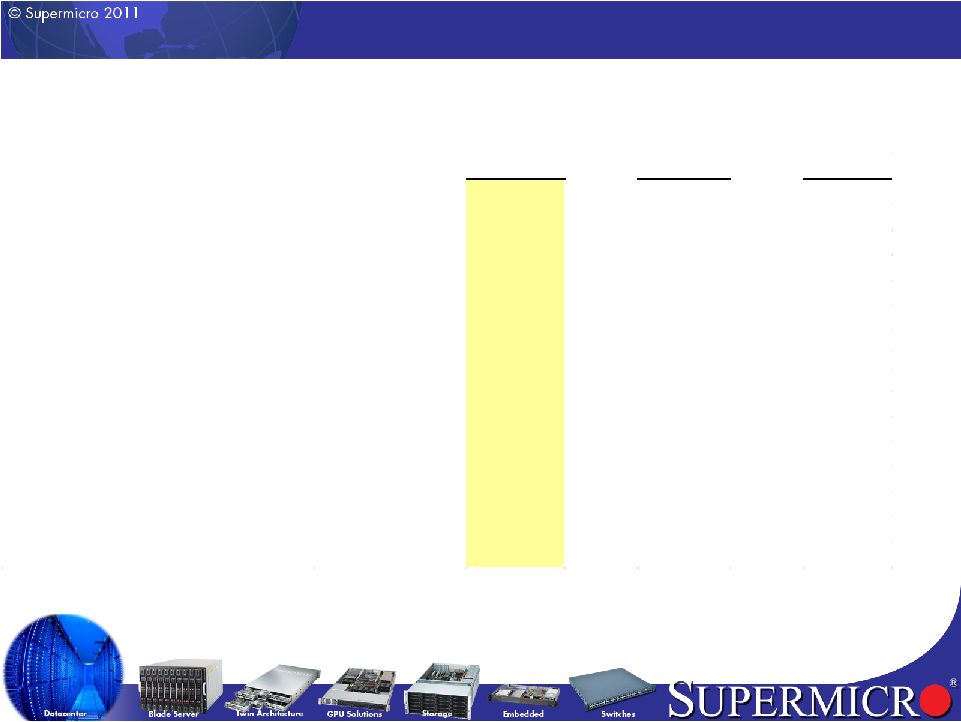
 11
Non-GAAP Gross Profit
$30.5
$29.4
$31.1
$33.2
$40.4
$-
$10.0
$20.0
$30.0
$40.0
$50.0
Q2'10
Q3'10
Q4'10
Q1'11
Q2'11
Gross Profit
$'s millions |
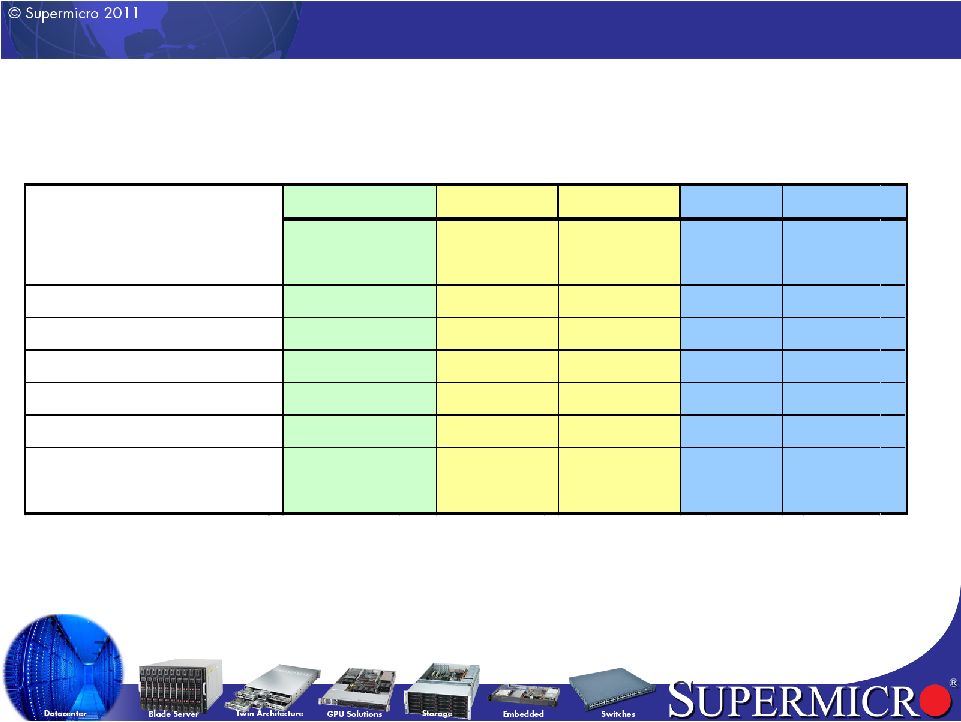 12
Summary P&L non-GAAP
(in millions, except per share data)
Q2'11
YoY
Sequential
Q2'10
Q1'11
Operating Expense
$21.6
$5.2
$2.9
$16.4
$18.7
Operating Expense Ratio
9.0%
0.0%
0.0%
9.0%
9.0%
Operating Income
$18.8
$4.7
$4.2
$14.1
$14.6
Net Income
$13.3
$4.1
$4.1
$9.2
$9.3
EPS
$0.31
$0.09
$0.09
$0.22
$0.22
Diluted Share Count
42.7
40.5
42.7
Effective Quarterly
Tax Rate
28.3%
34.1%
35.8% |
   13
Q2 FY2011 YTD Summary Statement of Cash Flows
($’s millions)
6 Months Ended
6 Months Ended
31-Dec-10
31-Dec-09
Net Income
$18.8
$11.5
Depreciation and amortization
$2.6
$2.2
Stock comp expense (FAS 123R)
$3.7
$3.2
Other reserves
$6.0
$2.1
Net change in AR, Inventory, AP
-$12.7
-$18.0
Other prepaids and liabilities
$2.5
$10.6
Cash flow from operations
$20.9
$11.6
Capital expenditures
-$8.3
-$1.7
Free cash flow
$12.6
$9.9
Net cash - investing activities
$1.3
$8.7
Net cash - financing activities
$0.7
-$6.6
Net change in cash
$14.6
$12.0 |
   14
Q2 FY 2011 Summary of Balance Sheet Metrics
($’s millions)
Q2'11
Q1'11
Change
Cash Equivalents & Investments
92.7
$
89.4
$
3.3
$
Accounts Receivable
77.8
$
71.8
$
6.0
$
Inventory
187.6
$
151.5
$
36.1
$
Accounts Payable
144.0
$
113.1
$
30.9
$
DSO
29
32
-3
DIO
78
76
2
DPO
59
55
4
Cash Cycle Days
48
53
-5 |
 15
Supplemental Financials
Second Quarter Fiscal 2011
Ended December 31, 2010 |
 16
Non-GAAP Financial Summary
(in millions, except per share data)
Q2'11
Q1'11
Q2'10
Net Sales
240.8
$
207.2
$
182.0
$
Non-GAAP Gross Margin
16.8%
16.0%
16.7%
Non-GAAP Operating Expenses
21.6
$
18.7
$
16.4
$
Non-GAAP Operating Income
18.8
$
14.6
$
14.1
$
Non-GAAP Net Income
13.3
$
9.3
$
9.2
$
Non-GAAP Net Income per share
0.31
$
0.22
$
0.22
$
Fully diluted shares for calculation
42.7
42.7
40.5 |
 17
Prior Period Net Income Comparisons
(in millions, except per share data)
Q2'11
Q1'11
Q2'10
Net Income (GAAP)
11.6
$
7.2
$
7.6
$
FAS123R & Other Unusual Expense (tax affected)
1.8
$
2.1
$
1.6
$
Net Income (Non-GAAP)
13.3
$
9.3
$
9.2
$
Diluted Net Income per common share (GAAP)
0.27
$
0.17
$
0.19
$
FAS123R & Other Unusual Expense (tax affected)
0.04
$
0.05
$
0.03
$
Diluted Net Income per share (Non-GAAP)
0.31
$
0.22
$
0.22
$
Shares used in diluted EPS calculation
42.7
42.7
40.5 |
 18
Q2 FY 2011 GAAP to Non-GAAP Reconciliation
(in millions, except per share data)
FAS123R &
Q2'11
Q2'11 GAAP
Other Unusual
Non-GAAP
Results
Expenses
Results
Net Sales
240.8
$
-
$
240.8
$
Cost of Sales
200.6
$
0.2
$
200.5
$
Gross Profit
40.2
$
0.2
$
40.4
$
Operating Expense
23.3
$
1.7
$
21.6
$
Operating Income
16.9
$
1.8
$
18.8
$
Interest, net
(0.2)
$
-
$
(0.2)
$
Income Before Tax
16.8
$
1.8
$
18.6
$
Income Tax
5.2
$
(0.1)
$
5.3
$
Net Income
11.6
$
1.8
$
13.3
$
Diluted Net Income per share
0.27
$
0.04
$
0.31
$
Diluted shares used in GAAP and
Non-GAAP per share calculation
41.6
42.7
42.7 |
 19
Q1 FY 2011 GAAP to Non-GAAP Reconciliation
(in millions, except per share data)
FAS123R &
Q1'11
Q1'11 GAAP
Other Unusual
Non-GAAP
Results
Expenses
Results
Net Sales
207.2
$
-
$
207.2
$
Cost of Sales
174.1
$
0.2
$
173.9
$
Gross Profit
33.0
$
0.2
$
33.2
$
Operating Expense
21.0
$
2.4
$
18.7
$
Operating Income
12.0
$
2.6
$
14.6
$
Interest, net
(0.1)
$
-
$
(0.1)
$
Income Before Tax
11.9
$
2.6
$
14.4
$
Income Tax
4.7
$
(0.5)
$
5.2
$
Net Income
7.2
$
2.1
$
9.3
$
Diluted Net Income per share
0.17
$
0.05
$
0.22
$
Diluted shares used in GAAP and
Non-GAAP per share calculation
41.4
42.7
42.7 |
 20
Q4 FY 2010 GAAP to Non-GAAP Reconciliation
(in millions, except per share data)
FAS123R &
Q4'10
Q4'10 GAAP
Other Unusual
Non-GAAP
Results
Expenses
Results
Net Sales
201.7
$
-
$
201.7
$
Cost of Sales
170.8
$
0.2
$
170.6
$
Gross Profit
30.9
$
0.2
$
31.1
$
Operating Expense
19.5
$
1.5
$
18.0
$
Operating Income
11.4
$
1.7
$
13.1
$
Interest, net
(0.1)
$
-
$
(0.1)
$
Income Before Tax
11.3
$
1.7
$
13.0
$
Income Tax
3.6
$
(0.3)
$
3.9
$
Net Income
7.7
$
1.4
$
9.1
$
Diluted Net Income per share
0.18
$
0.03
$
0.21
$
Diluted shares used in GAAP and
Non-GAAP per share calculation
42.2
43.7
43.7 |
 21
Q3 FY 2010 GAAP to Non-GAAP Reconciliation
(in millions, except per share data)
FAS123R &
Q3'10
Q3'10 GAAP
Other Unusual
Non-GAAP
Results
Expenses
Results
Net Sales
189.3
$
-
$
189.3
$
Cost of Sales
160.0
$
0.1
$
159.9
$
Gross Profit
29.3
$
0.1
$
29.4
$
Operating Expense
18.7
$
1.4
$
17.3
$
Operating Income
10.5
$
1.5
$
12.1
$
Interest, net
(0.0)
$
-
$
(0.0)
$
Income Before Tax
10.5
$
1.5
$
12.0
$
Income Tax
2.8
$
(0.3)
$
3.1
$
Net Income
7.7
$
1.2
$
8.9
$
Diluted Net Income per share
0.18
$
0.03
$
0.21
$
Diluted shares used in GAAP and
Non-GAAP per share calculation
41.7
43.3
43.3 |
 22
Q2 FY 2010 GAAP to Non-GAAP Reconciliation
(in millions, except per share data)
FAS123R &
Q2'10
Q2'10 GAAP
Other Unusual
Non-GAAP
Results
Expenses
Results
Net Sales
182.0
$
-
$
182.0
$
Cost of Sales
151.7
$
0.2
$
151.5
$
Gross Profit
30.3
$
0.2
$
30.5
$
Operating Expense
17.9
$
1.5
$
16.4
$
Operating Income
12.4
$
1.7
$
14.1
$
Interest, net
(0.1)
$
-
$
(0.1)
$
Income Before Tax
12.3
$
1.7
$
14.0
$
Income Tax
4.7
$
(0.1)
$
4.8
$
Net Income
7.6
$
1.6
$
9.2
$
Diluted Net Income per share
0.19
$
0.03
$
0.22
$
Diluted shares used in GAAP and
Non-GAAP per share calculation
39.8
40.5
40.5 |