Attached files
| file | filename |
|---|---|
| 8-K - FORM 8-K - Kraton Corp | d8k.htm |
 Lenders’
Presentation
–
January
2011
Exhibit 99.1 |
 2
Forward-Looking Statement Disclaimer
This presentation may include “forward-looking statements”
that reflect our plans, beliefs, expectations and current views with respect to,
among other things, future events and financial performance.
Forward-looking statements are often characterized by the use of words such as
“believes,” “estimates,” “expects,”
“projects,” “may,” “intends,” “plans” or “anticipates,” or by discussions of strategy, plans or intentions. All
forward-looking statements in this presentation are made based on
management's current expectations and estimates, which involve risks,
uncertainties and other factors that could cause actual results to differ
materially from those expressed in forward-looking statements. Readers
are cautioned not to place undue reliance on forward-looking
statements. These risks and uncertainties are more fully described in “Part I.
Item 1A. Risk Factors” contained in our Annual Report on 10-K,
as filed with the Securities and Exchange Commission and as subsequently
updated in our Quarterly Reports on Form 10-Q, and include risks
related to: conditions in the global economy and capital markets; our
reliance on LyondellBasell Industries for the provision of significant
operating and other services; the failure of our raw materials suppliers to
perform their obligations under long-term supply agreements, or our
inability to replace or renew these agreements when they expire;
limitations in the availability of raw materials we need to produce our
products in the amounts or at the prices necessary for us to effectively
and profitably operate our business; competition in our end-use
markets, by other producers of SBCs and by producers of products that can be
substituted for our products; our ability to produce and commercialize
technological innovations; our ability to protect our intellectual
property, on which our business is substantially dependent; infringement
of our products on the intellectual property rights of others;
seasonality in our Paving and Roofing business; financial and operating
constraints related to our substantial level of indebtedness; product
liability claims and other lawsuits arising from environmental damage or
personal injuries associated with chemical manufacturing; political
and economic risks in the various countries in which we operate; the
inherently hazardous nature of chemical manufacturing; health, safety
and environmental laws, including laws that govern our employees’
exposure to chemicals deemed harmful to humans; regulation of our
customers, which could affect the demand for our products or result in
increased compliance costs; international trade, export control,
antitrust, zoning and occupancy and labor and employment laws that could
require us to modify our current business practices and incur
increased costs; our relationship with our employees; loss of key
personnel or our inability to attract and retain new qualified personnel;
fluctuations in currency exchange rates ; the fact that we do not enter
into long-term contracts with our customers; a decrease in the fair value
of our pension assets, which could require us to materially increase
future funding of the pension plan; and concentration of ownership among
our principal stockholder, which may prevent new investors from
influencing significant corporate decisions. We assume no obligation to
update such information. Further information concerning issues that could
materially affect financial performance related to forward looking
statements can be found in our periodic filings with the Securities and
Exchange Commission. |
 3
GAAP Disclaimer
This presentation includes the use of both GAAP (generally accepted accounting
principles) and non-GAAP financial measures. The non-GAAP financial measures are
EBITDA and Adjusted EBITDA. The most directly comparable GAAP financial measure
is net income/loss. A reconciliation of the non-GAAP financial measures used in this
presentation to the most directly comparable GAAP measure is included herein. We
consider EBITDA and Adjusted EBITDA important supplemental measures of our
performance and believe they are frequently used by investors and other interested
parties in the evaluation of companies in our industry. EBITDA and Adjusted EBITDA
have limitations as analytical tools and should not be considered in isolation or as a
substitute for analysis of our results under GAAP in the United States. |
 4
Presenters
Kevin Fogarty
President and Chief Executive Officer
Steve Tremblay
Chief Financial Officer |
 5
Agenda
Business and Industry Overview
Financial Overview
Proposed Transaction Overview |
 Business and Industry
Overview |
 7
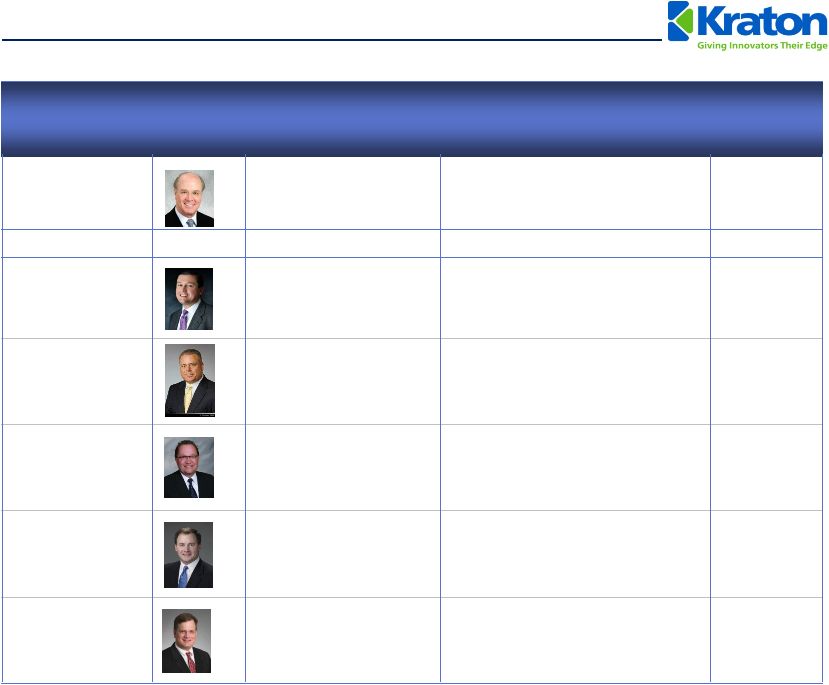
Experienced Leadership Team
Name
Title
Previous Experience
Years
Industry
Experience
Dan Smith
Chairman of the
Board
Lyondell
40
Kevin Fogarty
President & CEO
Koch (Invista)
19
Steve Tremblay
Chief Financial
Officer
Vertis
15
Lothar
Freund
Research &
Technical Services
Hoechst AG (Invista)
21
Gene Shiels
Director –
Investor
Relations
Baker Hughes
7
Scott Lee
Vice President –
Operations
Shell Chemical Co.
26 |
 8
37%
21%
42%
4%
7%
31%
26%
32%
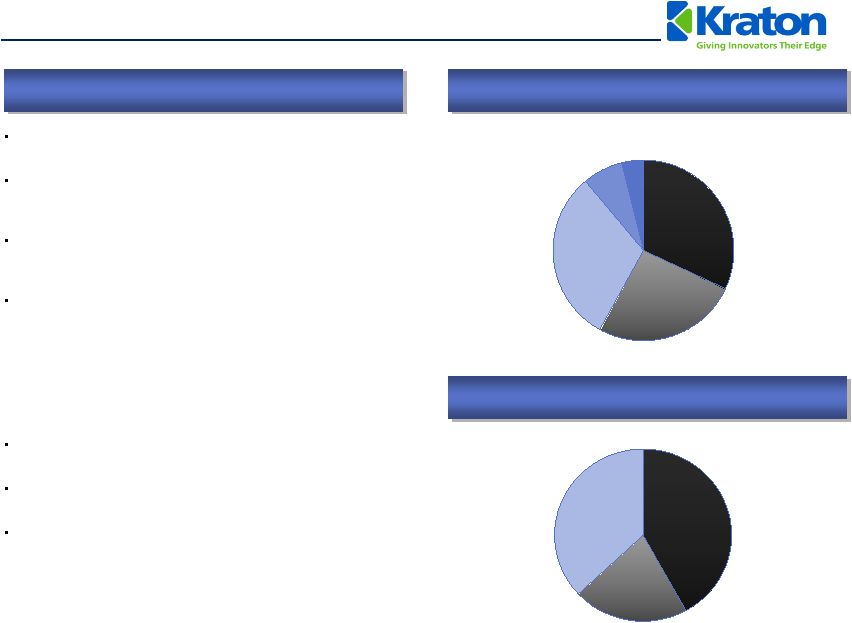
Kraton
Overview
We
invented
and
commercialized
Styrenic
Block
Copolymer (SBC) technology nearly 50 years ago
We believe that we hold #1 market share positions in each
of our end-use markets providing industrial, consumer and
geographical diversification that is second to none
We design and manufacture customized SBC polymer and
compound solutions to meet our leading customers’
specific innovation needs
We produce the following:
•
Unhydrogenated
Styrenic
Block
Copolymers
(USBC’s)
•
Hydrogenated
Styrenic
Block
Copolymers
(HSBC’s)
•
Isoprene Rubber and Isoprene Rubber Latex
We currently offer approximately 800 products to more
than 700 customers, in over 60 countries
We employ approximately 830 people in 9 locations in all
major regions of the world
TTM revenue ended September 30, 2010 of $1,191 million
and
Adjusted
EBITDA
(1)
of
$196
million;
16.4%
margin
(1)
Adjusted EBITDA is GAAP EBITDA excluding sponsor fees, restructuring and related charges, non-cash
expenses, and the gain on extinguishment of debt.
(2)
Management Estimates.
2009
Revenue
by
End-Use
(2)
2009
Revenue
by
Geography
(2)
North and
South
America
Europe,
Middle
East &
Africa
Asia Pacific
Paving and
Roofing
Adhesives,
Sealants and
Coatings
Other
Emerging
Businesses
Advanced
Materials
Clear SBC Market Leader Globally |
 9
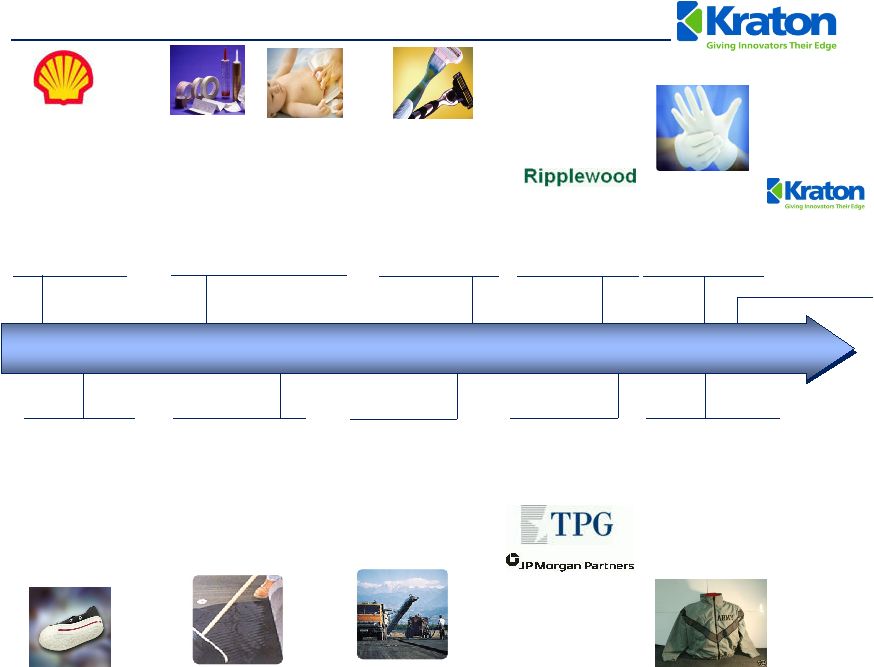
Soft touch
overmolding
has
become a value-added
market trend that has
revolutionized a broad
spectrum of end-use
products from
automotive to sporting
goods.
In the late 1960s SBCs
began use in
hot melts for packaging tape, labels,
and diaper spray adhesives.
Kraton
G polymers, SBCs
with
hydrogenated midblocks, were also
introduced for use in production of
soft, strong compounds for handles
and grips, elastic components in
diapers, etc.
Shell Chemicals scientists
develop first styrenic
block co-polymers in
1961, making amazingly
strong elastomers
which
required no vulcanization,
but could be molded into
different shapes with heat
(thermoplastic).
Kraton’s
History is the History of the SBC Industry
Kraton
spun out of
Shell Chemicals and
acquired by
Ripplewood
Holdings
in 2001
Developed
hypoallergenic
synthetic latex
for surgical
gloves and
condoms.
In 1964, Kraton
produced the first
Kraton
D polymers and
SBS compounds for
footwear applications.
The first dedicated
block copolymer plant
was built by Shell in
Belpre, Ohio in 1971.
Use of SBS in roofs
didn’t take off until the
70’s in Europe and the
early 1980’s in the US.
Stronger and more
flexible roofing felt
made from SBS
modified asphalts took
hold in the market.
Kraton
acquired by
TPG Capital and J.P.
Morgan Partners in
2003
Road technologies
shifted in the early
1990s leading to
dramatic increases in
the use of SBS
modified asphalts,
especially for climates
with large temperature
swings.
Developed NEXAR high
ion-flux polymers as
coating on top-end fabric &
membranes. Applications
include military uniforms,
athletic apparel, chemical
protective suits, water
filtration, etc.
1960
1970
1980
1990
2000
2010
Initial Public
Offering on the
New York Stock
Exchange |
 10
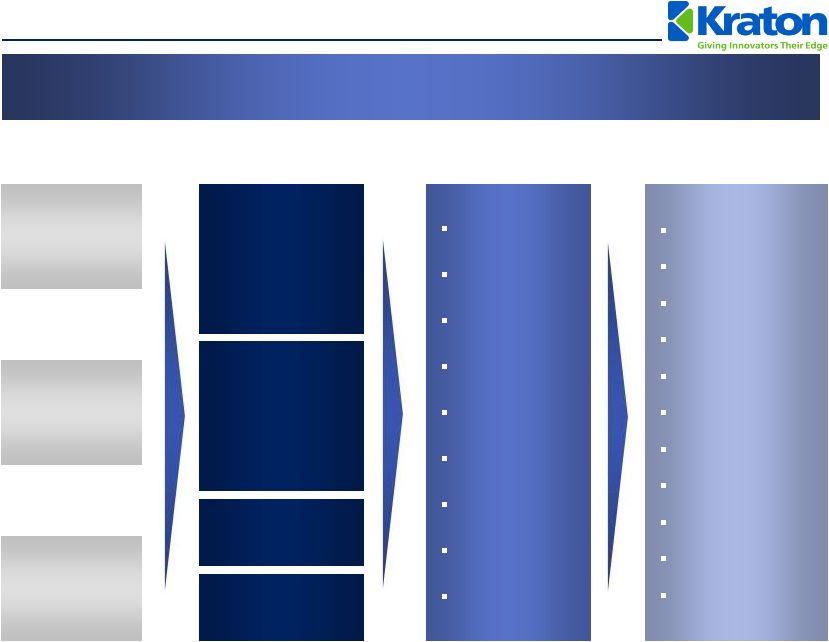
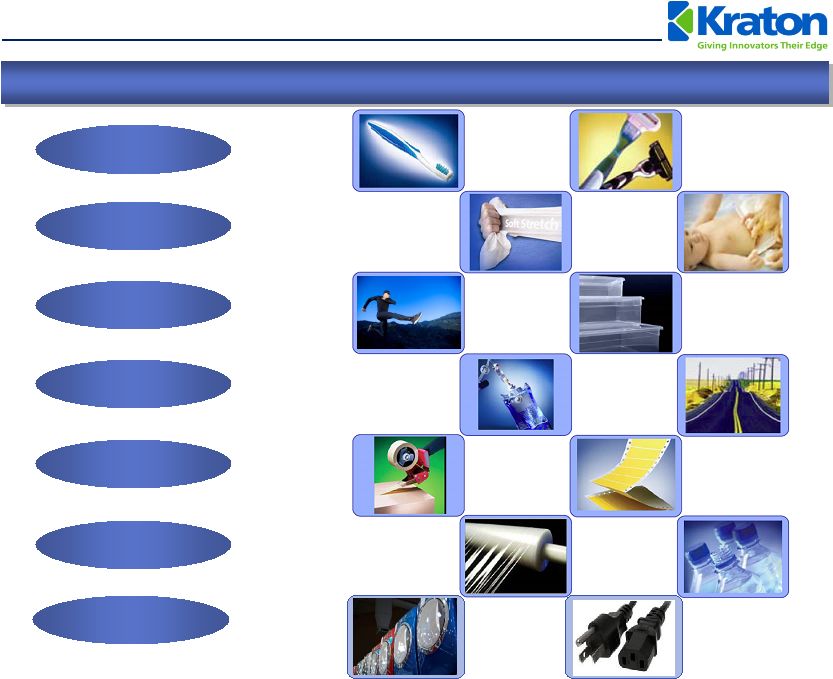
SBCs
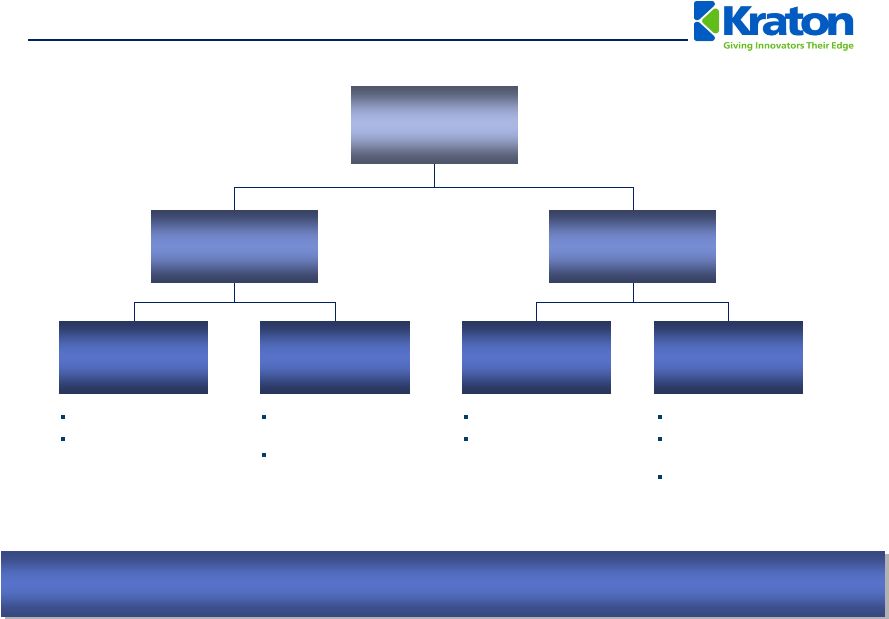
are Engineered to Meet Customer Needs
Primary Raw
Materials
Products
Customer Value
End-Use Applications
Styrene
Unhydrogenated
SBCs
SBS
SIS
SIBS
Butadiene
Isoprene
Hydrogenated
SBCs
SEBS
SEPS
Isoprene Rubber
and Latex
Compounds
Paving
Roofing
Personal Care
Tapes
Formulators
Labels & Printing
Compounds
Packaging
Auto
Lubricants
Medical
Stretch
Soft-Touch
Adhesion
Strength
Durability
Thickening
Compatibility
Clarity
Recyclability
Kraton
is the only provider of these value components across all products touching
a wide array of applications |
 11
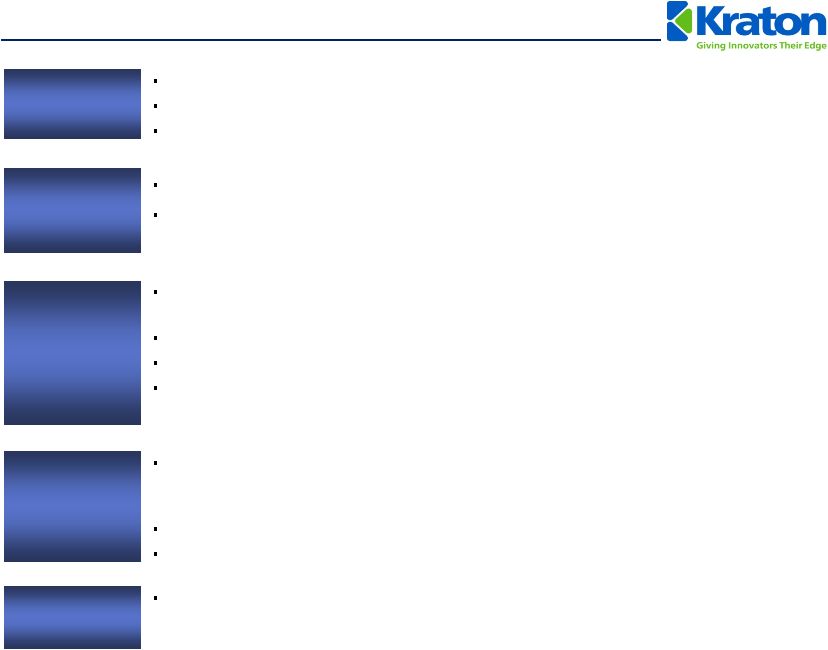
Investment Highlights
Leadership
Clear leader in the fast growing, attractive SBC market
More
than
1.6x
the
size
of
our
largest
competitor
in
each
of
our
end-use
markets
The only producer with a global footprint and service capabilities
Innovation-
Driven Top-
Line Growth
Most-productive innovator of new SBC polymers
Successfully leveraging product knowledge and technical expertise to commercialize
next generation of innovative solutions
Earnings
Growth
Driven by compelling organic growth platforms, expanding presence in Asia, sustained
volume growth and new product introductions
Margin
enhancement
through
continued
“Smart
Pricing”
strategy
and
innovation
Created meaningful operating leverage through significant improvement in cost structure
Investing
capital
in
high-return
projects
–
driving
profitable
growth
in
key
products
and
geographies
Experience
Strong leadership team demonstrating continuous improvement in productivity,
innovation and margin improvement
High
Barriers to
Entry
Patented technology, custom designed product, process excellence, global reach
and customer relationships create strong competitive position that cannot be
matched by existing or potential competitors
Competitive position allows for price leadership
Best-in-class service levels: 100% of products delivered on-demand on-time
|
 12
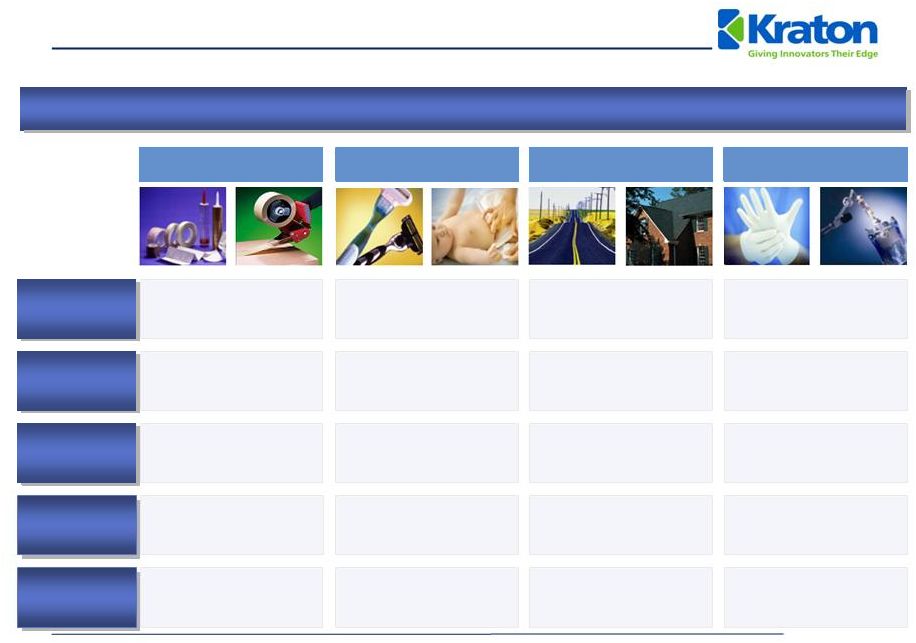
SBCs
Enhance Performance Attributes
Durability
Elasticity
Impact
Soft Touch
Clarity
Adhesion
We are a Highly Engineered, Performance Materials Business
Recyclable |
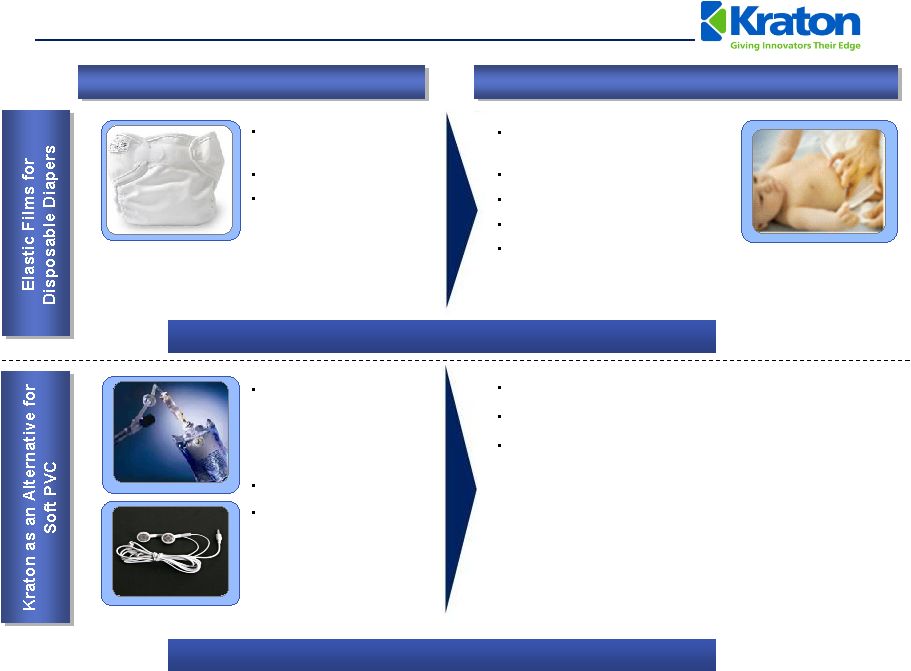    13
Before Kraton
After Kraton
Kraton
Makes Products Perform Better
Stretch in legs only
(Spandex)
Not a fitted garment
High leakage rate
Overall improvement in stretch
(where it’s needed)
Better fit
Low leakage rate
Kraton
market share: 50%
2001
–
2009
CAGR:
11.5%
Kraton
material as % of Diaper cost: <2%
Phthalate plasticizers are
used to make PVC soft
but they can leach from
finished products and
create health concerns
Limited recyclability
PVCs
are unsafe when
burned or incinerated
improperly
Environmentally
friendly
–
100%
recyclable
Kraton
imparts softness, toughness and clarity
Plasticizer & chlorine free
Kraton
material as % of finished product cost: <5% |
 14
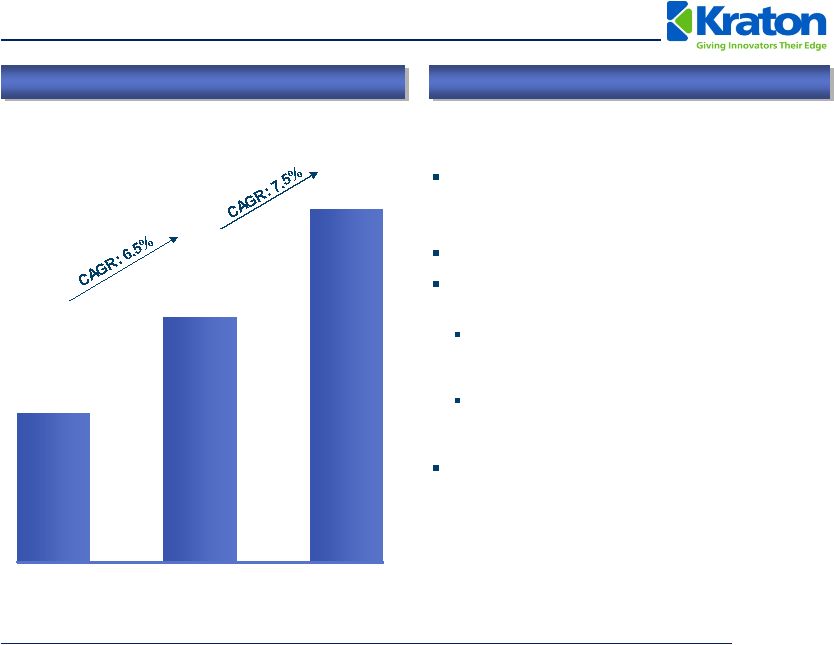
SBCs
are a Growth Industry
SBC Industry Volume (kT)
(1)
SBCs
Grow Faster Than GDP
Adoption
and
penetration
of
SBCs
into
new
applications and end-markets lead to industry
growth of ~2x GDP
Growing demand from emerging economies
Innovation and new SBC product
introductions
End-use application growth (e.g., PVC
alternatives for wire & cable and medical
applications such as IV bags, etc.)
Growing demand for environmentally friendly and
greener alternatives in electronics, medical and
baby care markets
Low cost relative to value added /
performance with limited substitution risk
675
1,112
1,599
2001
2009
2014
(1)
Management estimates. Excludes footwear end-use in which Kraton does not actively compete.
|
 16
Global SBC Industry
Kraton
believes it is better positioned than the industry in HSBCs, which have higher performance
characteristics, are significantly more complex to produce and generate higher margins
SBC Industry
Market Size: 1,400kT
(~$3.3 billion)
USBC Production
(Unhydrogenated
Styrenic
Block Copolymers)
HSBC Production
(Hydrogenated Styrenic
Block Copolymers)
SBS
(Styrene-Butadiene-
Styrene)
SIS
(Styrene-Isoprene-
Styrene)
SEBS
(Styrene-Ethylene-
Butylene-Styrene)
SEPS
(Styrene-Ethylene-
Propylene-Styrene)
Paving and Roofing
Footwear
Adhesives, Sealants
and Coatings
Advanced Materials
Advanced Materials
Adhesives, Sealants
and Coatings
Lubricant Additives
Adhesives, Sealants
and Coatings
Advanced Materials
% Industry
% Kraton
2009 Revenue
66%
34%
Kraton
Industry
79%
21%
Source: Kraton Management and SRI Consulting.
Note: Blue percentages correspond to industry split and red percentages represent estimated Kraton
split. |
 Clear Leader in
Attractive Markets Market Position
2009 Revenue
(1)
Adhesives, Sealants,
and Coatings
Advanced Materials
Paving and Roofing
Emerging Businesses
(4)
#1 Market Position and More than 1.6x the Size of Our Closest Competitors
Growth
(2)
Kraton
Market
Share Relative
To #2
Competion
(3)
Top 4 Market
Share
Source:
Management estimates.
(1)
Based on 2009 sales of $920 million (excludes by-product sales
which are reported as other revenues). (2) Industry volume growth from
2001-2009, Emerging Businesses growth rate refers to Kraton’s Isoprene Rubber (“IR”) and Isoprene Rubber Latex (“IRL”) growth from 2005-2009.
(3)
Management’s estimates vs. next largest competitor based on 2009
sales. (4)
The Emerging Businesses end-use market includes our IR and IRL
business. We believe that we are the only major third-party supplier of IR and IRL, and therefore end-use market share
metrics are not meaningful.
32%
5.9%
#1
1.9x
74%
77%
2.0x
#1
#1
1.6x
63%
100%
N/A
N/A
31%
7.4%
26%
6.5%
26.8%
7%
17 |
 18
Sustainable Competitive Advantages
Almost 50 years of process know-how and
expertise
Performance-critical products and manufacturing
complexity
Technical
Barriers
Globally
recognized
brand
–
Kraton
®
Industry-leading R&D infrastructure
Global low-cost manufacturing footprint
Significant regulatory hurdles / barriers to new
manufacturing sites
Stable raw material base with multiple sources of
supply and contracts / relationships
Collaborative
customer
relationships
–
15+
years
with majority; sole source with several customers
Infrastructure
Barriers
Superior and
Innovative
Products
+
High Customer
Switching Costs
+
Long-Term
Customers
Relationships
=
Leading
Market Position
Products designed collaboratively to meet
specific customer needs / applications
Preferred partner based on manufacturing
consistency and process know-how
Ongoing technical service offering
100% of products offered with no lead times
High
Value
Added |
 19
Europe
Asia
NA
Total
HSBC
3
1
3
7
SBS
4
3
6
13
SIS
4
2
1
7
USBC
1
–
–
1
Total
12
6
10
28
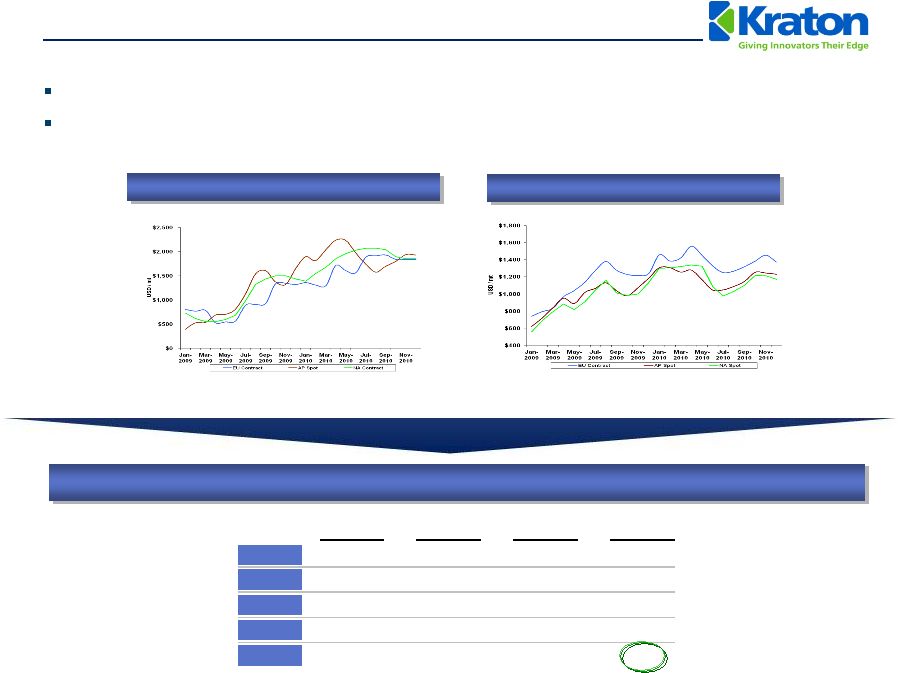
Proven Ability to Manage Input Volatility
Consultant forecasts calling for relatively flat energy and monomer costs in 2011
Should monomers be more volatile, Kraton
will execute its demonstrated core competence of managing
volatility in monomer costs
Price Increases Since IPO –
December 2009
Styrene
Butadiene
Source: Wall Street research |
 20
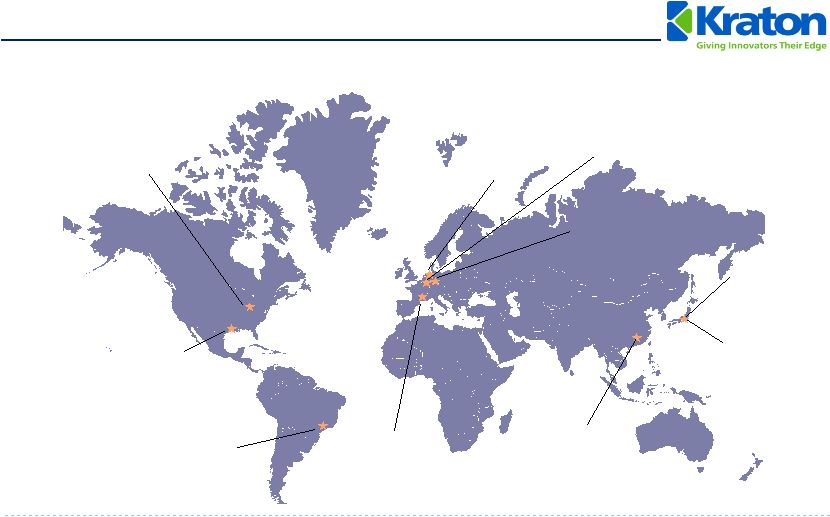
Unparalleled Global Manufacturing and Service Capability
Plant
Capacity (kT)
Products
Focus
Belpre, OH
189
HSBC, USBC
World-scale HSBC (low cost), product breadth, N. American market
Paulinia, Brazil
28
USBC, IR Latex
Mercosur
tariff region, USBC, IR Latex global market
Berre, France
87
HSBC, USBC
Product breadth, European market
Wesseling, Germany
95
USBC
World-scale USBC, low cost
Kashima, Japan
22
USBC
Asian Market
Belpre, Ohio U.S.
Manufacturing
Facility
Global Headquarters
Houston, Texas U.S.
Innovation Center
Paulinia, Brazil
Manufacturing Facility
Innovation Center
Mont St. Guibert,
Belgium
Technical Service
Office
Wesseling,
Germany
Manufacturing
Facility
Kashima, Japan
Manufacturing
Joint Venture
Berre, France
Manufacturing
Facility
Amsterdam
The Netherlands
European Headquarters /
Innovation Center
Shanghai, China
Customer Service
and Technical
Center
Tsukuba, Japan
Innovation
Center |
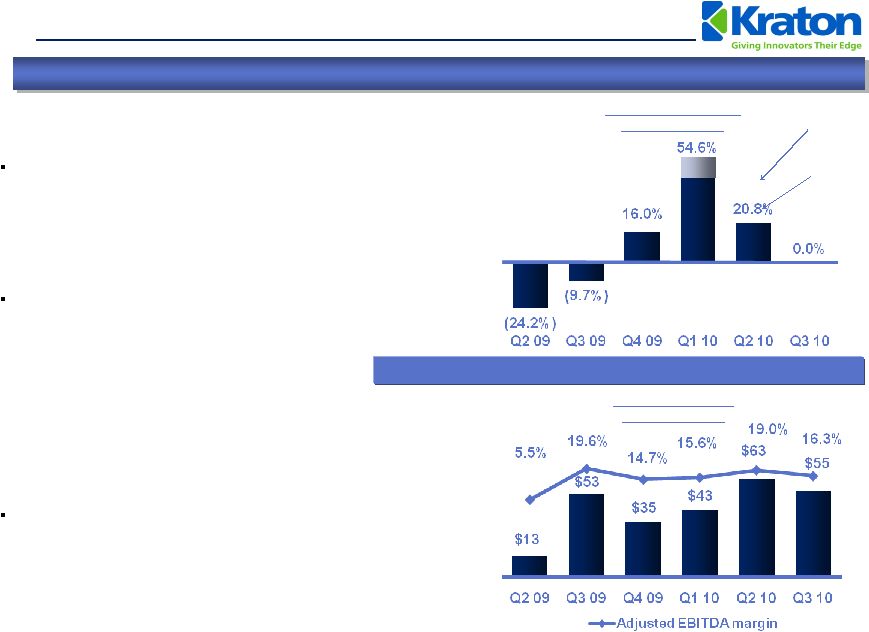 21
Adjusted EBITDA
(1)
(US$ in millions)
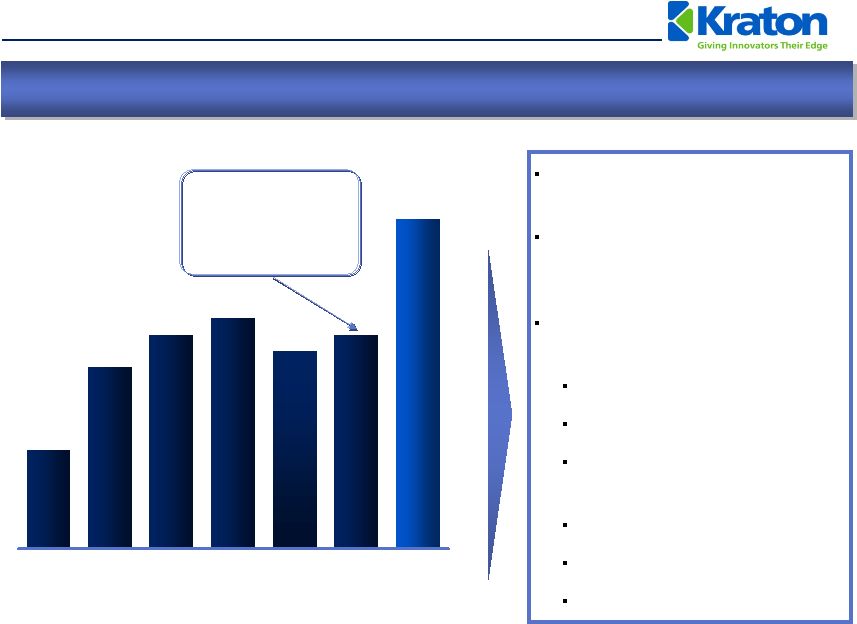
Strong Business Momentum: Q3 2010
(1)
Adjusted EBITDA is GAAP EBITDA excluding sponsor fees, restructuring and related charges, non-cash
expenses, and the gain on extinguishment of debt
Sales volumes recovering from lows in
late 2008 and first half 2009
Strong earnings momentum resulting
from volume recovery, increased
adoption of Kraton
products and cost
leverage
Focus on margin expansion through
“Smart Pricing”
and innovation
programs
Profit growth through focused strategy, volume recovery, cost reduction and product innovation
12.1%
Estimated “One-time”
Growth
Core Growth
Year-on-Year Change
in Sales Volume
Volume (kT)
71 81
61
73
86 81 |
 22
Conservative Capital Structure
Superior profitability and industry leading margins
Growth through re-investment in existing business
Support market-driven research and development
High-return capital spending projects
Strategic M&A opportunities that build technology and market portfolio
Acquisition criteria:
Consistent with existing capabilities / core competencies
Accretive to earnings within first year
No near-term plans to initiate dividend or share repurchases until current
capital plan completed
Kraton
is focused on maintaining a conservative capital structure
Financial
Objectives
and Future
Uses of Cash |
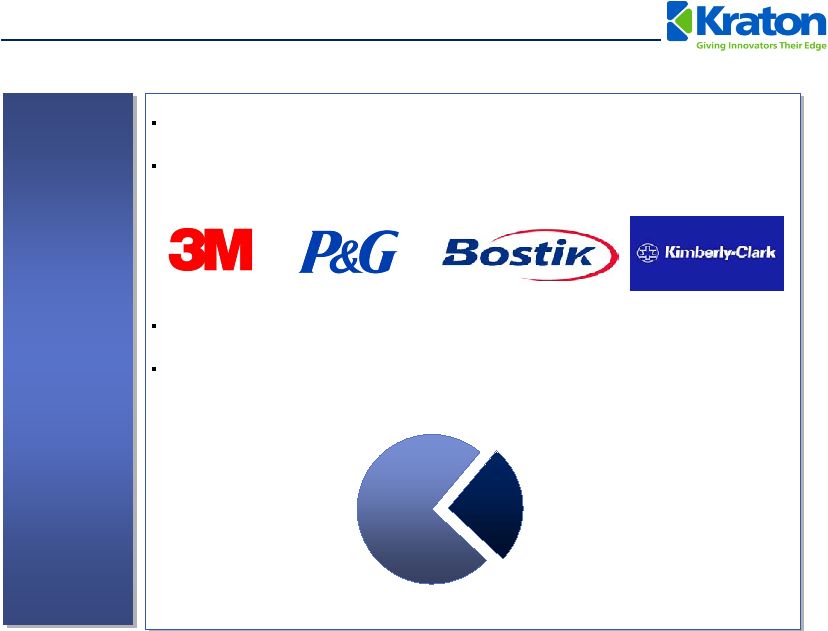 23
Majority of top customers have 15+ year relationship
Blue chip customer base in the consumer products, packaging,
medical supplies, construction and textile industries
Several key customer relationships are sole source
Well diversified customer base
Long-Standing and Collaborative Customer Relationships
High
Quality
Customer
Base
74%
26%
2009 Revenues by Customer
~700
Customers
Top 10 |
 24
20%
13%
12%
14%
13%
11%
6%
2005
2006
2007
2008
2009
Q3
2010
TTM
Target
Profit Growth Through Innovation
Approximately 1,000 patents
granted and 381 pending
Innovation continuously
repositions sales mix, improves
margins and drives growth
Step-change advancement of
Big 6 Innovation Priorities
Wire and cable solutions
Elastic nonwovens
NEXAR™
membrane
technology
Oilfield service applications
Protective films
Automotive soft skin solutions
Innovation
Share
of
Total
Revenue
(%)
(1)
(1)
Innovation revenue defined as revenues of new products (e.g., new polymer, new application of an
existing polymer or new step out production technology) introduced within the last 5
years. Vision 20/20: 20% of revenue at 20% margin premium
Increased in Period of
Strong Volume
Growth in Base
Business |
 25
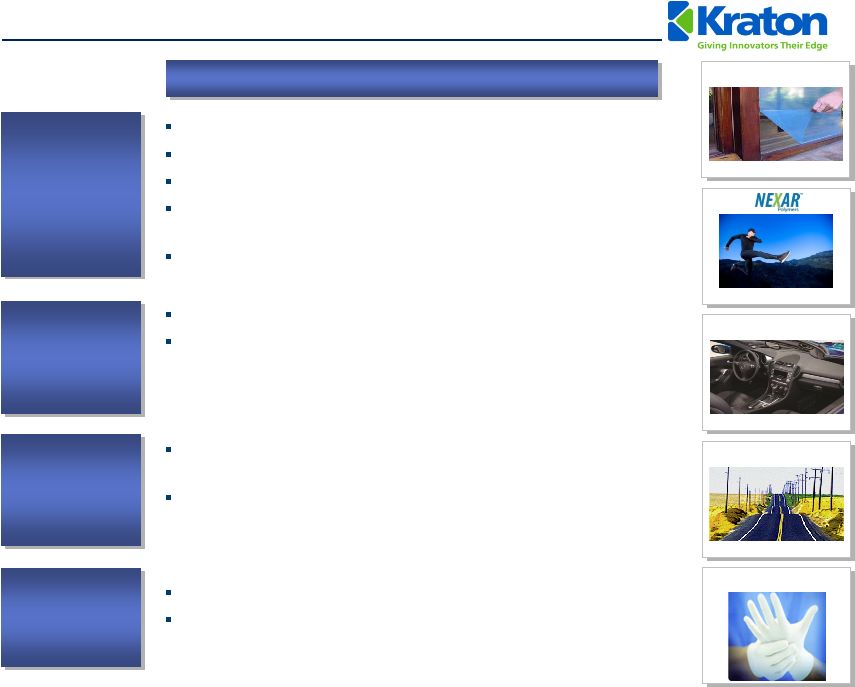
Compelling Organic Growth Platforms
Advanced
Materials
Adhesives,
Sealants &
Coatings
Paving and
Roofing
Emerging markets growth
Expansion into new and differentiated markets, such as
protective films, oilfield service applications, spray and
extrusion coatings, hot melt adhesives, elastic adhesives,
labels and sealant applications
Superior performing SBS modified emulsions for
asphalt
modification
Low VOC roof coating formulations for superior water
resistance, improved adhesion and reduced installation cost
“Green”
PVC alternatives to the wire and cable industry
Enabling technology for high performance fabric solutions
“Soft Touch”
covers and solutions to the automotive industry
NEXAR
®
–
high-end membrane technology markets for
performance clothing, HVAC applications and fuel cells
Co-extrusion technology for surface protection
Applications
Isoprene
Rubber Latex
Medical
applications
–
surgical
gloves
Material
substitution
–
condoms
HiMA
Protective Films
Soft Skins
IRL Gloves |
 26
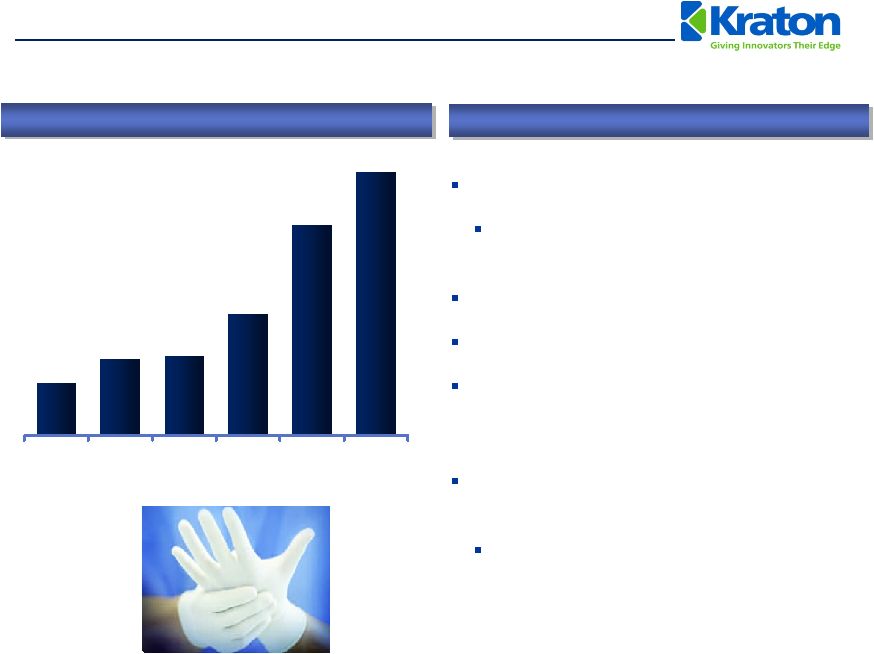
Innovation-led Top Line Growth
Tremendous growth
Rapidly capture share from $2.2 billion
natural rubber latex industry
Margins well in excess of rest of business
Leading producer in the market
Challenging process technology to
replicate for competitors and new
entrants
Commenced capacity expansion of
Paulinia, Brazil facility
Total planned IRL capacity expansion
of 33%
Case Study: IR Latex and IR Revenue Growth
Key Attributes
$15
$22
$23
$35
$76
$61
2005
2006
2007
2008
2009
Q3 2010
TTM
(US$ in millions) |
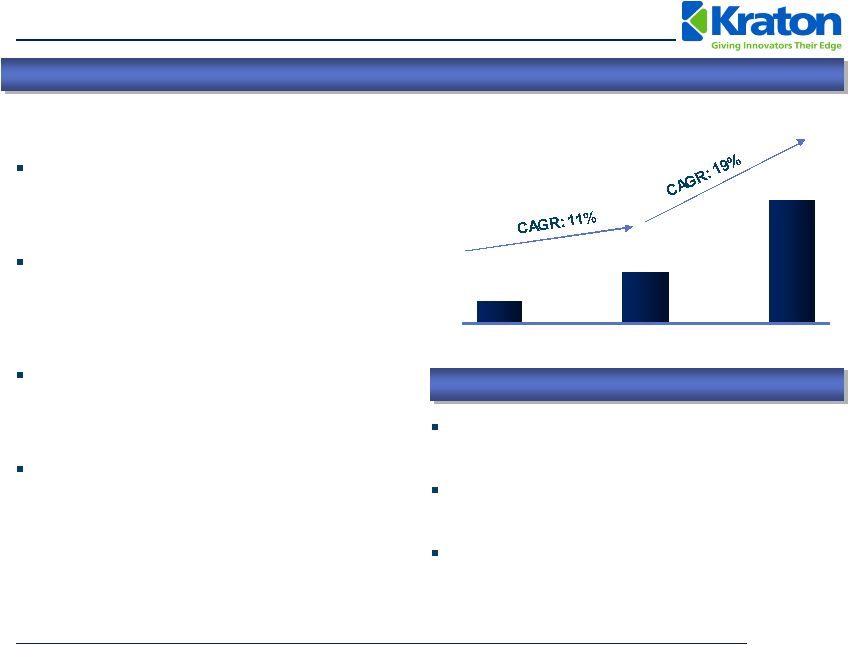 27
27
62
149
2001
2009
2014
Investing for Growth In Asia
Asia Pacific SBC market –
53% of
global SBC consumption by volume in
2009
(1)
YTD September 2010, Asia Pacific
accounted for 20% of our total
revenue, with 46% derived from higher
margin HSBC products
In 2010 relocated Shanghai, China
office to a new facility (double the size
of the previous location)
Expanded warehouse capacity in
Shanghai Waigaoqiao
Free Trade
Zone
Proposed HSBC expansion in Asia
Forecast strong worldwide growth in HSBC
driven by innovation
Initiated project assessment for a new 30 kT
per year HSBC plant in Asia
Site selection by early 2011 with start-up
planned for second half of 2013
Asia is an important component of Kraton’s
growth strategy
Asian HSBC Industry Demand Trends (kT)
(1)
Management estimates. Includes SBC consumption for footwear, a market
in which Kraton does not actively compete. |
 Financial
Overview |
 29
Update
on
2010
Business
Priorities
–
Q3
2010
Innovation-led Top-line
Growth
Capital Investment
Realizing benefits from ERP implementation
IR and IRL projects continue on plan; operational mid-
2011
Belpre DCS project progressing well
Actively engaged in evaluation of alternatives for
additional HSBC capacity
Earnings Growth
Net Income was $28 million, up $6 million from Q3 2009
Pace of raw material price increases moderated from
second quarter 2010
Adjusted EBITDA of $55 million
TTM Adjusted EBITDA margin on sales revenue of 16%
29
TTM vitality index 13%
Good momentum in PVC alternatives for wire & cable
and medical applications
Pipeline includes Soft Skins in automotive applications,
Cariflex
TM
IR products and advances in protective films |
 30
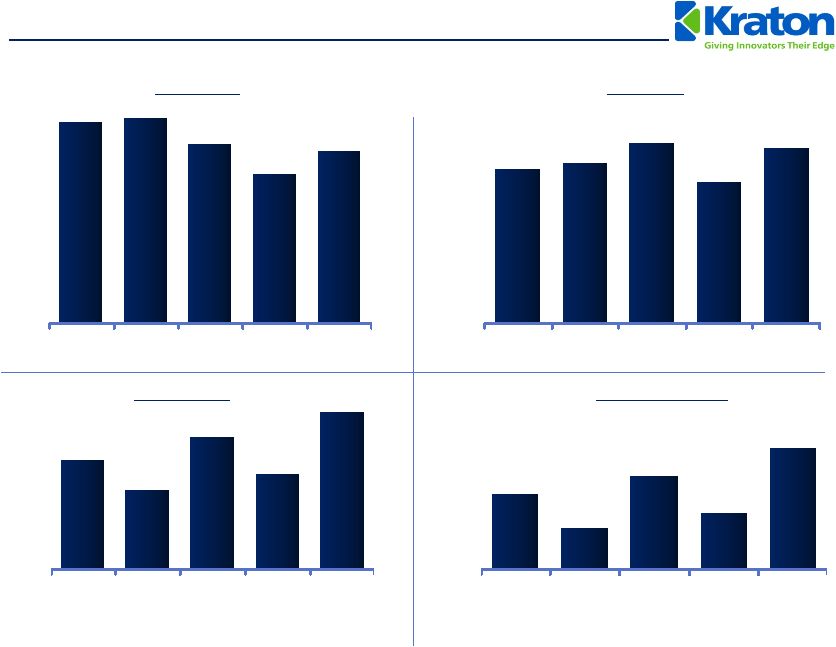
Historical Financial
Summary
Volume (kT)
Revenue
(1)
Gross Profit
(2)
Adjusted EBITDA
(3)
(US$ in millions)
(1)
Includes by-product revenue.
(2)
Adjusted for restructuring charges
(3)
Adjusted EBITDA is GAAP EBITDA excluding sponsor fees, restructuring and related charges, non-cash
expenses, and the gain on extinguishment of debt. $210
$255
$302
$153
$182
2006
2007
2008
2009
Q3 10
TTM
$122
$68
$152
$91
$196
2006
2007
2008
2009
Q3 10
TTM
352
358
313
301
260
2006
2007
2008
2009
Q3 10
TTM
Margin:
20.0% 14.1% 20.8% 18.8%
25.4%
Margin:
11.6% 6.3% 12.4% 9.4%
16.4%
$1,048
$1,226
$1,191
$1,090
$968
2006
2007
2008
2009
Q3 10
TTM |
 31
Attractive Free Cash Flow Dynamics
$196 million of TTM September 30, 2010 Adjusted EBITDA
(1)
Meaningful
operating
leverage
–
$55
million
of
annualized
net
cost
reduction since 2007
Favorable demand drivers will drive strong volume growth
Attractive
Earnings
Power
Drivers of Free Cash Flow
$15 million historical average annual maintenance capex
Low Level of
Maintenance
Capex
$78 million of cash at September 30, 2010
Net Debt-to-Cap ratio of 40% at September 30, 2010, with Net Debt to
September 30, 2010 TTM Adjusted EBITDA of 1.56x
Capital
Structure
Near-term cash tax rate of 10% -
13%
$331 million NOL balance as of December 31, 2009
Low Cash
Tax Rate
Reduced quantity of finished goods inventory by nearly 20% excluding
isoprene rubber build, since year end 2006
Minimal impact on service levels
Target working capital (excl. cash) as % of revenue of ~25%
Moderate
Working
Capital Needs
(1)
Adjusted EBITDA is GAAP EBITDA excluding sponsor fees, restructuring and related charges, non-cash
expenses, and the gain on extinguishment of debt. |
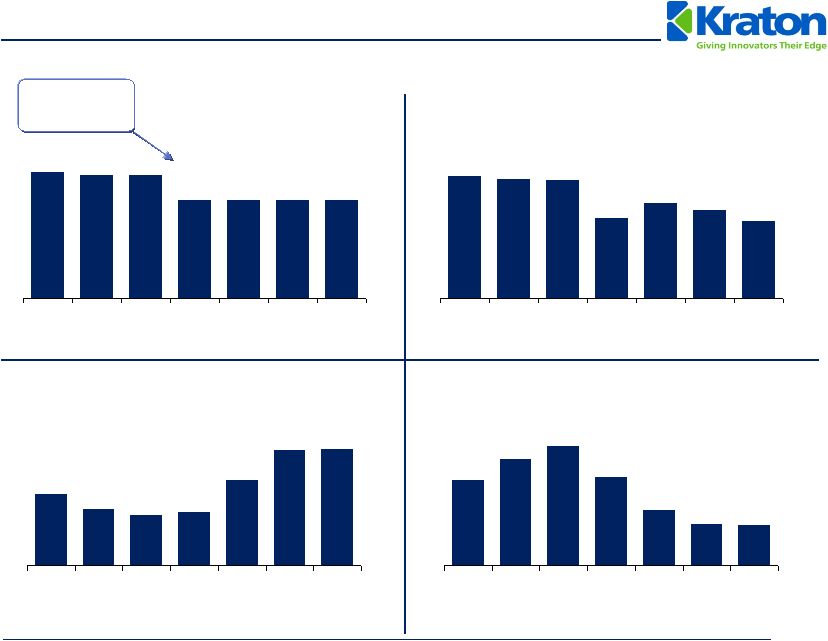 TTM
Adjusted EBITDA (2)
$120
$95
$85
$91
$144
$194
$196
3/09
6/09
9/09
12/09
3/10
6/10
9/10
32
Gross Debt
(1)
$497
$486
$486
$385
$388
$386
$385
3/09
6/09
9/09
12/09
3/10
6/10
9/10
Net Debt
(1)
$484
$469
$463
$316
$376
$347
$306
3/09
6/09
9/09
12/09
3/10
6/10
9/10
Leverage Ratio
(3)
4.1x
5.1x
5.7x
4.2x
2.7x
2.0x
2.0x
3/09
6/09
9/09
12/09
3/10
6/10
9/10
Earnings Growth and Deleveraging
(US$ in millions)
Proceeds
from IPO
(1)
Gross Debt and Net Debt include insurance note payable.
(2)
Adjusted EBITDA is GAAP EBITDA excluding management fees, restructuring
and related charges, non-cash expenses, and the gain on extinguishment of debt.
(3)
Leverage ratio is calculated by dividing total Gross Debt by TTM
Adjusted EBITDA. |
 33
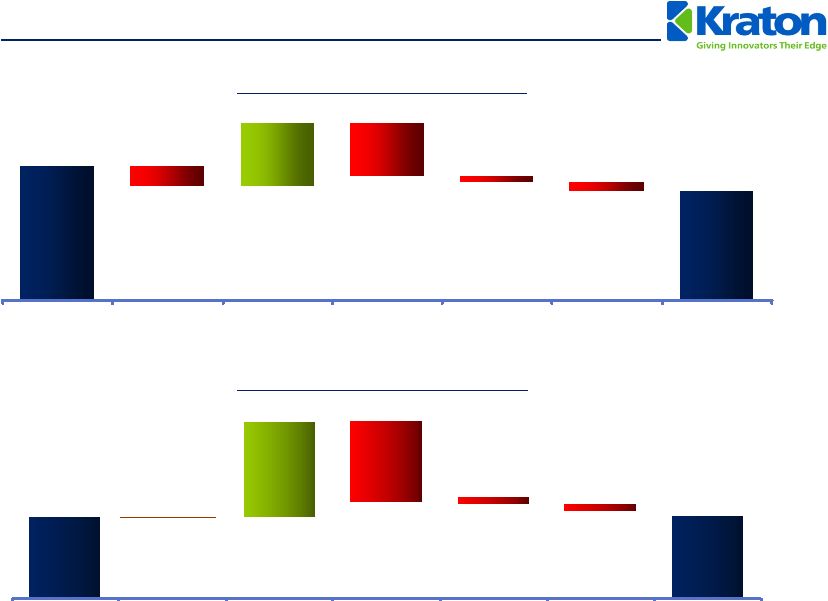
$63
$55
$20
($2)
($3)
($17)
($6)
Q2 2010
Volume
Price
COGS
R&D / SG&A
FX / Other
Q3 2010
Q3 2010 Adjusted EBITDA Walks
Adjusted EBITDA
(1)
–
Q3 2010 vs. Q2 2010
Adjusted EBITDA
(1)
–
Q3 2010 vs. Q3 2009
(US$ in millions)
(1)
Adjusted EBITDA is GAAP EBITDA excluding sponsor fees, restructuring and related charges, non-cash
expenses, and the gain on extinguishment of debt. $53
$55
$76
$-
($66)
($4)
($4)
Q3 2009
Volume
Price
COGS
R&D / SG&A
FX / Other
Q3 2010 |
 34
Expertise in market and application development, high quality manufacturing, customer service
offering, and core end-use focus
Provide application-based solutions to meet customers’
needs
Commercialize
next
generation
of
innovations,
e.g.,
Nexar™
non-woven
and
industrial
fibers,
oilfield service applications, protective films, etc.
Margin enhancement by improving or eliminating marginally profitable products
Extract value for complexity
Continue to identify opportunities to contract with key customers
Proactively manage raw material price volatility
Debottleneck capacity and improve assets
Polyisoprene
rubber
(IR)
expansion
at
Belpre,
Ohio
and
Isoprene
rubber
latex
(IRL)
capacity
expansion at Paulinia, Brazil
Evaluating options for additional HSBC capacity in Asia
Identify / pursue opportunities for cost reduction and productivity improvement
Execute on new IR manufacturing capacity at Belpre
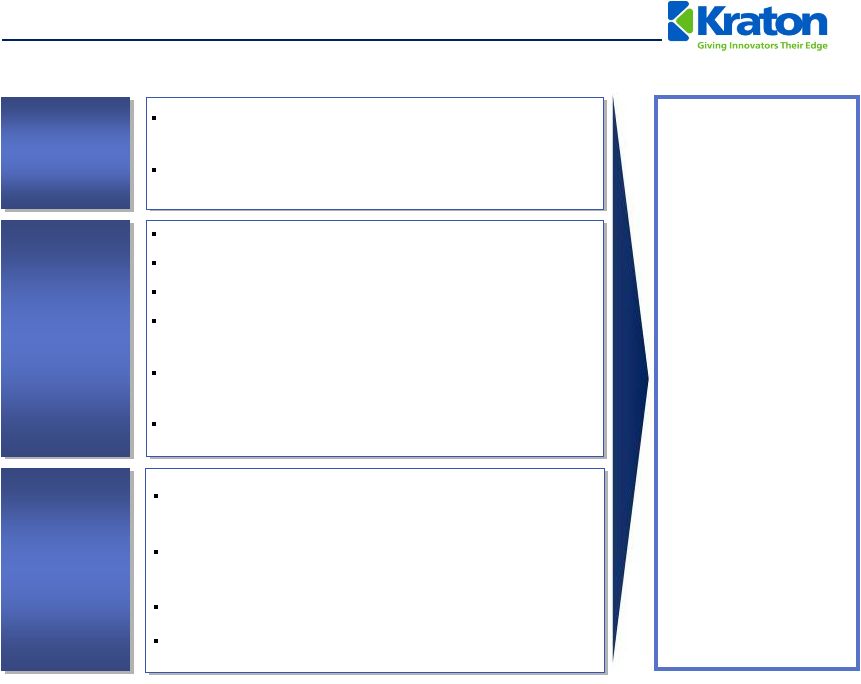
Leverage
Leadership
Position
Drive Growth
Through
Innovation
Continue
Smart Pricing
Invest in
Growth and
Infrastructure
Continuous
Productivity
Improvement
Go-Forward Business Strategy
Capital
Structure
Conservative approach to excess cash flow
Maintain flexibility to complete capital plans
Focus on improving ratings profile |
 Proposed Transaction
Overview |
 36
Proposed Transaction Overview
Kraton
intends to execute a comprehensive refinancing of its capital structure in February
2011 (assuming continued favorable capital market conditions).
Our objective is to raise a total of $550 million of debt financing ($400 million funded at
close): •
$150
million
in
undrawn
5-year
revolver.
•
$200 million in a 5-year Term Loan A.
•
$200 million in 8-year Senior Unsecured Notes.
The net proceeds of the financing will be used to redeem existing indebtedness including
Senior Notes, Discount Notes and Term Debt due 2013 and 2014.
The
redemption
of
the
Senior
Notes
due
2014
is
to
take
place
via
a
tender
offer.
Refinancing our capital structure today ensures:
•
Attractive low cost rate environment.
•
Extended maturity profile from 2013/2014 to 2016/2019.
•
Significant liquidity enhancement from $80 million cash flow revolver to $150 million cash
flow revolver. |
 37
Proposed Sources & Uses and Pro Forma Capitalization
($ in millions)
Sources of Funds
$
Uses of Funds
$
New Revolver ($150)
$0
Refinancing of Existing Debt
$383
New Term Loan A
200
Fees & Expenses
17
New Senior Unsecured Notes
200
Total Sources
$400
Total Uses
$400
Pro Forma
% of
($ in millions)
9/30/2010
Adj.
9/30/2010
Total Debt
xEBITDA
Cash
$78
$0
$78
Existing Revolver ($80)
--
--
New Revolver ($150)
--
--
--
Existing Term Loan
220
(220)
--
New Term Loan A
--
200
200
1.02x
Total Senior Secured Debt
$220
$200
50.0%
1.02x
New Sr. Uns. Notes
--
200
200
1.02x
Existing Sr. Sub. Notes
163
(163)
--
Total Debt
$383
$400
100.0%
2.04x
Net Debt
305
322
Adjusted EBITDA
$196
$196
Total Interest Expense
28
26
Capital Expenditures
50
50
Adjusted EBITDA / Total Interest Expense
7.08x
7.61x
(Adjusted EBITDA - Capex) / Total Interest Expense
5.28x
5.68x
TTM 9/30/10 Pro Forma Financials
Pro Forma Credit Statistics |
 38
Proposed Summary of Terms and Conditions
Borrower:
Kraton Polymers LLC (the “Borrower”)
Facilities:
$350 million Senior Secured Credit Facilities
$150 million Revolving Credit Facility
$200 million Term Loan A
Guarantors:
Kraton Performance Polymers, Inc. and all existing and future direct and indirect
material domestic subsidiaries of the Borrower
Security:
Maturity:
Revolver: 5.0 years
Term Loan A: 5.0 years
Pricing:
Revolver: To be announced (grid based on Consolidate Net Leverage Ratio)
Term Loan A: To be announced
Revolver Commitment Fee:
TBD (grid based)
Amortization:
Revolver: None
Term Loan A: 5%, 5%, 7.5%, 10%, 72.5%
Incremental Facilities:
$125 million (subject to a maximum Consolidated Net Leverage Ratio)
Optional Prepayments:
Anytime at par
Mandatory Prepayments :
100% asset sales
100% debt issuance (Above a Maximum Pro Forma Consolidated Net Leverage
Ratio) 50% excess cash flow (with step downs to 25% and 0% based on a
Consolidated Net Leverage Ratio) Financial Covenants:
Consolidated Net Leverage Ratio
Consolidated Net Interest Coverage Ratio
Maximum Capital Expenditures
First priority lien on substantially all tangible and intangible assets and capital stock of the
Borrower and the Guarantors, as well as 65% of the equity interests in first-tier
material foreign subsidiaries |
 Appendix
|
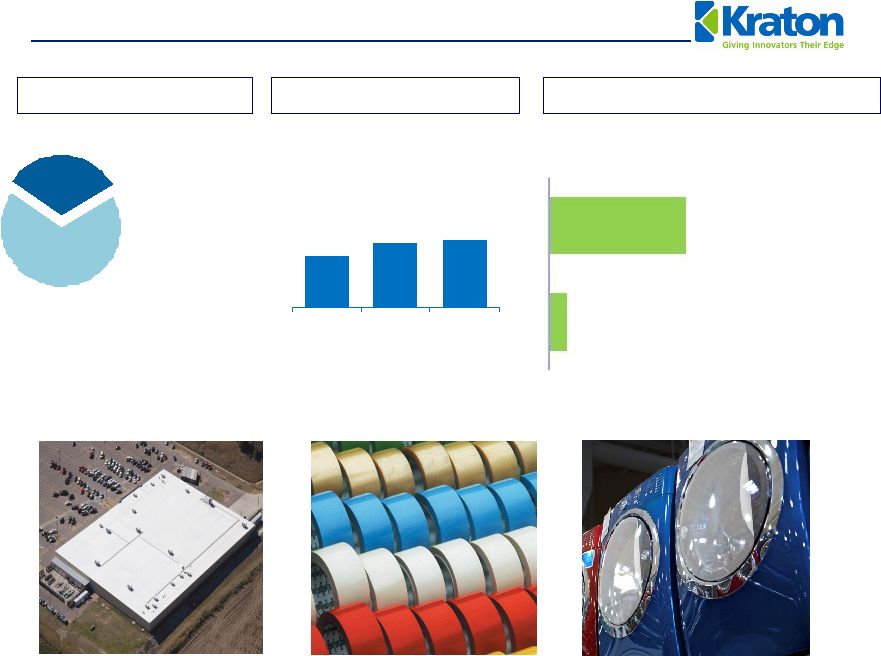 Adhesives, Sealants and
Coatings End Use Review 32%
TTM Revenue Profile
Change in Sales Revenue
40
Q3 2010 vs. Q3 2009
Q3 2010 vs. Q2 2010
End Use Revenue
US $ in millions
ASC
$83
$104
$108
0
50
100
150
Q3 09
Q2 10
Q3 10
4%
30% |
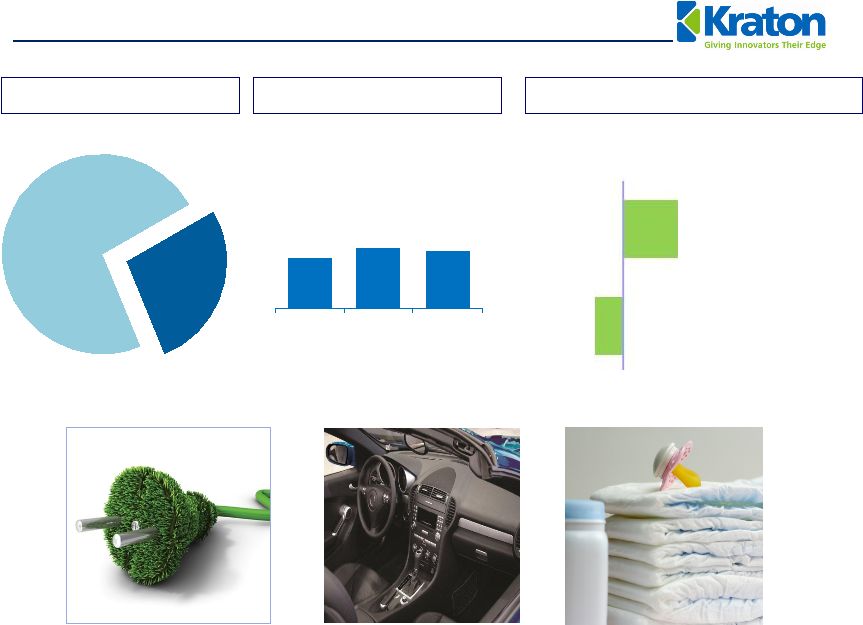 27%
Advanced Materials End Use Review
41
TTM Revenue Profile
Change in Sales Revenue
End Use Revenue
Change in Sales Revenue
US $ in millions
AM
Q3 2010 vs. Q3 2009
Q3 2010 vs. Q2 2010
$82
$98
$92
0
50
100
150
Q3 09
Q2 10
Q3 10
(6)%
12% |
 42
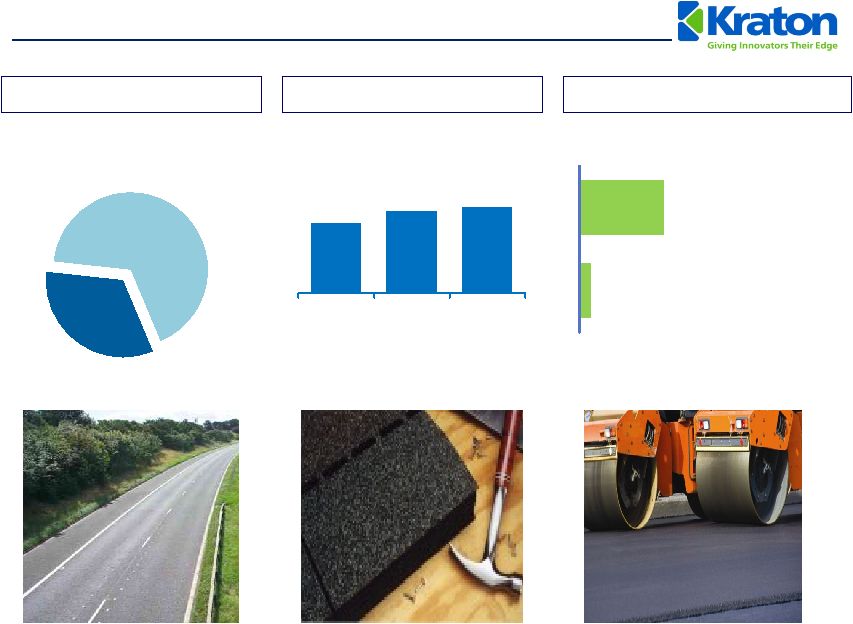
33%
P&R
22%
3%
$91
$107
$111
Q3 09
Q2 10
Q3 10
Paving and Roofing End-Use Review
TTM Revenue Profile
Change in Sales Revenue
End-Use Revenue
US $ in Millions
Q3 2010 vs. Q3 2009
Q3 2010 vs. Q2 2010 |
 43
6%
EB
$35
$61
$76
2009
2008
Q3 2010
$13
$19
$19
Q3 09
Q2 10
Q3 10
Emerging Businesses End-Use Review
TTM Revenue Profile
TTM Sales Revenue
End-Use Revenue
US $ in Millions
US $ in Millions |
 44
Reconciliation of Net Income / (Loss) to EBITDA
and Adjusted EBITDA
(US$ in millions)
(1)
The EBITDA measure is used by management to evaluate operating performance. Management believes that
EBITDA is useful to investors because it is frequently used by investors and other interested
parties
in
the
evaluation
of
companies
in
our
industry.
EBITDA
is
not
a
recognized
term
under
GAAP
and
does
not
purport
to
be
an
alternative
to
net
income
(loss)
as
an
indicator
of
operating
performance
or
to cash flows from operating activities as a measure of liquidity. Since not all companies use
identical calculations, this presentation of EBITDA may not be comparable to other similarly titled measures of
other companies. Additionally, EBITDA is not intended to be a measure of free cash flow for
management’s discretionary use, as it does not consider certain cash requirements such as interest payments,
tax payments and debt service requirements.
(2)
Adjusted EBITDA is EBITDA excluding management fees, restructuring and related charges, non-cash
expenses, and the gain on extinguishment of debt. Quarterly
Trailing Twelve Months
Q1 08
Q2 08
Q3 08
Q4 08
Q1 09
Q2 09
Q3 09
Q4 09
Q1 10
Q2 10
Q3 10
Q1 09
Q2 09
Q3 09
Q4 09
Q1 10
Q2 10
Q3 10
Net income
($9)
$10
$35
($7)
($17)
($4)
$22
($2)
$20
$39
$28
$21
$7
($6)
($0)
$36
$79
$85
Interest expense, net
10
9
8
9
9
8
8
9
6
6
6
35
34
34
34
31
30
28
Income tax expense
(0)
3
5
1
0
1
(2)
(1)
4
5
5
9
7
1
(1)
3
7
13
Depreciation and amortization
15
13
13
12
13
13
17
25
11
12
13
51
51
54
67
65
65
61
EBITDA
$16
$35
$61
$16
$5
$17
$45
$32
$41
$62
$52
$117
$98
$83
$99
$135
$180
$187
Sponsor fees and expenses
$1
$1
$1
$1
$1
$1
$1
$1
$0
$0
$0
$2
$2
$2
$2
$2
$1
$1
Restructuring and related charges
6
2
2
4
1
0
6
2
0
1
2
9
7
12
10
9
9
5
Other non-cash expenses
1
0
0
9
3
(1)
2
0
1
0
1
12
12
13
5
3
4
3
Gain in extinguishment of debt
0
0
0
0
(20)
(4)
0
0
0
0
0
(20)
(24)
(24)
(24)
(4)
0
0
Adjusted EBITDA
$23
$38
$63
$29
($10)
$13
$53
$35
$43
$63
$55
$120
$95
$85
$91
$144
$194
$196
Year Ended December 31,
2006
2007
2008
2009
Net income
($34)
($44)
$28
($0)
Interest expense, net
67
43
37
34
Income tax expense
30
6
8
(1)
Depreciation and amortization
44
52
53
67
EBITDA
$106
$58
$127
$99
Sponsor fees and expenses
$2
$2
$2
$2
Restructuring and related charges
11
6
14
10
Other non-cash expenses
3
3
10
5
Gain in extinguishment of debt
0
0
0
(24)
Adjusted EBITDA
$122
$68
$152
$91
(1)
(1)
(2)
(2) |