Attached files
| file | filename |
|---|---|
| 8-K - FORM 8-K - Rock-Tenn CO | d8k.htm |
 Acquisition of
Smurfit-Stone Container Corporation
January 24, 2011
Exhibit 99.1 |
 2
Cautionary Statement Regarding Forward-Looking
Information
This document contains forward-looking statements within the meaning of the Private
Securities Litigation Reform Act of 1995. Forward-looking statements are
typically identified by words or phrases such as “may,” “will,” “anticipate,” “estimate,” “expect,”
“project,” “intend,” “plan,” “believe,”
“target,” “forecast,” and other words and terms of similar meaning. Forward-looking
statements involve estimates, expectations, projections, goals, forecasts, assumptions,
risks and uncertainties. RockTenn cautions readers that any
forward-looking statement is not a guarantee of future performance and that actual results could differ
materially from those contained in the forward-looking statement. Such
forward-looking statements include, but are not limited to, statements
regarding the anticipated closing date of the transaction, the successful closing of the transaction and the
integration of Smurfit-Stone as well as opportunities for operational improvement
including but not limited to cost reduction and capital investment, the
strategic opportunity and perceived value to RockTenn and shareholders of the transaction, the
opportunity to recognize benefits from Smurfit-Stone’s NOLs, the
transaction’s impact on, among other things, RockTenn’s business mix,
margins, transitional costs and integration to achieve the synergies and the timing of such costs and synergies
and earnings. With respect to these statements, RockTenn and Smurfit-Stone have
made assumptions regarding, among other things, whether and when the proposed
transaction will be approved; whether and when the proposed transaction will close; the
availability of financing on satisfactory terms; the amount of debt RockTenn will
assume; the results and impacts of the acquisition; preliminary purchase price
allocations which may include material adjustments to the preliminary fair values of the
acquired assets and liabilities; economic, competitive and market conditions generally;
volumes and price levels of purchases by customers; competitive conditions in
RockTenn and Smurfit-Stone’s businesses and possible adverse actions of our
respective customers, competitors and suppliers. Further, Rock-Tenn and
Smurfit-Stone’s businesses are subject to a number of general risks
that would affect any such forward-looking statements including, among others, decreases in demand for their
products; increases in energy, raw materials, shipping and capital equipment costs;
reduced supply of raw materials; fluctuations in selling prices and volumes;
intense competition; the potential loss of certain customers; and adverse changes in
general market and industry conditions. Such risks and other factors that may impact
management’s assumptions are more particularly described in RockTenn and
Smurfit-Stone’s filings with the Securities and Exchange Commission, including under
the caption “Business – Forward-Looking Information” and “Risk
Factors” in RockTenn’s Annual Report on Form 10-K for the most
recently ended fiscal year and “Business – Risk Factors” and “Forward-Looking Information” in Smurfit-Stone’s Annual
Report on Form 10-K for the most recently ended fiscal year. The information
contained herein speaks as of the date hereof and neither RockTenn nor
Smurfit-Stone have or undertake any obligation to update or revise its forward-looking statements,
whether as a result of new information, future events or otherwise.
|
 3
Additional Information
Additional Information and Where to Find It
In connection with the proposed transaction, RockTenn and Smurfit-Stone will be
filing documents with the Securities and Exchange Commission (the
“SEC”), including the filing by RockTenn of a registration statement on Form S-4 that will include a
joint proxy statement of RockTenn and Smurfit-Stone that also constitutes a
prospectus of RockTenn. RockTenn and Smurfit- Stone stockholders are
urged to read the registration statement on Form S-4 and the related joint proxy statement/prospectus
when they become available, as well as other documents filed with the SEC, because they
will contain important information. The final joint proxy statement/prospectus
will be mailed to stockholders of RockTenn and stockholders of Smurfit-Stone.
Investors and security holders may obtain free copies of these documents (when they are
available) and other documents filed with the SEC at the SEC’s web site at
www.sec.gov, or by contacting RockTenn Investor Relations at (678) 291-7901 or
Smurfit-Stone Investor Relations at (314) 656-5553 or Smurfit-Stone Media
Relations at (314) 656-5827. Participants in the Merger Solicitation
RockTenn, Smurfit-Stone and their respective directors, executive officers and
other members of management and employees may be deemed to be participants in
the solicitation of proxies in respect of the transaction. Information concerning
RockTenn’s executive officers and directors is set forth in its definitive proxy
statement filed with the SEC on December 17, 2010. Information concerning
Smurfit-Stone’s executive officers and directors is set forth in its annual report on Form 10-K for
the year ended December 31, 2009, which was filed with the SEC on March 2, 2010,
and in its current report on Form 8-K filed on July 7, 2010.
Additional information regarding the interests of participants of RockTenn and Smurfit-Stone in the solicitation
of proxies in respect of the transaction will be included in the above-referenced
registration statement on Form S-4 and joint proxy statement/prospectus when
it becomes available. You can obtain free copies of these documents from RockTenn and
Smurfit-Stone using the contact information above. |
 Transaction Overview
4
RockTenn has agreed to acquire Smurfit-Stone Container Corporation, the
second-largest North American containerboard and corrugated container
manufacturer
–
Combined pro forma company total net sales exceeding $9 billion and Pro Forma
Adjusted EBITDA of $1.34
billion
(1)
, pre-synergies
Purchase price of $35/share, payable 50% in cash and 50% in RockTenn shares
Total purchase consideration of $5.0 billion, including Smurfit-Stone net debt of
$0.7 billion at 12/31/10 and after-tax unfunded pension liability of $0.7
billion –
Purchase price is 6.1 times Q4 2010 annualized Adjusted EBITDA of $820
million
Estimated credit agreement leverage ratio of 2.76 times funded debt at close
Transaction is accretive to RockTenn shareholders on a pro forma
historical basis
–
accretion of 16.5% per diluted RockTenn share
(1)
(1)
Pro Forma Adjusted EBITDA is RockTenn LTM 12/31/10 Credit Agreement EBITDA plus
annualized Smurfit-Stone Adjusted EBITDA for three months ended
12/31/2010 |
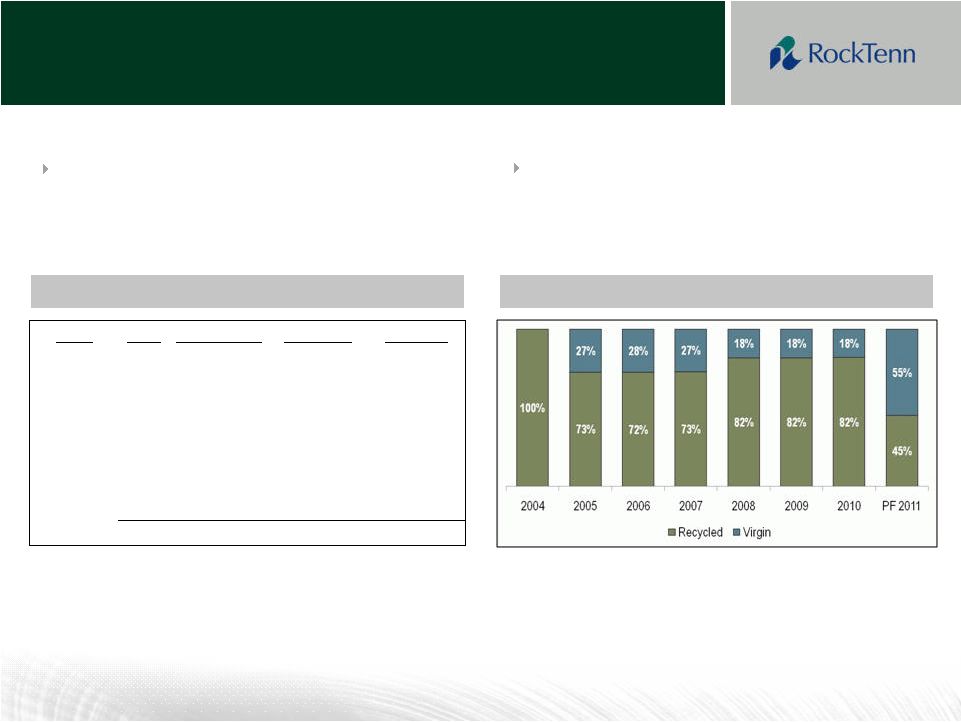
 The New
RockTenn 5
Segment EBITDA Mix
Paperboard Capacity Mix
Segment Sales Mix
Total Segment EBITDA: $337m
(Quarter ended 12/31/10)
(1)
Total Capacity: 9.4 million tons
Fiber Mix
(2)
:
55% virgin
45% recycled
Total Segment Sales: $2.4B
(Quarter ended 12/31/10)
(1)
(1)
Segment sales and segment EBITDA assume 100% of Smurfit-Stone sales and Adjusted
EBITDA are reported in RockTenn’s Corrugated Packaging segment (2) Virgin containerboard includes some recycled fiber input
|
 Compelling Strategic Acquisition
Containerboard has become a very good business
US virgin containerboard is a highly strategic global asset
Smurfit-Stone’s assets are much lower cost than before their
transformation Ample opportunities to improve cost position through continued
transformation of box plant system and investments in mills
Estimated annual transaction synergies run rate of $150 million within 24
months after transaction close
6
RockTenn’s customer-focused value approach to the market, disciplined execution
and record of continuous operational and administrative excellence provide broad
runway for operational gains |
 7
Acquisition Consistent with RockTenn’s
Core
Business Principles
7
7
Providing superior paperboard, packaging and marketing
solutions for consumer products companies at very low
costs
RockTenn‘s
expanded network of mills and converting plants are
cost-competitive with new opportunities to further optimize the
combined system
Investing for competitive advantage
RockTenn’s
and Smurfit-Stone’s assets are well-capitalized, with
significant identified opportunities for further profit-improving
investments
Maximizing the efficiency of our manufacturing processes
by optimizing economies of scale
Acquisition results in increase in economies of scale
Systematically improving processes and reducing costs
throughout the Company
Acquisition
combines
RockTenn’s
Six
Sigma
continuous
improvement method with Smurfit-Stone’s Lean Manufacturing
method to further optimize manufacturing and administrative
processes
Seeking acquisitions that can dramatically improve the
business
Acquisition brings increased scale and strong nationwide customer
relationships
and
rebalances
RockTenn’s
fiber
sourcing
RockTenn
will be the most respected company in our business by: |
 Transaction Highlights
8
Consideration
Fixed ratio of 0.30605 RKT shares per SSCC share plus $17.50 in cash per SSCC
share Ownership
56% RockTenn / 44% Smurfit-Stone
Refinance of Existing
Smurfit-Stone Debt
Refinance of Smurfit-Stone debt (estimated $745 million at 12/31/10, after giving
effect to $449 million in Smurfit-Stone cash)
Synergies
$150 million of annual run-rate synergies, to be achieved within 24 months of
close Board of Directors
13 Directors - 10 from RockTenn / 3 from Smurfit-Stone
Senior Leadership Team
James A. Rubright - Chairman, CEO
Steven C. Voorhees - EVP, CAO and CFO
James B. Porter III - EVP, Corrugated Packaging
Headquarters
Corporate HQ in Norcross, GA
Transaction Close
Expected in the second calendar quarter of 2011, subject to shareholder vote and
customary approvals
Financing
Committed financing from Wells Fargo, Rabobank, and SunTrust
|
 9
North American Containerboard Demand
North American Containerboard Production Capacity
North American Containerboard Inventory Levels
Source: RISI
Strong North American Containerboard Fundamentals
NA Containerboard Capacity Change and Operating Rate |
 77%
74%
55%
30%
29%
15%
23%
26%
45%
70%
71%
85%
Africa
North
America
Oceania
Latin
America
Europe
Asia
Virgin
Recycled
North American Containerboard Is Low-cost in the World
Market
10
Global Capacity by Fiber Type
Global Containerboard Cost Per Ton by Region
North America holds a cost advantage versus other regions
Significant share of global market capacity is recycled, and that share is expected to
grow $279
$292
$302
$320
$320
$383
Oceania
North
America
Latin
America
Africa
Europe
Asia
Source: RISI
Total Capacity
1.5
2.5
8.0
29.3
46.1
37.4
Capacity (mm tons) |
 Grade
#PMs
Recycled Tons
Virgin Tons
Total Tons
Linerboard
15
528,000
4,174,000
4,702,000
Medium
12
1,584,000
1,190,000
2,774,000
SBS
2
-
475,000
475,000
CRB
7
620,000
-
620,000
URB
6
380,000
-
380,000
Pulp
2
-
375,000
375,000
Kraft
1
-
79,000
79,000
Total
45
3,112,000
6,293,000
9,405,000
Diversified Containerboard and Paperboard Mill System
11
Rebalancing RockTenn’s
fiber sourcing to
55% virgin / 45% recycled
45 paper machines across 25 mills,
producing the most attractive grades of
containerboard and paperboard
Fiber Mix
Mill Capacity by Grade
Note: Some virgin containerboard is manufactured with some recycled content
|
 12
Containerboard Footprint
RockTenn
Box Plants
RockTenn
Mills
Smurfit-Stone Box Plants
Smurfit-Stone Mills
Not shown: 3 Smurfit-Stone box plants in Mexico and 1 in Puerto Rico
Hodge,
LA
Kraft Linerboard
Capacity: 808,000 tons
Panama
City,
FL
Kraft Linerboard
Capacity: 337,000 tons
Hardwood Market Pulp
Capacity: 275,000 tons
Seminole,
FL
Recycled Medium
Capacity: 200,000 tons
Recycled Linerboard
Capacity: 388,000 tons
Fernandina
Beach,
FL
Kraft Linerboard
Capacity: 930,000 tons
Stevenson,
AL
Semi-Chemical Medium
Capacity: 885,000 tons
Florence,
SC
Kraft Linerboard
Capacity: 683,000 tons
Hopewell,
VA
Kraft Linerboard
Capacity: 443,000 tons
West
Point,
VA
Kraft Linerboard
Capacity: 309,000 tons
White Top Linerboard
Capacity: 399,000 tons
Recycled Medium
Capacity: 184,000 tons
Uncasville,
CT
Recycled Linerboard
Capacity: 165,000 tons
Coshocton, OH
Semi-Chemical Medium
Capacity: 305,000 tons
Solvay, NY
Recycled Linerboard
Capacity: 600,000 tons
Recycled Medium
Capacity: 200,000 tons
St. Paul, MN
Recycled Medium
Capacity: 200,000 tons
Matane,
QC
Semi-Chemical Medium
Capacity: 176,000 tons
La Tuque, QC
White Top Linerboard
Capacity: 345,000 tons
SBS
Capacity: 131,000 tons |
 Combined business has predominately first, second and third quartile
containerboard assets
–
Smurfit-Stone
has
closed
8
mills
2005
-
present
Smurfit-Stone
has
taken
out
significant
costs
over
the
last
three
years,
with
further
improvements ahead
Well-capitalized, Low-cost Containerboard
Manufacturing Assets
13
$293/ton
Industry Average
Source: Q3 2010 RISI and company data
Note: La Tuque bleached liner/SBS mill not shown on cost curve chart
Containerboard
Cost
Curve
–
Sep
Qtr
2010
-
50
100
150
200
250
300
350
400
450
500 |
 14
RockTenn’s
Bleached Paperboard and Coated Recycled Board
Low-cost Capacity
Source: RISI, Folding Carton Grade only
RISI
Bleached
Board
Cost
Curve
–
Sep
Qtr
2010
RISI CRB Cost Curve –
Sep Qtr 2010
Source: RISI |
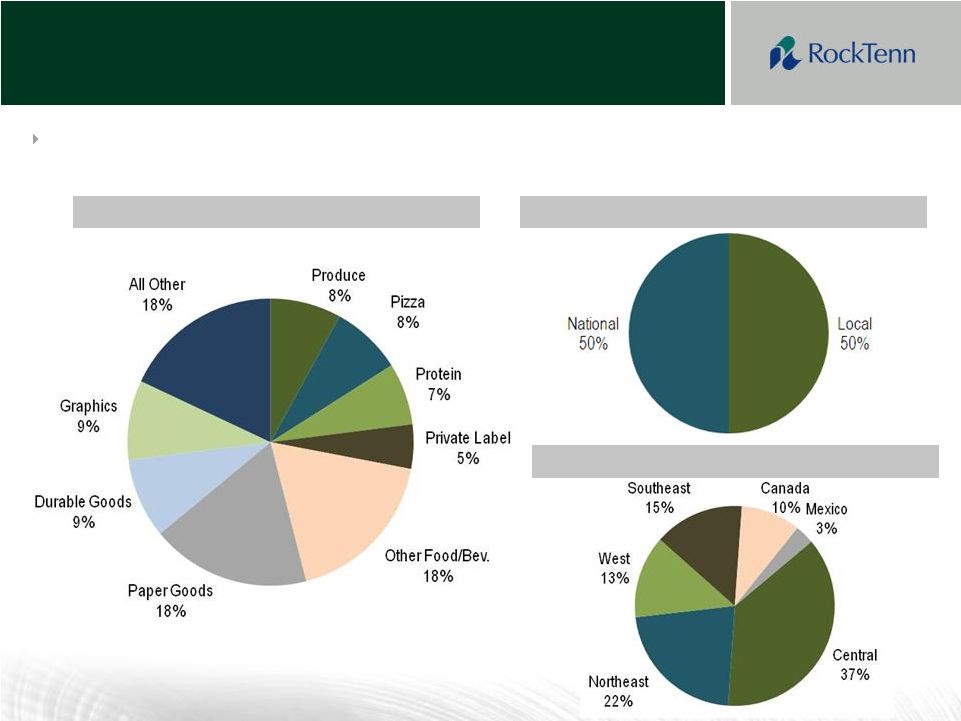 15
Smurfit-Stone Customer Overview
Container Sales by Account Type
Container Sales by Region
Container Sales by End-Use Segment
Smurfit-Stone container plant customer base is
geographically diverse, with 46% of sales from
the food and beverage segment |
 Smurfit-Stone Container Plant Investments and Results
16
The Smurfit-Stone corrugated box plant has
been consolidated with over $550 million of
capital invested since 2007
Targeted investments to:
–
Increase throughput and capacity –
29%
increase in plant throughput since 2005
–
Reduce number of facilities (53 closed
since 2006), headcount (down 42% since
2006) and conversion costs (down 18%
since 2008)
–
Achieve sustainable improvement in
earnings
As a result, total conversion cost per ton is
down 10% compared to 2009
277
298
269
Container Plant Conversion Costs
(7.6%)
2.9%
Source: FBA and company estimates
Total conversion cost per ton is now 3% lower
than the FBA industry average for 2009 |
 17
Improving Container Plant Metrics
31.6
4.60
3.12
40.6
26.1
Up 56%
Up 31%
Down 18%
Smurfit-Stone container plants are more efficient and lower cost than perceived
|
 Significant Targeted Synergies
18
–
Box plant optimization
–
Logistics optimization
Manufacturing Optimization
Purchasing, Fiber Sourcing and Transportation
Corporate Overhead
–
Public company costs
–
Management and facility integration
–
IT integration
–
Economies of scale
–
Alignment and optimization
Annual
Synergies
($m)
Manufacturing
Optimization
Purchasing, Fiber
Sourcing, and
Transportation
Corporate
Overhead
$0
$50
$100
$150
$200 |
 19
19
Smurfit-Stone’s corrugated assets will be combined with RockTenn’s
corrugated assets under
the leadership of Jim Porter with a four-pronged integration strategy:
•
Complete the box plant consolidation and optimization strategy initiated by SSCC
management
•
Opportunities to invest capital in the mill system and optimize the footprint to
reduce cost and maximize production efficiency
•
Apply the RockTenn
management model to the box plant system, driving product
innovation, customer satisfaction and low-cost manufacturing while maximizing
sales revenue
•
Consolidate
the
divisional
entity
into
one
RockTenn
headquarters
located
in
Norcross,
GA
Administrative integration to be led by Steve Voorhees, who led the successful Gulf
States and Southern Container integrations
Integration Strategy |
 Smurfit-Stone Pension Overview
20
Pension Asset and Liability Overview
Projected Pension Expense and Contributions
Smurfit-Stone Projected Pending Funding Status, Expense and Cash Contributions
(Represents United States and Canadian Defined Benefit Pension Plans)
For the Periods Ending 12/31
2011
2012
2013
2014
Underfunded Amount
($1,004)
($702)
($402)
($122)
Funded %
73%
81%
89%
97%
2011
2012
2013
2014
GAAP Pension Expense
$42
$30
$9
($8)
Cash Contributions
$122
$323
$338
$348
12/31/2010
Projected Benefit Obligation
$3,862
Asset Values
$2,730
Unfunded Amount
$1,132
Funded Ratio
71%
Discount Rate (US)
5.32%
Discount Rate (Canada)
5.15%
Rate of Return Assumption (US)
7.75%
Rate of Return Assumption (Canada)
6.30% |
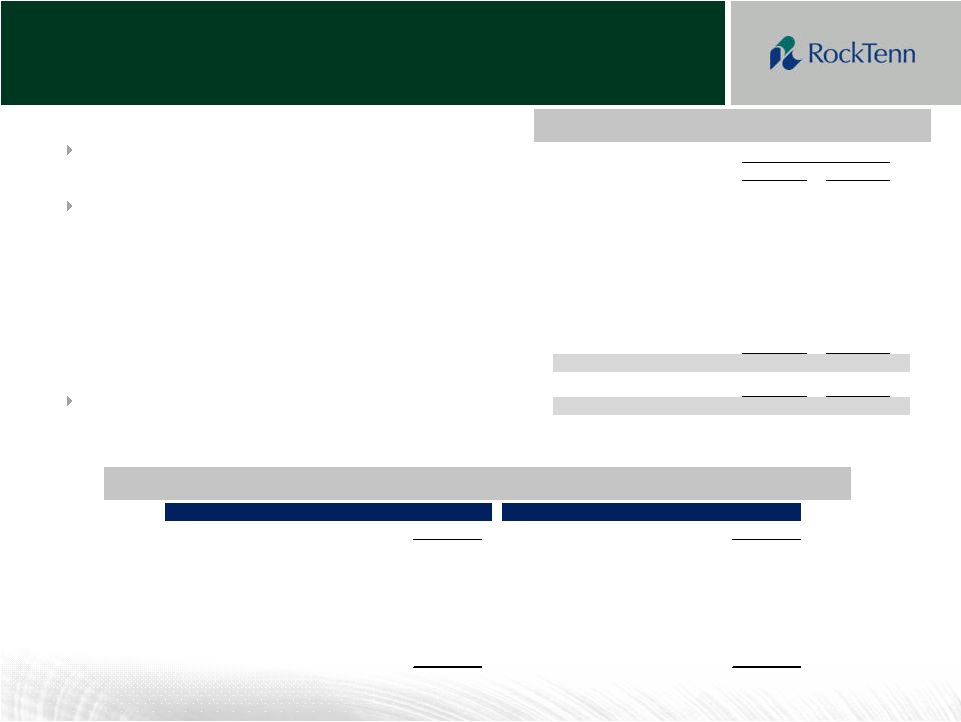 Financing Overview and Capitalization Table
Wells
Fargo,
SunTrust
and
Rabobank
are
providing $3.7 billion to fund the transaction
Commitment is structured as a senior credit facility
in three tranches:
–
$1.2 billion Revolving Credit Facility and
$1.25 billion Term Loan A, both with a five
year maturity
–
$1.25 billion Term Loan B with a six year
maturity
Capital structure includes estimated $500 million
liquidity at closing
Capitalization Table
Sources & Uses
21
(millions)
Amount
Amount
New Equity issued
1,768
Purchase of Smurfit-Stone Equity
3,536
Smurfit-Stone Existing Cash
442
Retirement of Smurfit-Stone Debt
1,156
$1.2B New Revolver
632
Retirement of RockTenn Debt
469
New Term Loan A
1,250
Financing Fees
89
New Term Loan B
1,250
Executive Contract Payments
42
Smurfit-Stone Transaction Costs
30
RockTenn Transaction Costs
20
Total Sources
5,342
Total Uses
5,342
Sources of Funds
Uses of Funds
(millions)
Actual
%
$1.2 billion Revolver
631.9
$
9.6
%
Term Loan A
1,250.0
19.0
Term Loan B
1,250.0
19.0
2011 Notes
154.7
2.4
2013 Notes
80.5
1.2
Receivables due 2012
0.0
0.0
Other Secured Debt
36.1
0.5
2016 Notes
300.0
$
4.6
%
Other
-
-
Total Net Debt
3,703.2
$
56.3
%
Shareholders' Equity
2,877.8
43.7
Total Capitalization
6,581.0
$
100.0
%
Pro Forma Adjusted EBITDA
(1)
1,341.6
$
Pro Forma Leverage Ratio
2.76x
Capitalization at Close
(1)
Pro Forma Adjusted EBITDA is RockTenn LTM 12/31/10 Credit Agreement EBITDA plus
annualized Smurfit-Stone Adjusted EBITDA for three months ended
12/31/201010 |
 Conclusion
Combined RockTenn
and Smurfit-Stone
–
#2 producer of containerboard in North America
–
#2 producer of coated recycled board in North America
–
Management team with strong record of shareholder value creation
and excellent
record of integrating acquisitions
–
The mix of fiber inputs is 55% virgin fiber and 45% recycled fiber
–
Expands geographic footprint to the Midwest and West Coast
–
Conservative capital structure with significant liquidity at close
–
Opportunity to improve results through cost reduction and capital investment
22
We believe the acquisition of Smurfit-Stone represents a significant
opportunity
to
continue
our
track
record
of
creating
shareholder
value |
 23
EBITDA Definitions
Pro Forma Adjusted EBITDA (as defined)
Pro
Forma
Adjusted
EBITDA
is
calculated
as
the
sum
of
RockTenn’s
Credit
Agreement
EBITDA
and
Smurfit-Stone’s
Adjusted
EBITDA plus pro forma adjustments consistent with the two.
Credit Agreement EBITDA
RockTenn’s
“Credit
Agreement
EBITDA”
is
calculated
in
accordance
with
the
definition
contained
in
our
existing
Senior
Credit
Facility. Credit Agreement EBITDA is generally defined as Consolidated Net Income plus:
consolidated interest expense, income taxes of the consolidated companies
determined in accordance with GAAP, depreciation and amortization expense of the
consolidated companies determined in accordance with GAAP, certain non-cash and
cash charges incurred, and charges taken resulting
from
the
impact
of
changes
to
accounting
rules
related
to
the
expensing
of
stock
options.
Smurfit-Stone’s Adjusted EBITDA
Smurfit-Stone’s EBITDA is generally defined as Net income plus: interest
expense, income taxes, interest expense, net and depreciation, depletion and
amortization. Adjusted EBITDA is defined as EBITDA adjusted for reorganization items, restructuring
charges and gain or loss on disposal of assets. |