Attached files
| file | filename |
|---|---|
| 8-K - FORM 8-K - People's United Financial, Inc. | d8k.htm |
| EX-99.1 - EXHIBIT 99.1 - People's United Financial, Inc. | dex991.htm |
EXHIBIT 99.2
Investor Presentation dated January 21, 2011
 Fourth Quarter 2010
Earnings Review
and
Acquisition Announcement -
Danvers Bancorp (DNBK)
January 21, 2011 |
 1
Certain comments made in the course of this presentation by People's United Financial are
forward- looking in nature. These include all statements about People's United
Financial's operating results or financial position for periods ending or on dates occurring
after December 31, 2010 and usually use words such as "expect", "anticipate",
"believe", and similar expressions. These comments represent management's
current beliefs, based upon information available to it at the time the statements are made,
with regard to the matters addressed.
All forward-looking statements are subject to risks and uncertainties that could cause People's
United Financial's actual results or financial condition to differ materially from those
expressed in or implied by such statements. Factors of particular importance to People’s
United Financial include, but are not limited to: (1)
failure of the parties to satisfy the closing conditions in the merger agreement in a timely manner or
at all;
(2)
failure
of
the
shareholders
of
Danvers
Bancorp
to
approve
the
merger
agreement;
(3)
failure
to
obtain governmental approvals for the merger; (4)
disruptions to the parties’
businesses as a result of the
announcement
and
pendency
of
the
merger;
(5)
costs
or
difficulties
related
to
the
integration
of
the
businesses
following
the
merger
with
Danvers
Bancorp
and
recent
acquisitions;
(6)
changes
in
general,
national
or
regional
economic
conditions;
(7)
the
risk
that
the
anticipated
benefits,
cost
savings
and
any
other savings from the transaction may not be fully realized or may take longer than expected to
realize (8)
changes
in
loan
default
and
charge-off
rates;
(9)
reductions
in
deposit
levels
necessitating
increased
borrowings
to
fund
loans
and
investments;
(10)
changes
in
interest
rates
or
credit
availability;
(11)
possible
changes
in
regulation
resulting
from
or
relating
to
the
recently
enacted
financial
reform
legislation;
(12)
changes in levels of income and expense in noninterest income and expense related activities; (13)
competition and its effect on pricing, spending, third-party relationships and revenues.
Forward Looking Statement |
 2
Agenda
Fourth Quarter 2010 Results
Integration Update
Acquisition of Danvers Bancorp (DNBK)
Q&A |
 3
Net income of $32.0 million, or $0.09 per share
Operating income of $36.7 million, or $0.10 per share, excluding
primarily merger-related expenses
Net interest margin of 3.85%; up 12 bps from Q3 2010
Net charge-offs to average loans decreased to 0.28% from 0.57%
in Q3 2010
NPAs
as a percentage of originated loans, REO and repossessed assets
fell to 2.07% from 2.18% as of Q3 2010
Organic loan growth of $221MM
Fourth Quarter 2010 Results
Overview |
 4
Smithtown and RiverBank
transactions closed Nov. 30, 2010
Boston branches, Prudential Center and Financial District, opened mid-
December in 2010
Jeff Tengel became new head of Commercial Banking effective
January 1, 2011 following Brian Dreyer’s retirement at the end of 2010
Repurchased
$114
million
of
stock
in
4Q10
(8.7
million
shares
at
an
average price of $13.08)
2.9 million shares remain under initial share repurchase authorization
Board of Directors has authorized an additional 5% share repurchase
program, approximately 17.5 million shares
Recent Initiatives |
 5
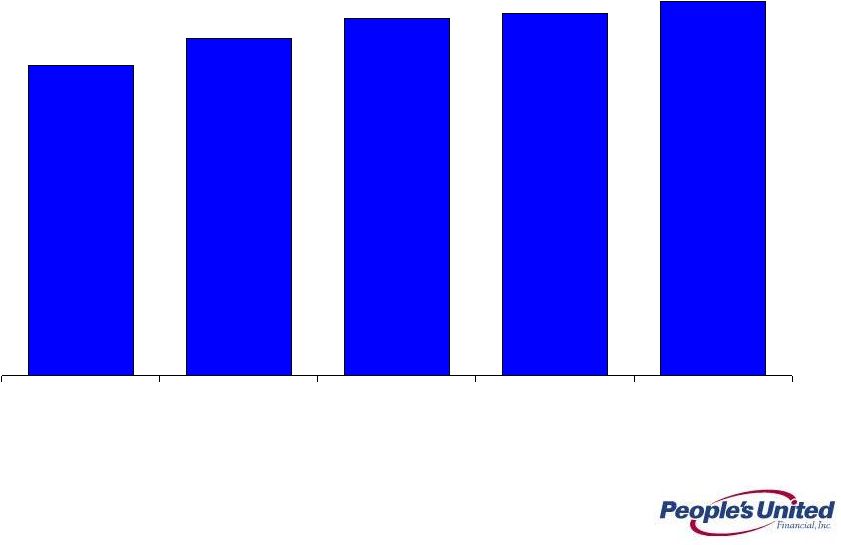
Net Interest Margin
5
3.19%
3.47%
3.68%
3.73%
3.85%
Q4 2009
Q1 2010
Q2 2010
Q3 2010
Q4 2010 |
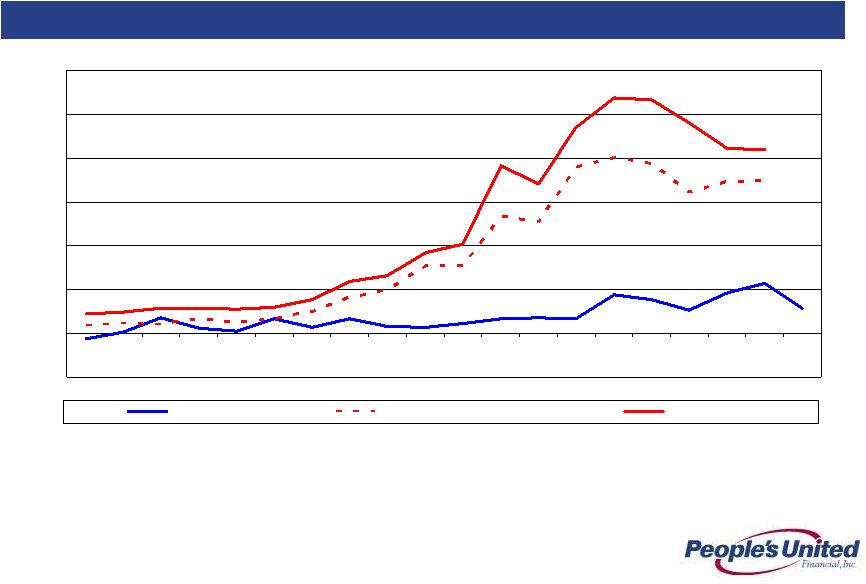 6
2006-2010
0.28
0.57
1.74
2.10
-0.50
0.00
0.50
1.00
1.50
2.00
2.50
3.00
Q1
2006
Q2
2006
Q3
2006
Q4
2006
Q1
2007
Q2
2007
Q3
2007
Q4
2007
Q1
2008
Q2
2008
Q3
2008
Q4
2008
Q1
2009
Q2
2009
Q3
2009
Q4
2009
Q1
2010
Q2
2010
Q3
2010
Q4
2010
PBCT
Peer Group Mean
Top 50 Banks
Fourth Quarter 2010 Results
Net Charge-Offs / Avg. Loans (%) |
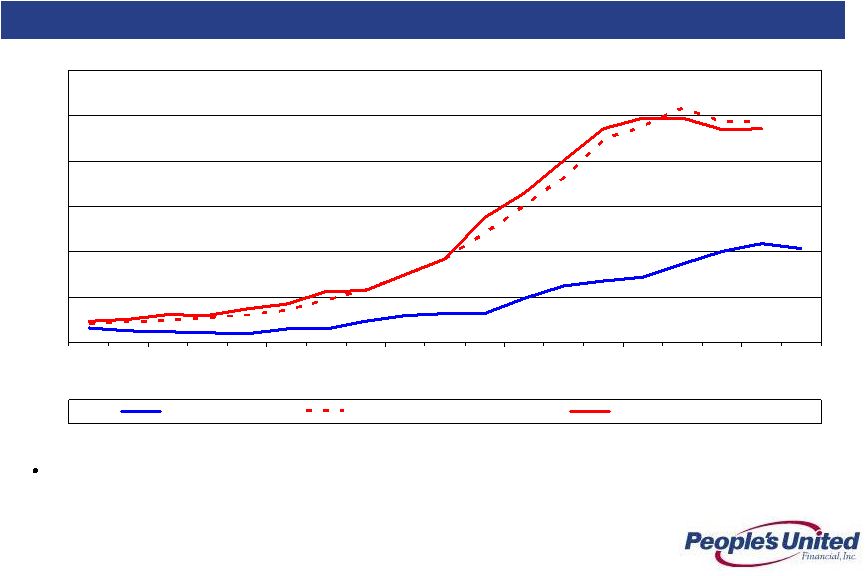 7
2006-2010
2.07
2.18
4.86
4.72
0.00
1.00
2.00
3.00
4.00
5.00
6.00
Q2
2006
Q3
2006
Q4
2006
Q1
2007
Q2
2007
Q3
2007
Q4
2007
Q1
2008
Q2
2008
Q3
2008
Q4
2008
Q1
2009
Q2
2009
Q3
2009
Q4
2009
Q1
2010
Q2
2010
Q3
2010
Q4
2010
PBCT
Peer Group Mean
Top 50 Banks by Assets
Fourth Quarter 2010 Results
NPAs
/ Loans & REO* (%)
Non-performing assets (excluding acquired non-performing loans) as a percentage of
originated loans plus all REO and
repossessed assets; acquired non-performing loans excluded as risk of loss has been considered by virtue of our estimate of
acquisition-date fair value and/or the existence of an FDIC loss
sharing agreement |
 8
Loan Growth
Organic
loan
growth
resumed
with
$221MM
of
growth
in
Q4
2010
Acquisitions
of
Smithtown
and
RiverBank
added
$2.1BN
of
loans
8
Total
Legacy
Commercial real estate
7,306
$
5,618
$
1,365
$
323
$
5,493
$
1,813
$
125
$
Commercial lending
3,096
3,020
40
36
2,922
174
98
PCLC
1,212
1,212
-
-
1,185
27
27
PUEF
888
888
-
-
964
(76)
(76)
Total Commercial 12,502
10,738
1,405
359
10,564
1,938
174
Residential mortgage
2,838
2,573
141
124
2,474
364
99
Home equity and other loans
2,178
2,125
26
27
2,177
1
(52)
Total loans
17,518
$
15,436
$
1,572
$
510
$
15,215
$
2,303
221
$ Inc/(Dec)
($'s in millions)
Q4 2010
Legacy
Smithtown
River
Q3 2010 |
 Integration
Update |
 10
Focused on Revenue Synergies Throughout the Franchise
By Pursuing Best Practices in All Markets
Northern New England
Retail
Banking
and
Brokerage
Enhance our industry leading loyalty by initiating a New Customer Experience
program – on-boarding and retention focused
Invest in securities and life insurance licensing, product and sales training in
retail bank Introduced People’s Securities brokerage model
Objective is to increase cross-selling to 4.6 products and services per
customer (the current level in Southern NE franchise) from 3.6 products and
services (the current level in Northern NE franchise)
Upper
Middle-Market
Commercial
Banking
Larger corporate lending capabilities >$25MM per loan
Insurance brokerage capability
Southern New England
Build out small business capabilities
Market business services: payroll processing, merchant services,
business credit card,
401k administration
Emphasize private banking and wealth management |
 11
Financial Federal Integration Update
Financial Federal unit, renamed People’s United Equipment Finance
While portfolio loan balances are down, we’re not losing market share as
construction market remains depressed
Yield and fee income continue to exceed expectations
Loss experience has also been better than expected
At announcement we had targeted 0% cost savings but through the elimination of
headcount and public company expenses we have reduced non-interest
expense by 13%
The
business
is
well
positioned
and
we
are
cautiously
optimistic
about
an
up-tick
in
construction activity during the second half of 2011 |
 12
Massachusetts Integration Update
Butler Bank (Lowell, MA)
Retained 93% of deposits since April 2010 closing
System conversion scheduled for the first week of February
RiverBank
(N. Andover, MA)
Cost
savings
of
30%
identified
at
announcement
-
on
track
to
realize
that
target
Integrated the commercial lending group and actively training branch
personnel System conversion scheduled for first week of February
De novo branches (Downtown Boston, MA)
Early feedback, deposit gathering and lending referral activity has been
excellent |
 13
Long Island Integration Update
Bank of Smithtown (Smithtown, NY)
Our
brand
of
banking,
with
its
focus
on
the
customer
experience,
is
being
received
well on Long Island by customers and employees
Initiated de novo C&I effort on Long Island in December
Building
out
Commercial
Real
Estate
Finance
(CREF)
infrastructure
–
primary
goal is
to manage existing portfolio
Expanding the workout function
System conversion scheduled for June-July time period
|
 People’s United
Financial Announces Acquisition of
Danvers Bancorp (DNBK) |
 15
Immediately adds desired scale to our existing Boston MSA presence
–
Pro
forma
PBCT
becomes
7
th
largest
bank
in
Massachusetts
and
Boston
MSA
–
Pro
forma
PBCT
becomes
2
nd
largest
bank
in
Essex
County,
MA
Excellent platform for commercial lending growth
–
Boston
is
the
second largest MSA within our footprint behind New York City MSA
–
49% of Danverbanks’
loans are C&l
loans
–
Adds
23
commercial
lenders
to
the
10
we
now
have
based
in
Boston
MSA
–
Asset-based lending unit can be expanded significantly
–
Complements our existing Massachusetts and New Hampshire footprint
Danvers Bancorp’s CEO, Kevin Bottomley, to join People’s United Board of
Directors and act as strategic leader of our Boston growth effort
Exceeds People’s United’s financial hurdles
–
> 15% IRR
–
Significant operating EPS accretion
Transaction Rationale
Transaction gives People’s United, New England’s largest independent bank,
scale in Boston, New England’s economic center
|
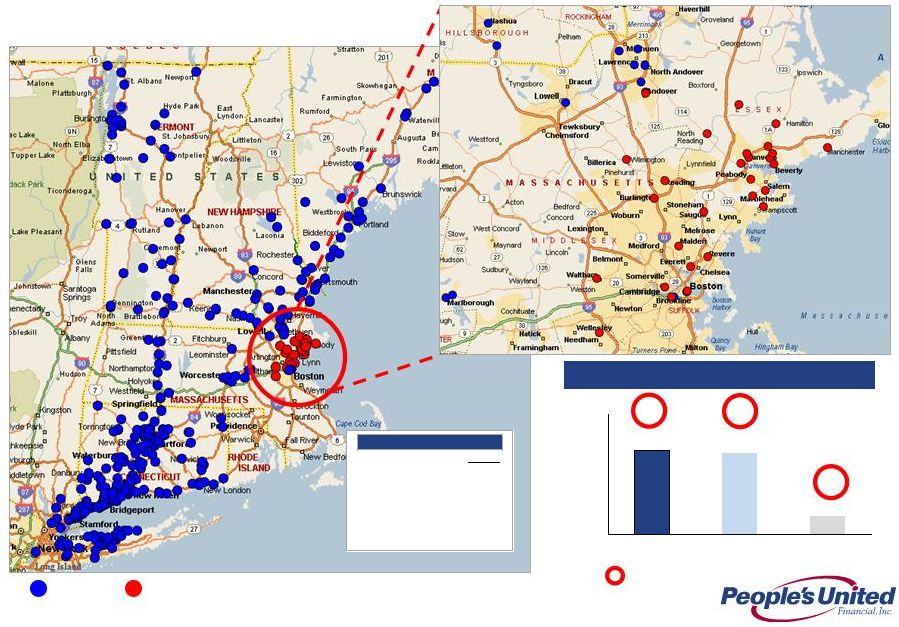 16
Solidifying Eastern Massachusetts Footprint
Source: SNL Financial
*Financials as of 9/30/2010
**Projected change from 2010-2015
Median 2010 HH Income
PBCT
DNBK
Financial Highlights*
($ in millions)
DNBK
Assets
$2,631
Gross Loans
1,745
Deposits
2,040
Branches
28
16.0
16.9
12.4
Projected HHI Growth**
$70,905
$70,175
$54,442
$50,000
$57,500
$65,000
$72,500
$80,000
PBCT
DNBK
Nation |
 17
Essex County, MA
Massachusetts*
Positions People’s United for further growth in Eastern Massachusetts
Adds Scale in Targeted Expansion Markets
Source: SNL Financial; Deposits data as of 6/30/2010
* Excludes Bank of New York Mellon
Deposits
Market
Branch
in Market
Share
Rank
Institution (ST)
Count
($M)
(%)
1
Bank of America Corp. (NC)
280
44,234
25.4
2
Royal Bank of Scotland Group
257
24,494
14.1
3
Banco Santander SA
230
13,623
7.8
4
Toronto-Dominion Bank
159
8,716
5.0
5
Eastern Bank Corporation (MA)
95
6,162
3.5
6
Independent Bank Corp. (MA)
71
3,702
2.1
Pro Forma
59
3,598
2.1
7
Middlesex Bancorp MHC (MA)
33
3,572
2.1
8
Boston Private Financial (MA)
9
2,375
1.4
9
Berkshire Hills Bancorp Inc. (MA)
37
2,014
1.2
10
Danvers Bancorp Inc. (MA)
28
2,000
1.1
11
Brookline Bancorp Inc. (MA)
26
1,927
1.1
12
Century Bancorp Inc. (MA)
23
1,857
1.1
13
Salem Five Bancorp (MA)
22
1,757
1.0
14
Cambridge Financial Group Inc (MA)
16
1,744
1.0
15
Cape Cod Five Cents Svgs Bk (MA)
15
1,688
1.0
16
People's United Financial Inc. (CT)
31
1,598
0.9
17
Webster Financial Corp. (CT)
24
1,387
0.8
18
First Republic Bank (CA)
2
1,364
0.8
19
Meridian Interstate Bncp (MHC) (MA)
20
1,361
0.8
20
Citigroup Inc. (NY)
31
1,342
0.8
Totals (1-20)
1,409
126,915
72.9
Totals (1-178)
2,214
174,070
100.0
Deposits
Market
Branch
in Market
Share
Rank
Institution (ST)
Count
($M)
(%)
1
Toronto-Dominion Bank
32
2,034
12.4
Pro Forma
24
2,032
12.3
2
Eastern Bank Corporation (MA)
24
1,674
10.2
3
Salem Five Bancorp (MA)
17
1,573
9.6
4
Banco Santander SA
29
1,573
9.6
5
Danvers Bancorp Inc. (MA)
17
1,539
9.3
6
Bank of America Corp. (NC)
20
1,197
7.3
7
Inst for Svgs in Newburyport (MA)
7
883
5.4
8
Royal Bank of Scotland Group
15
570
3.5
9
People's United Financial Inc. (CT)
7
493
3.0
10
Newburyport Five Cents SB (MA)
7
445
2.7
Totals (1-10)
175
11,981
72.7
Totals (1-41)
258
16,469
100.0
Boston MSA*
Deposits
Market
Branch
in Market
Share
Rank
Institution (ST)
Count
($M)
(%)
1
Bank of America Corp. (NC)
203
40,046
28.9
2
Royal Bank of Scotland Group
214
23,830
17.2
3
Banco Santander SA
165
10,594
7.6
4
Toronto-Dominion Bank
108
6,469
4.7
5
Eastern Bank Corporation (MA)
87
5,878
4.2
6
Middlesex Bancorp MHC (MA)
30
3,479
2.5
Pro Forma
58
3,368
2.4
7
Independent Bank Corp. (MA)
45
2,529
1.8
8
Boston Private Financial (MA)
9
2,375
1.7
9
Danvers Bancorp Inc. (MA)
28
2,000
1.4
10
Brookline Bancorp Inc. (MA)
26
1,927
1.4
15
People's United Financial Inc. (CT)
30
1,368
1.0
Totals (1-10)
915
99,127
71.5
Totals (1-134)
1,512
138,676
100.0 |
 18
Completed
October 2009
Loans
$263M
Deposits
$415M
Danvers Bancorp, Inc. Overview
ROAA
0.64
ROAE
5.7
Net Interest Margin
3.49
Efficiency Ratio
71.1
TCE / TA
10.01
NPA / (Loans + OREO)
1.10
LLR / Loans
0.95
LTM NCO / Avg. Loans
0.16
Select Balance Sheet Ratios (%)
Profitability (%)
Source: SNL Financial
Financial data as of 9/30/2010
Headquarters
Danvers, MA
Established
March 1850
Branches
28
Conversion Date
12/13/2007
Overview
Recent Acquisition: Beverly National Bank
Chairman, President & CEO
Kevin T. Bottomley
Executive VP & COO
James J. McCarthy
EVP & Chief Lending Officer
John O’Neill
Executive VP & CFO
L. Mark Panella
Executive Management
Assets
$2,631
Net Loans
1,728
Deposits
2,040
Tangible Common Equity
260
Balance Sheet ($MM) |
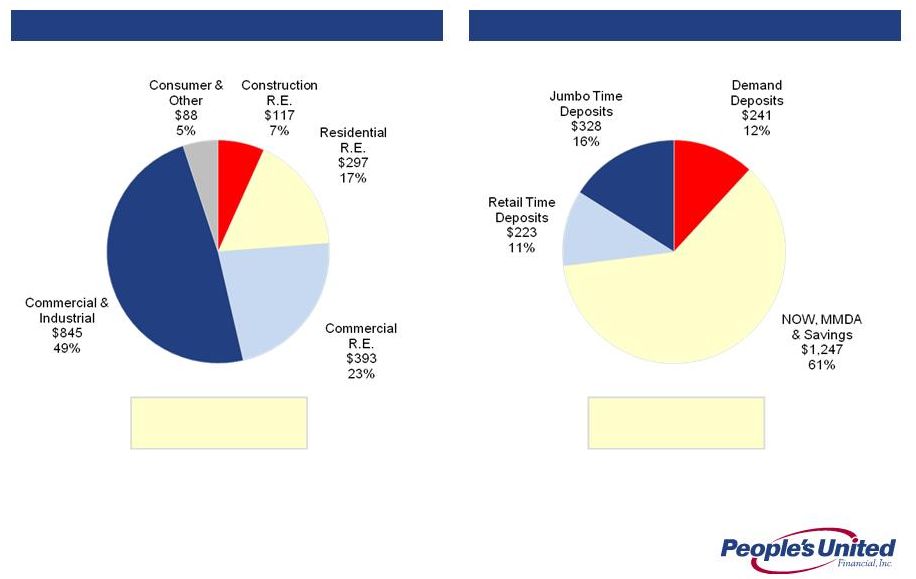 Diversified Loan Portfolio and Attractive Funding Mix
Source: Company Financials
Financial data as of 9/30/2010
*Excludes loans held for sale
($ in millions)
($ in millions)
19
5.66%
$1,741M
1.24%
$2,040M
Deposits
Loans
Yield on Loans:
Total Loans*:
Cost of Deposits:
Total Deposits: |
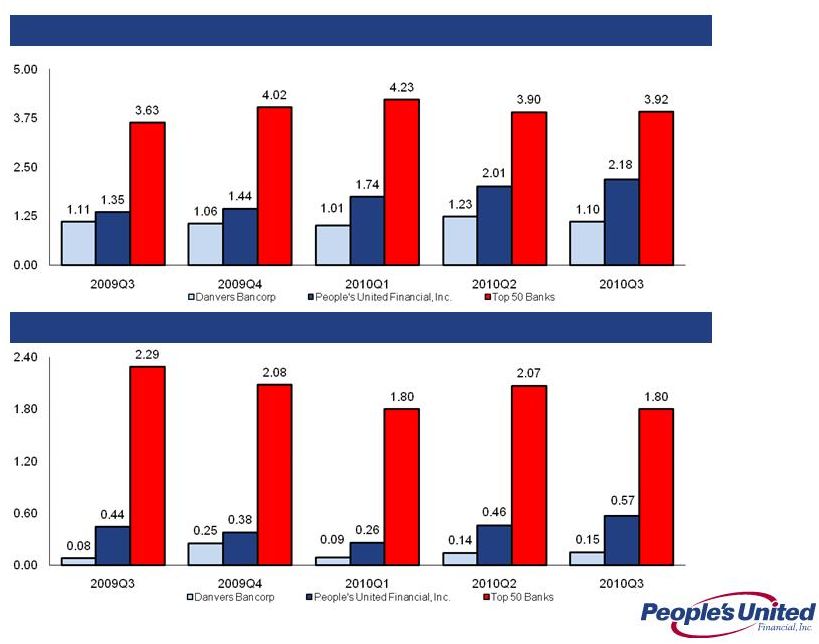 Exceptional Asset Quality
20
NPAs
/ Loans + OREO (%)
NCOs / Average Loans (%)
Source: SNL Financial
Note: PBCT Non-performing assets (excluding acquired non-performing loans) as a percentage of
originated loans plus all REO and repossessed assets; acquired non- performing loans excluded
as risk of loss has been considered by virtue of our estimate of acquisition-date fair value and/or the existence of an FDIC loss sharing
agreement |
 21
Price & Structure
•
$23.00
•
$493MM
•
55% stock / 45% cash
Summary of Key Terms
Price per share:
Deal value:
Consideration:
Pricing Multiples
•
38% or ~$20MM after tax (30% excluding ESOP, SERP and restricted
stock eliminations)
•
Identified but not assumed
•
$44MM after-tax
•
1.5%
Cost savings:
Revenue synergies:
Merger-related expenses:
Gross Loan mark:
Key Assumptions
Price / tangible book:
Core deposit premium:
•
1.86x
•
13.9%
Closing & Other
Extensive due diligence:
Approvals:
Expected close:
Board representation:
•
Completed
•
Danvers shareholders; Regulatory approvals
•
2
nd
quarter 2011
•
Kevin Bottomley
to join People’s United Board of Directors |
 22
Pro Forma Impact
* PBCT financials as of 12/31/2010; DNBK financials as of 9/30/2010
** Balance sheet figures do not include the impact of purchase accounting
adjustments ^ Pro forma levels at estimated close of transaction
PBCT*
DNBK*
Pro Forma**
Assets ($Bn)
25.0
2.6
27.6
Loans ($Bn)
17.5
1.7
19.2
Deposits ($Bn)
17.9
2.0
19.9
Branches
340
28
368
Tangible common equity ratio
14.1%
~12.0%
Tangible book value per share
$9.30
~$8.68
2012 operating EPS accretion
~$0.08
TBV dilution value earn back period
~7 years
Internal rate of return
>15%
^
^ |
 23
Summary
We are excited about growth and confident in our position
Competitive Strength
Focused on revenue synergies throughout our footprint
Further leveraging the brand
Conservative underwriting
Pro forma Tangible Common Equity Ratio of ~12.0%
Efficient capital deployment
Closed 4 deals (Financial Federal, Butler, RiverBank and Smithtown) – all
above our 15% IRR hurdle - in 2010
Announced the acquisition of Danvers Bancorp – above our 15%
IRR hurdle
Paid out $218MM in 2010 dividends
Repurchased $191MM of stock or 14.3MM shares at a weighted average
price of $13.35
Extended period of low interest rates, multi-year de-leveraging process and
tougher regulatory environment are encouraging consolidation
Significantly more asset sensitive than peers
|
 Q & A
|
 Appendix
|
 26
Quarterly Income Statement
26
$ Fav(unfav)
%
Net Interest Income
189.8
$
175.8
$
147.5
$
14.0
$
8%
Provision for Loan Losses
10.9
21.8
13.6
10.9
50
Non-Interest Income
75.9
75.9
71.7
-
-
Non-interest Expense: Operating
199.9
188.9
167.7
(11.0)
(6)
Non-Operating Expense
7.0
5.3
4.5
(1.7)
(31)
Total Non-Interest Expense
206.9
194.2
172.2
(12.7)
(7)
Income Before Taxes
47.9
35.7
33.4
12.2
Net Income
32.0
24.1
24.9
7.9
33
Net Operating Income
36.7
27.7
28.0
9.0
33
Earnings Per Share
0.09
0.07
0.07
0.02
29
Operating Earnings Per Share
0.10
0.08
0.08
0.02
29
vs. Q3 2010
($'s in millions, except EPS)
Q4 2010
Q3 2010
Q4 2009
34 |
 27
Non-Interest Income
27
$ Fav(unfav)
%
Investment management fees
7.9
$
7.6
$
7.9
$
0.3
$
4%
Insurance revenue
6.9
8.3
7.0
(1.4)
(17)
Brokerage commissions
2.9
2.8
2.9
0.1
4
Total wealth management
17.7
18.7
17.8
(1.0)
(5)
Bank service charges
30.7
31.5
32.2
(0.8)
(3)
Merchant services income
6.4
6.9
6.3
(0.5)
(7)
Gain on Residential Loan Sales
4.2
2.4
3.0
1.8
76
Net security loss
(1.0)
-
(0.1)
(1.0)
N/M
Operating lease income
5.8
5.4
3.9
0.4
7
Loan Penalties/Late Charges
5.7
4.2
2.1
1.5
36
Other non-interest income
6.4
6.8
6.5
(0.4)
(6)
Total non-interest income
75.9
75.9
71.7
-
-
Total ex net security loss
76.9
75.9
71.8
1.0
1
($'s in millions)
Q4 2010
Q3 2010
Q4 2009
vs. Q3 2010 |
 28
Non-Interest Expense
28
vs. Q3 2010
$ Increase
%
Compensation and benefits
98.3
$
93.2
$
89.2
$
5.1
$
5%
Occupancy and equipment
28.1
28.0
28.0
0.1
0
Professional/outside service fees
19.8
18.5
10.0
1.3
7
Other non-interest expense
60.7
54.5
45.0
6.2
11
Total non-interest expense
206.9
194.2
172.2
12.7
7
Non-operating Expense
7.0
5.3
4.5
1.7
31
Operating non-interest expense
199.9
188.9
167.7
11.0
6
Q4 2010
Q3 2010
Q4 2009
($'s in millions) |
  29
Average Earning Assets
29
$ Inc/(Dec)
%
Commercial real estate
6,054
$
5,465
$
5,352
$
589
$
11
Commercial lending
5,087
5,096
4,011
(9)
(0)
Total Commercial 11,141
10,561
9,363
580
5
Residential mortgage
2,611
2,463
2,609
148
6
Home equity and other loans
2,170
2,184
2,259
(14)
(1)
Total loans
15,922
15,208
14,231
714
5
Investments
3,875
3,748
4,351
127
3
Total earning assets
19,797
18,956
18,582
841
4
vs. Q3 2010
($'s in millions)
Q4 2010
Q3 2010
Q4 2009 |
  30
Average Funding Mix
30
$ Inc/(Dec)
%
Deposits:
Non-interest-bearing
3,634
$
3,432
$
3,321
$
202
$
6%
Savings/Now/PMA
8,249
7,930
7,145
319
4
Time
4,648
4,439
4,807
209
5
Total deposits
16,531
15,801
15,273
730
5
Sub-debt / Other borrowings
705
374
343
331
89
Total funding liabilities
17,236
16,175
15,616
1,061
7
Stockholders' equity
5,335
5,404
5,106
(69)
(1)
Total Funding
22,571
21,579
20,722
992
5
($'s in millions)
Q4 2010
vs. Q3 2010
Q3 2010
Q4 2009 |
 31
Non-Performing Assets
31
NPA's - Total
663
$
371
$
206
$
- Originated
303
312
206
- Acquired
360
59
N/A
Allowance for Loan Losses
173
173
173
NPA's / Total Loans, REO &
Repossessed assets - Originated
2.07%
2.18%
1.44%
Originated NPL's / Originated Loans
1.68%
1.77%
1.19%
Allowance / Originated Loans
1.18%
1.21%
1.21%
Allowance / Originated NPL's
70%
69%
102%
Net Loan Charge-Offs / Avg Loans
0.28%
0.57%
0.38%
($ in millions)
Q4 2010
Q3 2010
Q4 2009 |
 32
Home Equity Portfolio
Credit Statistics
Weighted Average:
Loan to value¹
55%
FICO scores¹
759
Net charge-offs:
0.23%
Non-accrual:
0.48%
High Quality Consumer Portfolio
Ending Balance: $5.0 billion
% of Loans: 29%
Residential Mortgage Portfolio
Credit Statistics
Weighted Average:
Loan to value¹
60%
FICO scores¹
726
Net charge-offs:
0.30%
Non-accrual:
3.17%
1-4 Family
Residential
57%
Home Equity
Loans & Lines
39%
Indirect
Auto
3%
Other
1%
As
of
December
31,
2010
(1) Excludes the impact of the former Butler Bank, former RiverBank and former Bank of
Smithtown |
 33
Retail
25%
Office
30%
Industrial
10%
Residential
13%
Hospitality
8%
Other
11%
Land
3%
Well Balanced Commercial Portfolio
As of December 31, 2010
Ending Balance: $12.5 billion
% of Loans: 71%
$5.4 billion CRE¹
(1) Excludes portfolios acquired on November 30, 2010
CRE, By Sector
Commercial
Real Estate
58%
General C&I
25%
Equip. Fin.
17% |
 34
We
expect
that
interest
rates
will
not
rise
in
2011.
However,
we
do
expect
rates
to
rise
in
2012 and beyond
Given short term interest rates are so low and are expected to remain low this year, we
have again added to our securities portfolio
For Q3 2010 we were 3.0x as asset sensitive as our peers
For every 100bps increase in the Fed Funds rate, our net interest income will
increase by ~$40MM on an annualized basis
Notes:
1.
Analysis is as of 6/30/10 filings
2.
Data as of 6/30/10 SEC filings, where exact +100bps shock up scenario data was not
provided PBCT interpolated based on data disclosed 3.
Data as of 6/30/10 filings, where exact +200bps shock up scenario data was
not provided PBCT interpolated based on data disclosed Asset
Sensitivity Net Interest Income at Risk
1
Analysis involves PBCT estimates, see notes below
Lowest Amongst
Highest Amongst
Core
PBCT Multiple to
Scenario
Our Peers
Our Peers
Peer Median
PBCT
Peer Median
Shock Up 100bps
2
-0.6%
4.8%
2.0%
6.0%
3.0x
Shock Up 200bps
3
0.4%
9.6%
4.4%
13.3%
3.0x
Change in Net Interest Income |
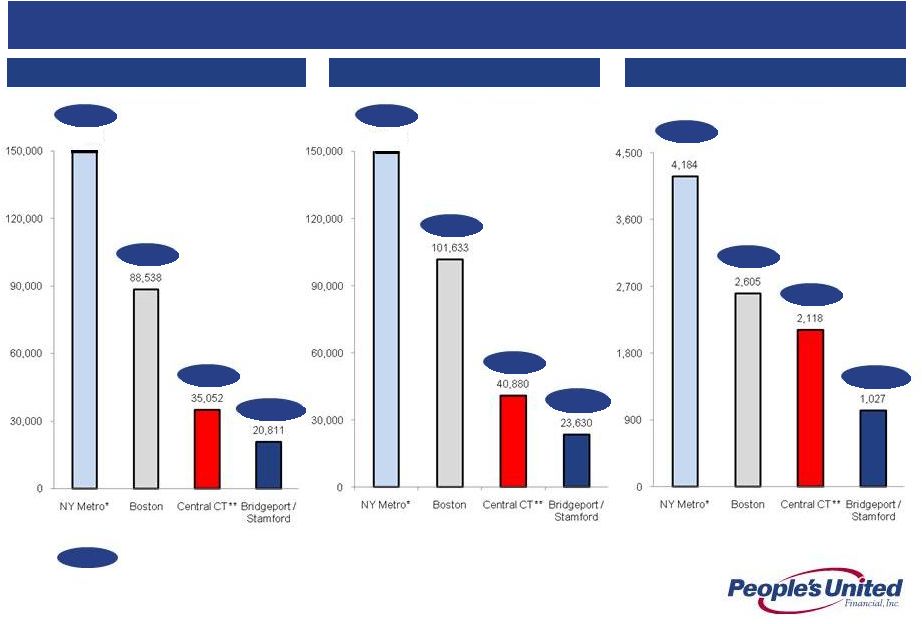 < 20 Employees
Commercial Market Opportunity by MSA
> 500 Employees
< 500 Employees
Pro Forma Deposit Market Share
Number of firms by size
People’s United is growing in NYC Metro and Boston Metro,
areas rich with potential commercial, non-commodity relationships
0.2%
2.4%
6.3%
17.8%
0.2%
2.4%
6.3%
17.8%
0.2%
2.4%
6.3%
17.8%
428,577
471,661
Source: SBA firms and employment by MSA 2007
* NY Metro area includes New York, Northern New Jersey, and Long Island MSA
** Central Connecticut includes New Haven and Hartford MSAs
35 |
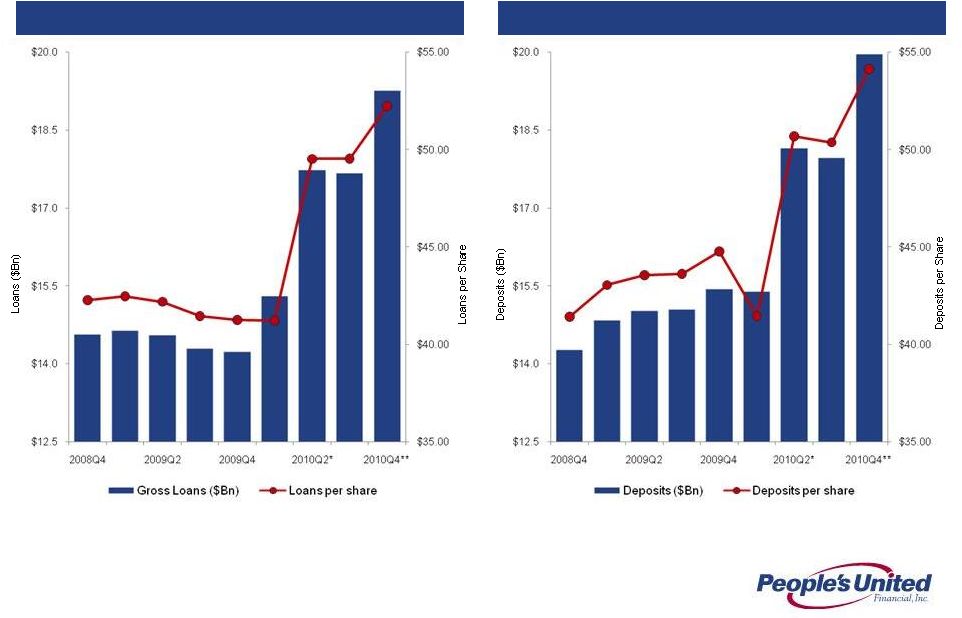 36
Loans and Deposits
Source: SNL Financial
* Pro forma for SMTB & LSBX acquisitions
** Pro forma for DNBK acquisition
Loans
Deposits |
 37
Peer Group
Company Name
Ticker
State
1
Associated Banc-Corp
ASBC
WI
2
Astoria Financial Corporation
AF
NY
3
BOK Financial Corporation
BOKF
OK
4
City National Corporation
CYN
CA
5
Comerica Incorporated
CMA
TX
6
Commerce Bancshares, Inc.
CBSH
MO
7
Cullen/Frost Bankers, Inc.
CFR
TX
8
First Horizon National Corporation
FHN
TN
9
Flagstar Bancorp, Inc.
FBC
MI
10
Fulton Financial Corporation
FULT
PA
11
Hudson City Bancorp, Inc.
HCBK
NJ
12
M&T Bank Corporation
MTB
NY
13
Marshall & Ilsley Corporation
MI
WI
14
New York Community Bancorp, Inc.
NYB
NY
15
Synovus Financial Corp.
SNV
GA
16
TCF Financial Corporation
TCB
MN
17
Valley National Bancorp
VLY
NJ
18
Webster Financial Corporation
WBS
CT
19
Zions Bancorporation
ZION
UT |
 38
Additional Information
Participants in the Transaction
People’s United, Danvers Bancorp and their respective directors, executive officers and certain
other members of management and employees may be soliciting proxies from Danvers Bancorp
stockholders in favor
of
the
merger
with
Danvers
Bancorp.
Information
regarding
the
persons
who
may,
under
the
rules
of
the SEC, be considered participants in the solicitation of the Danvers Bancorp stockholders in
connection with the proposed merger will be set forth in the proxy statement/prospectus when it
is filed with the SEC. You can find information about the executive officers and directors of
People’s United in its Annual Report on Form 10-K for the year ended December 31, 2009
and in its definitive proxy statement filed with the SEC on March 23, 2010. You can find
information about Danvers Bancorp’s executive officers and directors in its Annual Report
on Form 10-K for the year ended December 31, 2009 and in its definitive proxy statement
filed with the SEC on April 16, 2010. You can obtain free copies of these documents from
People’s United or Danvers Bancorp using the contact information above.
In connection with the proposed merger with Danvers Bancorp, Inc. (“Danvers Bancorp”),
People’s United will file with the Securities and Exchange Commission (the “SEC”)
a Registration Statement on Form S-4 that will include a proxy statement of Danvers Bancorp
that also constitutes a prospectus of People’s United. Danvers Bancorp will mail the
proxy statement/prospectus to its stockholders. Investors and security holders are urged to
read the proxy statement/prospectus regarding the proposed merger when it becomes available
because it will contain important information. You may obtain a free copy of the proxy
statement/prospectus (when available) and other related documents filed by People’s United
and Danvers Bancorp with the SEC at the SEC’s website at www.sec.gov. The proxy
statement/prospectus (when it is available) and the other documents may also be obtained for free
by accessing People’s United website at www.peoples.com under the tab “Investor
Relations” and then under the heading “Financial Information” or by accessing
Danvers Bancorp’s website at www.danversbank.com under the tab “Investor
Relations” and then under the heading “SEC Filings”. |
 For more information,
investors may contact: Peter Goulding, CFA
peter.goulding@peoples.com
(203) 338-6799 |