Attached files
| file | filename |
|---|---|
| 8-K - CHINA FUND INC | v207455_8-k.htm |

|
THE CHINA FUND, INC.
(CHN)
|
 The Martin Currie
Shanghai team |
IN BRIEF
|
||||||||
|
Net asset value per
share
|
US$35.31
|
At 31 December
2010
|
US$ return
|
||||||
|
Market
price
|
US$32.50
|
China Fund
NAV
|
MSCI
Golden Dragon*
|
||||||
|
Premium/(discount)
|
(7.96
|
%)
|
%
|
%
|
|||||
|
Fund size
|
US$804.4m
|
One month
|
7.2
|
|
3.4
|
|
|||
|
Source:
State Street Bank and Trust Company.
|
Year to
date
|
27.3
|
13.6
|
||||||
|
One year
|
27.3
|
13.6
|
|||||||
|
Three years
%pa
|
5.3
|
(1.3
|
)
|
||||||
|
Past
performance is not a guide to future returns.
Source:
State Street Bank and Trust Company. NAV
performance.
*Source
for index data: MSCI.
|
|||||||||
| MANAGER’S COMMENTARY | |
|
The Fund had a good 2010,
finishing the year up 27.3% against a benchmark return of 13.6%. We were
not helped by our speciality in A-shares; the Shanghai Composite index
fell 14.3% in 2010, dragged down by government controls on the property
market and the huge issuance of new equity. Some 349 new companies listed
in the A-share markets in 2010, raising US$67 billion in capital, which
compares with US$42 billion over the same period in the United States. Our outperformance was driven by
our long-running bias towards domestic consumer and healthcare stocks. One
example, China Medical Systems, in which we first invested in June 2007 as
an AIM-listed ‘orphan stock’, enjoyed a particularly strong finish to the
year and is now our largest holding. We were also helped by our
investments in Taiwan, which was the best-performing
Chinese market in 2010 (TWSE +9%).
We think there is more to come
from Taiwan, which has just entered its Year
100 (the founding of the Republic of China is conventionally dated to an
army mutiny in Wuchang on 10 October 1910). The first day of 2011 also saw
the cross-straits free-trade agreement come into effect. Anyone doubting
the revival of Taiwanese consumption should have accompanied me to the
Leofoo Village theme park in central
Taiwan at the holiday weekend, along
with 30,000 other people (never again!). The consumer stocks, however,
represent one of our main challenges in 2011: although we remain bullish
on the prospects for the growth of Chinese consumption, many stocks we
would like to own are now too expensive. The Chinese market’s
inefficiencies still yield some interesting, cheap stocks, but to locate
them we find ourselves being pushed towards seriously out-of-favour
sectors (property, solar, utilities) and the obscure.
The main macroeconomic threat in
2011 is still inflation; attention so far has focused on food inflation,
which was +11.7% in November, compared with non-food inflation of +1.9%.
This was caused largely by bad weather and should ease with the spring.
The danger is that non-food inflation, as represented in fast-rising wages
and resurgent material prices, may prove more intractable. Beijing city raised its minimum wage by
20.8% and Moutai raised its vodka price by 20% (these two events are not
necessarily related). National monetary policy was officially changed from
‘appropriately loose’ to ‘moderate’, which in real terms meant a
25-basis-point rise in interest rates on Christmas Day, a 50-basis-point
increase in the reserve-requirement ratio (now 19% for big banks) and the
removal of some stimulus measures, such as the tax break on small cars.
This being the case, the ‘renminbi appreciation/hot money’ story will
probably remain in play for a while. The politicians may have been
emboldened by the strong export figures (+34.9% year on year in November)
to allow a slight quickening in the glacial pace of the yuan’s
appreciation against the US
dollar.
|
INVESTMENT STRATEGY
The Fund is 97.4% invested with holdings
in 60 companies.
The company declared a US$51.5 million
dividend payout, which was made at the month-end and equated to US$2.27 per
share. We raised cash by taking profits on a number of strong performers
(China
Shineway Pharmaceutical,
Wumart, Intime Department
Store, Hollysys Automation
Technologies). We cut our
A-share weighting by selling Shanghai Airport
and Zhejiang
Commodities, shifting some
additional cash into Taiwan by buying Chinatrust
Bank. (Our A-share
weighting is now 13.2%, compared with our Taiwan weighting of 21.6%). We also subscribed
to the Hong Kong IPO of construction-machinery manufacturer Zoomlion (we are
familiar with the company through our work in the A-share market) and bought the
unloved China
Mobile, which will benefit
from the increasing use of smartphones.
The annual general meeting of the fund
will be held at 10.30am on Thursday, March 3, 2011 at the offices of Clifford
Chance LLP, 31 West 52nd
Street, New York. We welcome investors to come
along.
Chris Ruffle, Martin Currie
Inc*
*Martin
Currie Ltd and Heartland Capital Management Ltd (HCML) have established MC China
Ltd (MCCL), as a joint venture company, to provide investment management or
investment advisory services to the range of China investment
products managed by Martin Currie.
MCCL
has appointed Martin Currie Investment Management Ltd (MCIM), or its affiliates,
as investment manager of Martin Currie’s China investment
products. HCML has seconded both Chris Ruffle and Shifeng Ke to MCIM, or its
affiliates, on a full time basis with the same roles and responsibilities as if
they were full time employees.
31 DECEMBER 2010
|
FUND
DETAILS
|
|
Market cap
|
US$740.4m
|
|
Shares
outstanding
|
22,781,762
|
|
Exchange
listed
|
NYSE
|
|
Listing
date
|
July 10,
1992
|
|
Listed and direct investment
manager
|
Martin Currie
Inc
|
|
Source: State Street Bank and
Trust Company.
|
ASSET ALLOCATION
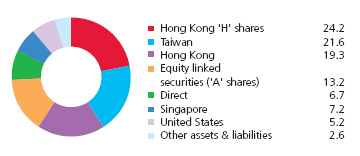
Source: State Street Bank
and Trust Company
|
INDUSTRY
ALLOCATION
|
|||||
|
The
China Fund,
|
MSCI
Golden
|
||||
|
Inc
%
|
Dragon
%
|
||||
|
Healthcare
|
20.8 | 0.4 | |||
|
Consumer
discretionary
|
19.6 | 6.2 | |||
|
Consumer
staples
|
19.0 | 3.0 | |||
|
Financials
|
16.3 | 36.4 | |||
|
Industrials
|
6.2 | 7.6 | |||
|
Information
technology
|
5.0 | 20.4 | |||
|
Materials
|
3.6 | 7.1 | |||
|
Utilities
|
2.9 | 3.4 | |||
|
Telecommunications
|
2.6 | 6.7 | |||
|
Energy
|
1.4 | 8.8 | |||
|
Other assets &
liabilities
|
2.6 | — | |||
|
*Source:
State Street Bank and Trust Company. Source for index data:
MSCI
|
|||||
|
PERFORMANCE
|
(US$ RETURNS) | |||||||
|
NAV
|
Market
price
|
|||||||
|
%
|
%
|
|||||||
|
One month
|
7.2 | 5.9 | ||||||
|
Year to
date
|
27.3 | 23.6 | ||||||
|
Three years
%pa
|
5.3 | 8.1 | ||||||
|
Past
performance is not a guide to future
returns.
|
||||||||
|
Three
year returns are annualized.
|
||||||||
|
Source:
State Street Bank and Trust Company
|
||||||||
|
15
LARGEST HOLDINGS (50.3%)
|
|||||
|
Fund
%
|
|||||
|
China Medical System
Holdings
|
Healthcare
|
8.7 | |||
|
Huiyin Household
Appliances
|
Consumer
discretionary
|
5.4 | |||
|
Far Eastern Department
Stores
|
Consumer
discretionary
|
4.1 | |||
|
Ping An
Insurance
|
Financials
|
4.0 | |||
|
Wumart
Stores
|
Consumer
staples
|
3.4 | |||
|
Hsu Fu Chi
International
|
Consumer
staples
|
3.3 | |||
|
Shandong Weigao
Group
|
Healthcare
|
3.2 | |||
|
China Fishery
Group
|
Consumer
staples
|
2.9 | |||
|
Ruentex
Development
|
Financials
|
2.8 | |||
|
Sinopharm Medicine
Holding
|
Healthcare
|
2.6 | |||
|
Boshiwa
International
|
Consumer
discretionary
|
2.4 | |||
|
ENN Energy
|
Utilities
|
1.9 | |||
|
FamilyMart
|
Consumer
discretionary
|
1.9 | |||
|
Zong Su
Foods
|
Consumer
staples
|
1.9 | |||
|
China
Bright
|
Healthcare
|
1.8 | |||
|
DIRECT
INVESTMENTS (6.7%) †
|
|||||
|
Fund
%
|
|||||
|
Zong Su
Foods
|
Consumer
staples
|
1.9 | |||
|
China
Bright
|
Healthcare
|
1.9 | |||
|
Hand Enterprise Solutions
(prefered)
|
Information
technology
|
1.8 | |||
|
Qingdao Bright
Moon
|
Industrials
|
1.1 | |||
|
Ugent
Holdings
|
Industrials
|
0.0 | |||
|
China
Silicon
|
Information
technology
|
0.0 | |||
|
Hand Enterprise Solutions (common
stock)
|
Information
technology
|
0.0 | |||
Source:
State Street Bank and Trust Company.
† The Board
has suspended further direct investments until improvements are made in the
policies and procedures pursuant to which direct investments
are made.
|
FUND PERFORMANCE (BASED ON NET
ASSET VALUE)
|
(US$
RETURNS)
|
||||||||||
|
One
month
|
Three
months
|
Calendar year
to
date
|
One
year
|
Three
years
|
Five
years
|
Since
launch
|
|||||
|
%
|
%
|
%
|
%
|
%pa
|
%pa
|
%pa
|
|||||
|
The China Fund,
Inc.
|
7.2
|
7.9
|
27.3
|
27.3
|
5.3
|
27.8
|
13.0
|
||||
|
MSCI Golden
Dragon
|
3.4
|
6.3
|
13.6
|
13.6
|
(1.3
|
)
|
13.1
|
11.0
|
|||
|
Hang Seng Chinese Enterprise
|
(1.1
|
)
|
2.2
|
(1.0
|
)
|
(1.0
|
)
|
(7.6
|
)
|
18.9
|
19.7
|
|
Shanghai Stock Exchange
180
|
0.9
|
7.6
|
(13.0
|
)
|
(13.0
|
)
|
(15.6
|
)
|
29.8
|
n/a
|
|
Past
performance is not a guide to future returns. Actual returns to a shareholder of
The Fund will be based on market price and reflect transactions and
expenses.
Source:
State Street Bank and Trust Company. Launch date 10 July 1992. Three, five year
and since launch returns are all annualized.
Source
for index data: MSCI for the MSCI Golden Dragon and Copyright 2010 Bloomberg LP
for the Hang Seng China Enterprise and the Shanghai Stock Exchange 180. For a
full description of each index please see the index descriptions
section.
PERFORMANCE IN PERSPECTIVE

Past
performance is not a guide to future returns.
Source:
Martin Currie Inc as at 30 November 2010.
THE CHINA FUND INC.
PREMIUM/DISCOUNT
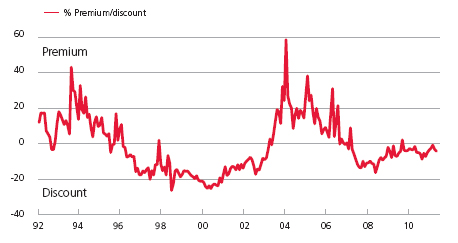
Past
performance is not a guide to future returns.
Source:
Martin Currie Inc as at 30 November 2010.
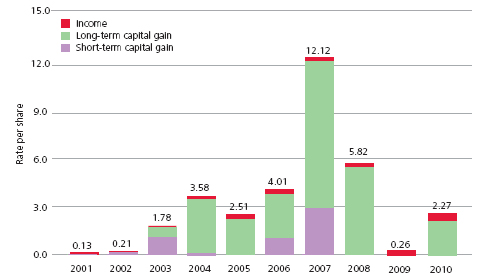
10 YEAR DIVIDEND HISTORY
CHART
|
Total
|
0.13 | 0.21 | 1.78 | 3.58 | 2.51 | 4.01 | 12.12 | 5.82 | 0.26 | 2.27 | ||||||||||||||||||||||||||||||
|
Income
|
0.13 | 0.06 | 0.07 | 0.20 | 0.22 | 0.30 | 0.28 | 0.48 | 0.26 | 0.37 | ||||||||||||||||||||||||||||||
|
Long-term
capital
|
0.00 | 0.00 | 0.67 | 3.27 | 2.29 | 2.73 | 9.00 | 5.34 | 0.00 | 1.90 | ||||||||||||||||||||||||||||||
|
Short-term
capital
|
0.00 | 0.15 | 1.04 | 0.11 | 0.00 | 0.98 | 2.84 | 0.00 | 0.00 | 0.00 |
Past
performance is not a guide to future returns.
Source:
State Street Bank and Trust Company.
|
31 DECEMBER
2010
|
||||||||
|
Asset
Allocation
|
Company (BBG
ticker)
|
Price
|
Holding
|
Value US$
|
% of
portfolio
|
|||
|
Hong Kong H
|
24.2
|
|||||||
|
China Medical System
Holdings
|
867
|
HK
|
HK$7.5
|
72,353,760
|
|
$69,624,176
|
8.7
|
|
|
Wumart
Stores
|
8277
|
HK
|
HK$19.2
|
11,120,000
|
|
$27,466,503
|
3.4
|
|
|
Shandong Weigao Group Medical
Polymer
|
8199
|
HK
|
HK$22.1
|
9,176,000
|
|
$25,970,090
|
3.2
|
|
|
Sinopharm Medicine
Holding
|
297
|
HK
|
HK$27.1
|
6,056,800
|
|
$21,115,914
|
2.6
|
|
|
Boshiwa International
Holding
|
1698
|
HK
|
HK$6.0
|
24,932,000
|
|
$19,308,608
|
2.4
|
|
|
Asian Citrus
Holdings
|
73
|
HK
|
HK$9.6
|
6,677,000
|
|
$8,289,075
|
1.1
|
|
|
Fook Woo
|
923
|
HK
|
HK$3.1
|
19,836,000
|
|
$7,859,632
|
1.0
|
|
|
Zijin Mining
Group
|
2899
|
HK
|
HK$7.2
|
8,340,000
|
|
$7,606,934
|
0.9
|
|
|
ZTE Corp.
|
763
|
HK
|
HK$30.9
|
1,875,689
|
|
$7,468,250
|
0.9
|
|
|
Taiwan
|
21.6
|
|||||||
|
Far Eastern Department
Stores
|
2903
|
TT
|
NT$48.8
|
19,543,604
|
|
$32,677,128
|
4.1
|
|
|
Ruentex Development
Co
|
9945
|
TT
|
NT$51.3
|
12,694,000
|
|
$22,334,718
|
2.8
|
|
|
FamilyMart
|
5903
|
TT
|
NT$98.2
|
4,501,652
|
|
$15,161,704
|
1.9
|
|
|
Uni-President Enterprises
Corp.
|
1216
|
TT
|
NT$43.3
|
10,023,901
|
|
$14,869,196
|
1.8
|
|
|
WPG Holdings
Co
|
3702
|
TT
|
NT$56.3
|
7,457,103
|
|
$14,399,359
|
1.8
|
|
|
China Metal
Products
|
1532
|
TT
|
NT$33.4
|
11,500,347
|
|
$13,174,132
|
1.6
|
|
|
Chinatrust
Financial
|
2891
|
TT
|
NT$21.4
|
17,527,288
|
|
$12,864,506
|
1.6
|
|
|
KGI
Securities
|
6008
|
TT
|
NT$16.7
|
16,984,780
|
|
$9,699,264
|
1.2
|
|
|
Synnex
Technology
|
2347
|
TT
|
NT$78.7
|
3,088,006
|
|
$8,335,228
|
1.0
|
|
|
Taiwan Life 4percent Conv
Bond*
|
n/a
|
NT$120.2
|
2,000,000
|
|
$8,242,073
|
1.0
|
||
|
Yuanta Financial
Holdings
|
2885
|
TT
|
NT$21.8
|
10,520,593
|
|
$7,866,134
|
1.0
|
|
|
Fubon Financial
Holdings
|
2881
|
TT
|
NT$40.0
|
5,195,134
|
|
$7,127,239
|
0.9
|
|
|
Lien Hwa
Industrial
|
1229
|
TT
|
NT$23.5
|
8,724,881
|
|
$7,017,250
|
0.9
|
|
|
Hong Kong
|
19.3
|
|||||||
|
Huiyin Household
Appliances
|
1280
|
HK
|
HK$2.1
|
160,413,750
|
|
$43,749,674
|
5.4
|
|
|
ENN Energy
|
2688
|
HK
|
HK$23.3
|
5,084,000
|
|
$15,206,381
|
1.9
|
|
|
China Mobile
|
941
|
HK
|
HK$77.2
|
1,365,500
|
|
$13,570,241
|
1.7
|
|
|
Natural Beauty
Bio-Technology
|
157
|
HK
|
HK$2.1
|
47,710,000
|
|
$12,766,449
|
1.6
|
|
|
Ports
Design
|
589
|
HK
|
HK$21.5
|
4,549,500
|
|
$12,554,179
|
1.6
|
|
|
Chaoda Modern Agriculture
(Holdings)
|
682
|
HK
|
HK$5.8
|
13,999,357
|
|
$10,553,659
|
1.3
|
|
|
Changsa Zoomlion Heavy
Industries
|
1157
|
HK
|
HK$17.6
|
4,090,821
|
|
$9,241,285
|
1.1
|
|
|
Shangri-La Asia
|
69
|
HK
|
HK$21.1
|
3,061,555
|
|
$8,310,399
|
1.0
|
|
|
China Water
Affairs
|
855
|
HK
|
HK$3.1
|
19,976,000
|
|
$7,940,802
|
1.0
|
|
|
Intime Department Store
Group
|
1833
|
HK
|
HK$11.4
|
5,278,629
|
|
$7,795,795
|
1.0
|
|
|
Golden Meditech
Co
|
801
|
HK
|
HK$1.5
|
35,040,000
|
|
$6,536,262
|
0.8
|
|
|
China Shineway Pharmaceutical
Group
|
2877
|
HK
|
HK$22.3
|
2,222,000
|
|
$6,374,502
|
0.8
|
|
|
Yorkey Optical International
Cayman
|
2788
|
HK
|
HK$1.4
|
5,036,926
|
|
$907,175
|
0.1
|
|
|
FUJI Food & Catering
Services
|
1175
|
HK
|
HK$0.0
|
5,462,000
|
|
$0
|
0.0
|
|
|
Equity Linked Securities ('A'
Shares)
|
13.2
|
|||||||
|
Ping An
Insurance
|
n/a
|
US$8.5
|
3,775,759
|
|
$32,178,495
|
4.0
|
||
|
Zhejiang China Commodities City
Group
|
n/a
|
US$5.3
|
2,771,970
|
|
$14,666,493
|
1.8
|
||
|
Shanghai
Qiangsheng
|
n/a
|
US$1.1
|
10,482,652
|
|
$11,453,492
|
1.4
|
||
|
Shanghai Yuyuan
Tourist
|
n/a
|
US$2.0
|
4,293,036
|
|
$8,762,361
|
1.1
|
||
|
Suning
Appliance
|
n/a
|
US$2.0
|
4,311,019
|
|
$8,527,196
|
1.1
|
||
|
Tangshan Jidong
Cement
|
n/a
|
US$3.6
|
2,354,087
|
|
$8,423,840
|
1.0
|
||
|
Wuliangye
Yibin
|
n/a
|
US$5.3
|
1,403,507
|
|
$7,338,938
|
0.9
|
||
|
Zhejiang
Guyuelongshan
|
n/a
|
US$2.1
|
3,022,849
|
|
$6,261,572
|
0.8
|
||
|
Citic
Securities
|
n/a
|
US$1.9
|
2,475,000
|
|
$4,728,628
|
0.6
|
||
|
China Railway Construction
Group
|
n/a
|
US$1.0
|
3,932,600
|
|
$4,026,982
|
0.5
|
||
|
Direct
|
6.7
|
|||||||
|
Zong Su
Foods
|
n/a
|
US$5,603.0
|
2,677
|
|
$15,000,034
|
1.9
|
||
|
China Bright
|
n/a
|
HK$7.9
|
14,665,617
|
|
$14,980,221
|
1.9
|
||
|
Hand Enterprise Solutions
(preferred)
|
n/a
|
US$1.8
|
8,027,241
|
|
$14,192,162
|
1.8
|
||
|
Qingdao Bright
Moon
|
n/a
|
US$0.3
|
31,827,172
|
|
$9,293,534
|
1.1
|
||
|
Ugent
Holdings
|
n/a
|
HK$0.0
|
177,000,000
|
|
$0
|
0.0
|
||
|
China Silicon
Corp.
|
n/a
|
US$0.0
|
3,014,731
|
|
$0
|
0.0
|
||
|
Hand Enterprise Solutions (common
stock)
|
n/a
|
US$0.0
|
500,000
|
|
$0
|
0.0
|
||
*This is an unlisted convertible bond.
Shares in Taiwan Life are listed on the Taiwan Stock
Exchange.
|
Asset
Allocation
|
Company (BBG
ticker)
|
Price
|
Holding
|
Value US$
|
% of
portfolio
|
|
Singapore
|
7.2
|
||||
|
Hsu Fu Chi
International
|
HFCI SP
|
SG$3.7
|
9,484,000
|
$27,122,481
|
3.3
|
|
China Fishery
Group
|
CFG SP
|
SG$2.2
|
13,255,000
|
$23,136,601
|
2.9
|
|
Financial One
Corp
|
FIN SP
|
SG$0.5
|
12,030,000
|
$4,593,392
|
0.6
|
|
CDW Holding
|
CDW SP
|
SG$0.1
|
51,310,000
|
$3,298,586
|
0.4
|
|
USA
|
5.2
|
||||
|
WuXi PharmaTech
Cayman
|
WX US
|
US$16.1
|
883,490
|
$14,259,529
|
1.8
|
|
Far East Energy
|
FEEC US
|
US$0.7
|
16,392,823
|
$11,474,976
|
1.4
|
|
Hollysys Automation
Technologies
|
HOLI US
|
US$15.2
|
530,200
|
$8,037,832
|
1.0
|
|
Mindray Medical
International
|
MR US
|
US$26.4
|
291,700
|
$7,700,880
|
1.0
|
|
Other assets &
liabilities
|
$20,941,438
|
2.6
|
INDEX
DESCRIPTIONS
MSCI Golden Dragon
Index
The MSCI Golden Dragon is a free
float-adjusted market capitalization index that is designed to measure equity
market performance in the China region. As of May 2005 the MSCI Golden
Dragon Index consisted of the following country indices: China, Hong Kong and Taiwan.
Hang Seng China Enterprise Index
The Hang Seng China Enterprise Index is
a capitalization-weighted index comprised of state-owned Chinese companies
(H-shares) listed on the Hong Kong Stock Exchange and included in Hans Seng
Mainland China index.
Shanghai Stock Exchange 180
Index
The Shanghai Stock Exchange 180 'A'
Share Index is a capitalization-weighted index. The index tracks the daily price
performance of the 180 most representative 'A' share stocks listed on the
Shanghai Stock Exchange.
OBJECTIVE
The investment objective of the Fund is
to achieve long term capital appreciation. The Fund seeks to achieve its
objective through investment in the equity securities of companies and other
entities with significant assets, investments, production activities, trading or
other business interests in China or which derive a significant part of
their revenue from China.
The Fund has an operating policy that
the Fund will invest at least 80% of its assets in China companies. For this purpose, 'China
companies' are (i) companies for which the principal securities trading market
is in China; (ii) companies for which the principal securities trading market is
outside of China or in companies organized outside of China, that in both cases
derive at least 50% of their revenues from goods or services sold or produced,
or have a least 50% of their assets in China; or (iii) companies organized in
China. Under the policy, China will mean the People's Republic of
China, including Hong Kong, and Taiwan
CONTACTS
The China Fund, Inc.
c/o State Street Bank
and Trust Company
2 Avenue de Lafayette
PO Box 5049
Boston, MA 02206-5049
Tel: (1) 888 CHN-CALL
(246 2255)
www.chinafundinc.com
Important
information: This document
is issued and approved by Martin Currie Inc (MC Inc), as investment adviser of
The China Fund Inc (the Fund). MC Inc is authorised and regulated by the
Financial Services Authority (FSA) and incorporated under limited liability in
New York, USA. Registered in Scotland (No BR2575), registered address
Saltire Court, 20 Castle Terrace, Edinburgh, EH1 2ES. Information herein is believed to be
reliable but has not been verified by MC Inc. MC Inc makes no representation or
warranty and does not accept any responsibility in relation to such information
or for opinion or conclusion which the reader may draw from the newsletter.
Martin Currie Ltd and Heartland Capital
Management Ltd (HCML) have established MC China Ltd (MCCL), as a joint venture
company, to provide investment management or investment advisory services to our
China product. MCCL has appointed Martin
Currie Investment Management Ltd (MCIM), or its affiliates, as investment
manager of our China funds. HMCL has seconded both Chris
Ruffle and Shifeng Ke to MCIM or its affiliates on a full time basis with the
same roles and responsibilities as if they were full time
employees.
The Fund is classified as a
'non-diversified' investment company under the US Investment Company Act of 1940
as amended. It meets the criteria of a closed ended US mutual fund and its shares are listed
on the New York Stock Exchange. MC Inc has been appointed investment adviser to
the Fund.
Investors are advised that they will not
generally benefit from the rules and regulations of the United Kingdom Financial
Services and Markets Act 2000 and the FSA for the protection of investors, nor
benefit from the United Kingdom Financial Services Compensation Scheme, nor have
access to the Financial Services Ombudsman in the event of a dispute. Investors
will also have no rights of cancellation under the FSA's Conduct of Business
Sourcebook of the United
Kingdom.
This newsletter does not constitute an
offer of shares. MC Inc, its ultimate and intermediate holding companies,
subsidiaries, affiliates, clients, directors or staff may, at any time, have a
position in the market referred to herein, and may buy or sell securities,
currencies, or any other financial instruments in such markets. The information
or opinion expressed in this newsletter should not be construed to be a
recommendation to buy or sell the securities, commodities, currencies or
financial instruments referred to herein.
The information provided in this report
should not be considered a recommendation to purchase or sell any particular
security. There is no assurance that any securities discussed herein will remain
in an account's portfolio at the time you receive this report or that securities
sold have not been repurchased.
It should not be assumed that any of the
securities transactions or holdings discussed here were or will prove to be
profitable, or that the investment recommendations or decisions we make in the
future will be profitable or will equal the investment performance of the
securities discussed herein.
Investing in the Fund involves certain
considerations in addition to the risks normally associated with making
investments in securities. The value of the shares issued by the Fund, and the
income from them, may go down as well as up and there can be no assurance that
upon sale, or otherwise, investors will receive back the amount originally
invested. There can be no assurance that you will receive comparable performance
returns, or that investments will reflect the performance of the stock examples
contained in this document. Movements in foreign exchange rates may have a
separate effect, unfavorable as well as favorable, on the gain or loss otherwise
experienced on an investment. Past performance is not a guide to future returns.
Accordingly, the Fund is only suitable for investment by investors who are able
and willing to withstand the total loss of their investment. In particular,
prospective investors should consider the following risks:
|
à
|
The companies quoted on Greater Chinese stock exchanges are exposed to the risks of political, social and religious instability, expropriation of assets or nationalisation, rapid rates of inflation, high interest rates, currency depreciation and fluctuations and changes in taxation, which may affect income and the value of investments. |
|
à
|
At present, the securities market and the regulatory framework for the securities industry in China is at an early stage of development. The China Securities Regulatory Commission (CSRC) is responsible for supervising the national securities markets and producing relevant regulations. The Investment Regulations, under which the Fund invests in the People's Republic of China (PRC) and which regulate repatriation and currency conversion, are new. The Investment Regulations give CSRC and State Administration of Foreign Exchange (SAFE) wide discretions and there is no precedent or certainty as to how these discretions might be exercised, either now or in the future. The Fund may, from time to time, obtain access to the securities markets in China via Access Products. Such products carry additional risk and may be less liquid than the underlying securities which they represent. |
|
à
|
During the past 15 years, the PRC
government has been reforming the economic and political systems of the
PRC, and these reforms are expected to continue, as evidenced by the
recently announced changes. The Fund's operations and financial results
could be adversely affected by adjustments in the PRC's state plans,
political, economic and social conditions, changes in the policies of the
PRC government such as changes in laws and regulations (or the
interpretation thereof), measures which may be introduced to control
inflation, changes in the rate or method of taxation, imposition of
additional restrictions on currency conversion and the imposition of
additional import
restrictions.
|
|
à
|
PRC's disclosure and
regulatory standards are in many respects less stringent than standards in
certain Organisation for Economic Co-operation and Development (OECD)
countries, and there may be less publicly available or less reliable
information about PRC companies than is regularly published by or about
companies from OECD
countries.
|
|
à
|
The Shanghai Stock Exchange and
Shenzhen Stock Exchange have lower trading volumes than most OECD
exchanges and the market capitalisations of listed companies are small
compared to those on more developed exchanges in developed markets. The
listed equity securities of many companies in the PRC are accordingly
materially less liquid, subject to greater dealing spreads and experience
materially greater volatility than those of OECD countries. These factors
could negatively affect the Fund's
NAV.
|
|
à
|
The Fund invests primarily in
securities denominated in other currencies but its NAV will be quoted in
US dollars. Accordingly, a change in the value of such securities against
US dollars will result in a corresponding change in the US dollar
NAV.
|
|
à
|
The marketability of quoted shares
may be limited due to foreign investment restrictions, wide dealing
spreads, exchange controls, foreign ownership restrictions, the restricted
opening of stock exchanges and a narrow range of investors. Trading volume
may be lower than on more developed stockmarkets, and equities are less
liquid. Volatility of prices can also be greater than in more developed
stockmarkets. The infrastructure for clearing, settlement and registration
on the primary and secondary markets may be underdeveloped. Under certain
circumstances, there may be delays in settling transactions in some of the
markets.
|
Martin Currie Inc, registered in
Scotland (no BR2575)
Registered office: Saltire Court, 20
Castle Terrace, Edinburgh EH11 2ES Tel: 44 (0) 131 229 5252 Fax: 44 (0) 131 228
5959 www.martincurrie.com
North American office: 1350 Avenue of
the Americas, Suite 3010, New York, NY 10019, USA Tel: (1) 212 258 1900 Fax: (1)
212 258 1919
Authorised and registered by the
Financial Services Authority and incorporated with limited liability in New
York, USA.
Please note: calls to the above numbers
may be recorded.