Attached files
| file | filename |
|---|---|
| 8-K - 8-K - CubeSmart | a11-4256_18k.htm |
Exhibit 99.1
|
|
UBS Self Storage REIT Summit New York January 2011 |
|
|
Forward Looking Statements The forward-looking statements contained in this presentation are subject to various risks and uncertainties. Although the Company believes the expectations reflected in such forward-looking statements are based on reasonable assumptions, there can be no assurance that its expectations will be achieved. You should not rely on our forward-looking statements because the matters they describe are subject to known and unknown risks and uncertainties that could cause the Company’s future results, performance, or achievements to differ significantly from the results, performance, or achievements expressed or implied by such statements. Such risks are set forth under the captions “Item 1A. Risk Factors” and “Forward-Looking Statements” in our annual report on Form 10-K and under the caption “Item 2. Management’s Discussion and Analysis of Financial Condition and Results of Operations” (or similar captions) in our quarter reports on Form 10-Q, and described from time to time in the Company’s filings with the SEC. Forward-looking statements are not guarantees of performance. For forward-looking statements herein, the Company claims the protection of the safe harbor for forward-looking statements contained in the Private Securities Litigation Reform Act of 1995. The Company assumes no obligation to update or supplement forward-looking statements that become untrue because of subsequent events. |
|
|
YSI has an expansive property portfolio with a national footprint Portfolio Overview 16 52 9 27 4 33 24 44 9 1 3 8 9 5 4 2 9 2 17 24 4 5 1 1 6 1 9 1 3 1 13 1 10 4 9 1 5 7 1 5 4 4 11 Text Key: White/Black – YSI Owned/JV Gray – YSI Managed . 1) Excludes 735 U-Store-It Network facilities. Property Count Square Feet Wholly-Owned 342 21.9 million Heitman JV 22 1.6 million Managed 92 5.9 million Total 456 29.4 million 1 44 2 1 |
|
|
Company Highlights Diversified Portfolio of High-Quality Assets YSI’s geographic and tenant diversity limits exposure to any single tenant or market. Experienced Management Team The top three executives, Dean Jernigan, Chris Marr, and Tim Martin have an average of approximately 21 years of real estate experience and have worked in the self-storage industry for an average of approximately 14 years. Favorable Trends in the Self-Storage Sector The self-storage sector has performed better than most sectors during the recent downturn and is poised to outperform other asset classes as the economy improves. Successful Execution of Management’s Deleveraging Plan YSI executed on a deleveraging plan reducing debt to total assets from 49.5% at 6/30/09 to 36.0% at 9/30/10 and decreased debt outstanding by 29% during the same period. Demonstrated Access to Capital YSI has well-established contacts with institutional, public and private sources for both equity and debt capital. During the third quarter of 2009, the Company raised over $875 million through its capital raising efforts. Stated Growth Plan Maintains a Conservative Capital Structure YSI plans to accretively acquire properties on a leverage neutral basis while pursuing an investment grade rating. |
|
|
Experienced Management Team U-Store-It’s management team has deep publicly-traded REIT and self-storage sector experience. Officer / Position Relevant Experience Officer / Position Relevant Experience Dean Jernigan U-Store-It: Since 2006 Joe Fitzgerald U-Store-It: Since 1994 Chief Executive Officer Private Investor / Jernigan Property Group: 2002-2006 Vice President, International Mini Warehouse Storage: 1990-1994 and Trustee Storage USA Founder, Chairman and CEO: 1984-2002 Operations Chris Marr U-Store-It: Since 2006 Will Hall U-Store-It: Since 2006 President and Brandywine Realty Trust CFO: 2002-2006 Vice President, Shurgard Self Storage: 1989-2006 Chief Investment Officer Storage USA CFO: 1998-2002 Operations Tim Martin U-Store-It: Since 2006 Ajai Nair U-Store-It: Since 2007 Chief Financial Officer Brandywine Realty Trust: 1997-2006 Vice President, & Brandywine Realty Trust VP of IT: 2005-2007 Arthur Andersen LLP: 1993-1997 Chief Information Officer David's Bridal Chief Technology Officer: 1999-2005 Jeffrey Foster U-Store-It: Since 2009 Carey Parsons U-Store-It: Since 2006 Senior Vice President, Gramercy Realty: 2003-2009 Vice President, Makowsky, Ringel, Greenberg LLC: 2001-2006 Chief Legal Officer Morgan, Lewis & Bockius, LLP: 1999-2003 Operations Storage USA: 1995-2001 Bob Blatz U-Store-It: Since 2010 Jonathan Perry U-Store-It: Since 2008 Senior Vice President, American Land Lease President and COO: 1999-2009 Vice President, Jernigan Property Group: 2004-2008 Operations PriceWaterhouseCoopers Senior Consultant Asset Management Storage USA / GE Capital Real Estate: 1998-2004 Steve Hartman U-Store-It: Since 2010 Carol Shipley U-Store-It: Since 2010 Senior Vice President, eBay Partner Network Senior Director: 2000-2009 Vice President, United Stor-All Management President: 2000-2010 Marketing Accenture Consultant Third Party Management Storage USA: 1991-2000 Doug Tyrell U-Store-It: Since 2006 Vice President, Brandywine Realty Trust: 2001-2006 Tax Arthur Andersen LLP: 1996-2001 U-Store-It Senior Management Team |
|
|
Favorable Trends in the Self-Storage Sector Self-storage has developed a favorable reputation as recession-resilient due to its diverse, defensive demand drivers. Household mobility is the main storage demand driver, which benefits in both economic expansions and contractions. A diversified tenant mix including residential, commercial, military and student users. Historically low maintenance cap ex requirements, absence of tenant improvement requirements and high yields also drive positive overall cash flow characteristics. Source: Green Street Advisors. Average = (0.7%) Office Self-Storage Strip Centers Multifamily Industrial 2008 - 2010 NOI CAGR (2.0%) (0.4%) 0.9% (0.6%) (1.5%) (2.5%) (2.0%) (1.5%) (1.0%) (0.5%) 0.0% 0.5% 1.0% 1.5% 2.0% 2.5% |
|
|
Favorable Trends in the Self-Storage Sector Industry supply growth has been muted by a challenging financing and operating environment in which small, private operators are struggling to compete. Total construction starts are down by approximately 65% from the levels seen four years ago. Source: Self Storage Data Services, Inc. and U-Store-It estimates (1) Includes alterations/renovations and interior completions (2) Overstates new supply by counting the full facility size for alternation/renovation projects Excluding alterations/renovations and secondary markets in which the REITs do not compete, SSDS reports just 7 new construction starts for the top 50 MSAs in the second quarter of 2010. Over the past four quarters, U-Store-It has had just 13 competing stores open across its 400-property portfolio, and only 9 of these properties compete within a U-Store-It facility’s primary 3-mile trade area. 0.0 1.0 2.0 3.0 4.0 5.0 6.0 0 10 20 30 40 50 60 70 80 90 1Q06 2Q06 3Q06 4Q06 1Q07 2Q07 3Q07 4Q07 1Q08 2Q08 3Q08 4Q08 1Q09 2Q09 3Q09 4Q09 1Q10 2Q10 Total New Square Footage (millions)2 Construction Starts1 New Supply # of Construction Starts Square Footage |
|
|
Debt Maturities Debt Maturity Schedule (as of 12/31/2010) YSI has numerous avenues to access capital to meet upcoming debt maturities: Retained cash flow Unsecured revolving line of credit ($207 million of availability at 12/31/10) Public equity Preferred equity Unsecured debt Secured debt |
|
|
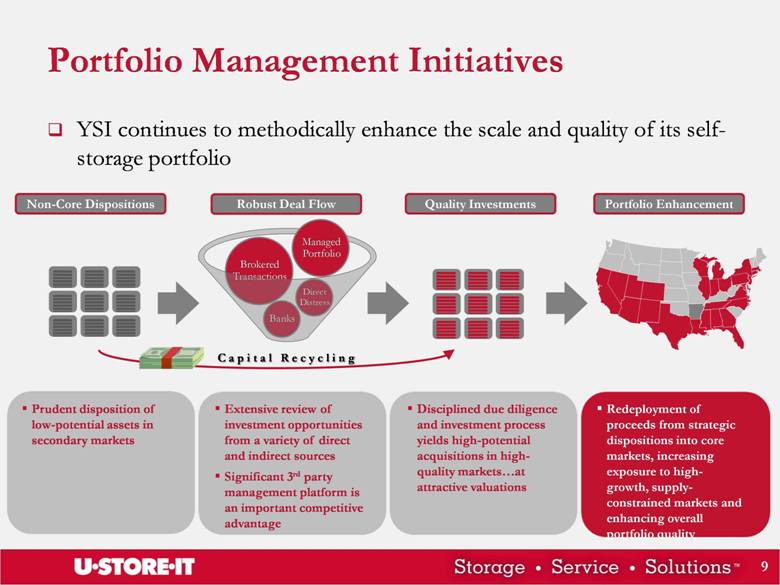
Robust Deal Flow Quality Investments Portfolio Enhancement Non-Core Dispositions YSI continues to methodically enhance the scale and quality of its self-storage portfolio Portfolio Management Initiatives Extensive review of investment opportunities from a variety of direct and indirect sources Significant 3rd party management platform is an important competitive advantage Disciplined due diligence and investment process yields high-potential acquisitions in high-quality markets at attractive valuations Prudent disposition of low-potential assets in secondary markets Redeployment of proceeds from strategic dispositions into core markets, increasing exposure to high-growth, supply-constrained markets and enhancing overall portfolio quality C a p i t a l R e c y c l i n g |
|
|
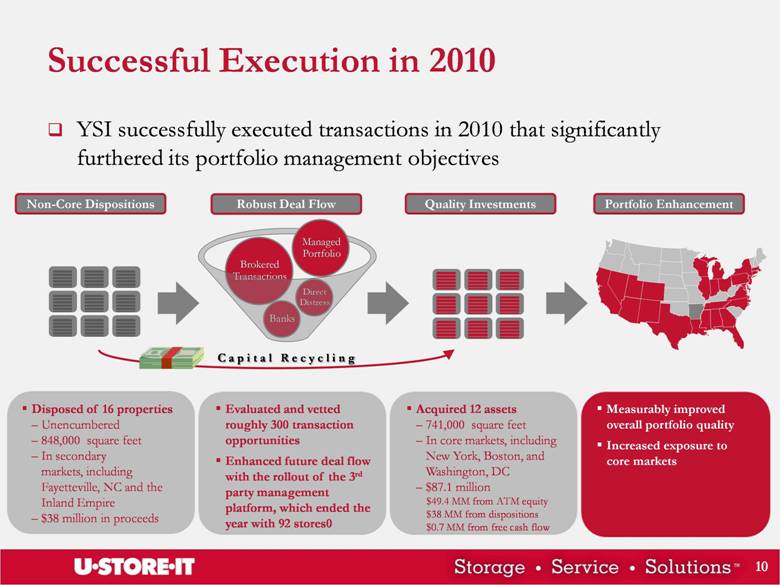
YSI successfully executed transactions in 2010 that significantly furthered its portfolio management objectives Successful Execution in 2010 Evaluated and vetted roughly 300 transaction opportunities Enhanced future deal flow with the rollout of the 3rd party management platform, which ended the year with 92 stores0 Acquired 12 assets 741,000 square feet In core markets, including New York, Boston, and Washington, DC $87.1 million $49.4 MM from ATM equity $38 MM from dispositions $0.7 MM from free cash flow Disposed of 16 properties Unencumbered 848,000 square feet In secondary markets, including Fayetteville, NC and the Inland Empire $38 million in proceeds Measurably improved overall portfolio quality Increased exposure to core markets Robust Deal Flow Quality Investments Portfolio Enhancement Non-Core Dispositions C a p i t a l R e c y c l i n g |
|
|
2010 Acquisition Detail Acquired assets were concentrated in attractive markets with high-growth characteristics, strong demographics, and significant barriers to entry Market Property Count Transaction Value New York, NY 4 $52.5 million Washington, DC 2 $16.5 million Frisco, TX 1 $5.8 million Philadelphia/So. NJ 3 $4.3 million Orlando, FL 1 $4.3 million Boston, MA 1 $3.7 million Total 12 $87.1 million |
|
|
2010 Acquisition Detail (continued) Acquired assets included a mix of stabilized and lease-up properties and, as a testament to the strength of YSI’s proprietary deal flow, were sourced in a variety of ways * 7 acquisitions were sourced from YSI’s managed portfolio, including 5 of the 25 distressed facilities that YSI managed on behalf of a national lender. 1) Stated as a percentage of total transaction value. 1 1 |
|
|
2010 Acquisition Detail (continued) In addition to favorable locations and operating characteristics, acquired assets exhibit exceptional physical quality Herndon, VA Orlando, FL |
|
|
2010 Acquisition Detail (continued) Ridgewood, NY Bronx, NY |
|
|
2010 Acquisition Detail (continued) Brooklyn, NY |
|
|
2010 Disposition Detail While the acquisitions strengthened exposure to core markets, dispositions effectively pruned exposure to less-attractive, secondary markets Market Property Count Square Footage Inland Empire, CA 14 752,000 Fayetteville, NC 2 96,000 Total 16 848,000 YSI’s rentable square footage in the Inland Empire was reduced by 32% Total transaction value of $38 million |
|
|
2010 Quality Upgrade A comparison of operating statistics between 2010 acquisitions and dispositions reflects the ongoing portfolio transformation 1) Disposition data as of September 30, 2010. 2) Data shown for those properties acquired on in-place performance metrics. Data as collected at the time of underwriting each transaction. 1 1 1 1 2 2 2 2 |
|
|
3-Year Evolution in Portfolio Composition Significant transaction volume over the past three years has measurably enhanced portfolio composition, as evidenced by a 48% increase in properties located in core markets 1 1 2 2 1) Includes wholly-owned, joint venture, and managed properties. 2) Includes previously wholly-owned stores for which management contracts were assumed upon disposition. Dispositions Acquisitions Managed Stores # % of Sq Ft # # # # % of Sq Ft Core Markets (MSA) 126 33.9% (5) 12 54 187 44.1% Chicago 27 6.2% 0 0 10 37 8.0% Miami/Ft. Lauderdale/West Palm 25 7.1% (3) 0 7 29 7.5% Baltimore/DC 7 2.2% 0 3 19 29 7.1% Dallas/Ft. Worth 18 4.3% 0 1 4 23 4.9% New York/Northern NJ 16 4.1% (2) 0 4 18 4.1% Philadelphia/Southern NJ 5 1.4% 0 3 8 16 3.7% Atlanta 9 2.9% 0 0 1 10 2.8% San Diego 6 2.0% 0 0 0 6 1.7% Los Angeles 4 1.3% 0 0 0 4 1.2% New York City Boroughs 1 0.3% 0 4 0 5 1.1% Austin 3 0.8% 0 0 0 3 0.7% Boston 2 0.5% 0 1 1 4 0.7% Orange County 2 0.5% 0 0 0 2 0.5% San Francisco/Oakland 1 0.3% 0 0 0 1 0.3% Secondary Markets 283 66.1% (53) 1 38 269 55.9% Total 409 100.0% (58) 13 92 456 100.0% Portfolio as of January 2008 Portfolio as of January 2011 |
|
|
3-Year Evolution in 3-Mile Demographics Submarket demographic characteristics reflect the continuing quality enhancement of YSI’s portfolio 1) Weighted average (weighted by property square footage) of estimated 2010 Census block group demographic data. 2) Includes wholly-owned, joint venture, and managed properties. 3) Includes previously wholly-owned stores for which management contracts were assumed upon disposition. 13.3% Increase 4.5% Increase 1 2 2 3 3 1 2 2 3 3 ~ ~ ~ ~ |
|
|
Momentum Into 2011 Acquisitions Currently targeting to invest $75-125MM in acquisitions in 2011. Goal is to strike a balance between in-place NOI and upside, with a particular focus in the aforementioned core markets. 3rd Party Management Expect to continue to expand the national footprint and further leverage scalable infrastructure by aggressively seeking new management contracts. Seeking to add 15-25 new management contracts in 2011. Dispositions Continue efforts to opportunistically dispose of assets in tertiary markets and reduce exposure in lower barrier to entry, slower growth markets/facilities. Currently targeting $25-50MM in 2011 dispositions. |