Attached files
| file | filename |
|---|---|
| 8-K - GLOBAL TELECOM & TECHNOLOGY, INC. 8-K - GTT Communications, Inc. | a6572000.htm |
Exhibit 99
1 Global Telecom & Technology Company Overview Rick Calder, President & CEO 13th Annual Needham & Co. Growth Conference January 13, 2011
2 Disclaimer This presentation may contain “Forward-Looking Statements” within the meaning of Section 27A of the Securities Act of 1933 and Section 21E of the Securities Exchange Act of 1934. All statements other than statements of historical facts made in this presentation regarding the prospects of our industry and our prospects, plans, financial position and business strategy may constitute forward-looking statements. These statements are based upon management’s current beliefs or expectations and are inherently subject to significant business, economic and competitive risks, uncertainties, and contingencies, many of which are beyond our control. Undue reliance should not be placed on such statements. We caution you that forward-looking statements are not guarantees of future performance and that actual results of operations, financial condition and liquidity, and developments in the industry, may differ materially from those made in or suggested by any forward-looking statements contained in this presentation. Such forward-looking statements involve known and unknown risks, uncertainties, assumptions, and other factors which may cause the company’s actual results, performance or achievements to be materially different from any future results, performance or achievements expressed or implied by such forward-looking statements. Factors and risks that could cause actual results to differ materially from our expectations are described in the most recent Global Telecom and Technology Forms 10-Q and 10-K, on file with the SEC. (www.sec.gov)The forward-looking statements in this presentation speak only as of the date of this presentation and might not occur in light of these risks, uncertainties, assumptions, and other factors. We undertake no obligation and disclaim any obligation to publicly update or revise any forward-looking statements, whether as a result of new information, future events or otherwise.

3 Investment Highlights Leading provider of global data telecom services Accelerating demand for bandwidth and network interconnections Proprietary operating platform drives competitive advantages, economies of scale Profitable, cash-flow generating business model with proven results Deep telecommunications sector experience and leadership Positioned for continued organic growth and growth through acquisition
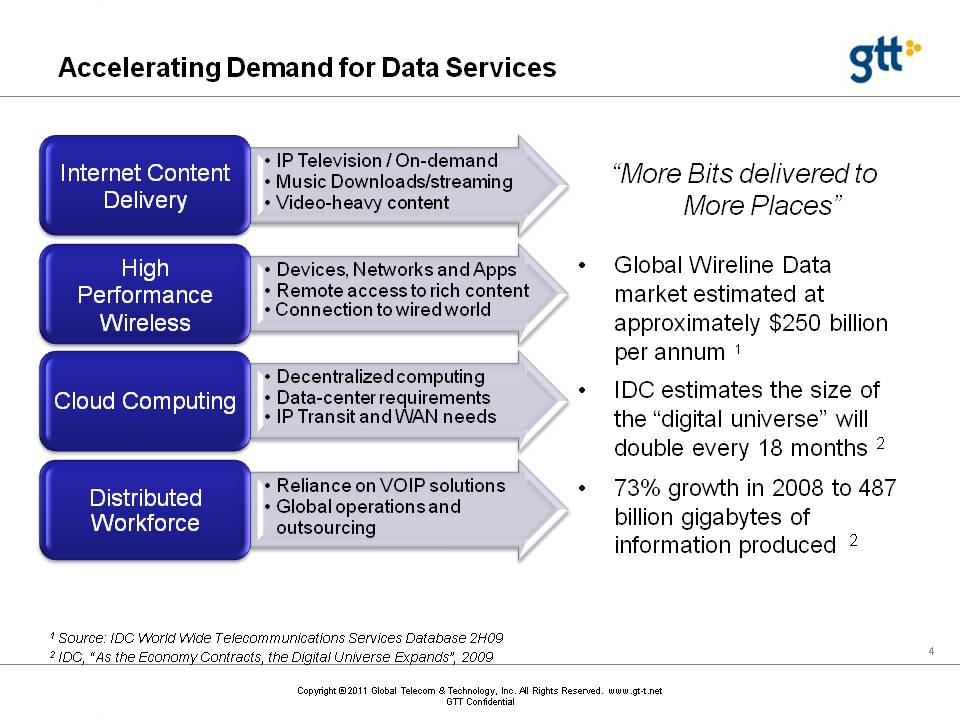
4 Accelerating Demand for Data Services “More Bits delivered to More Places” Global Wireline Data market estimated at approximately $250 billion per annum 1 IDC estimates the size of the “digital universe” will double every 18 months 2 73% growth in 2008 to 487 billion gigabytes of information produced 2 1 Source: IDC World Wide Telecommunications Services Database 2H09 2 IDC, “As the Economy Contracts, the Digital Universe Expands”, 2009
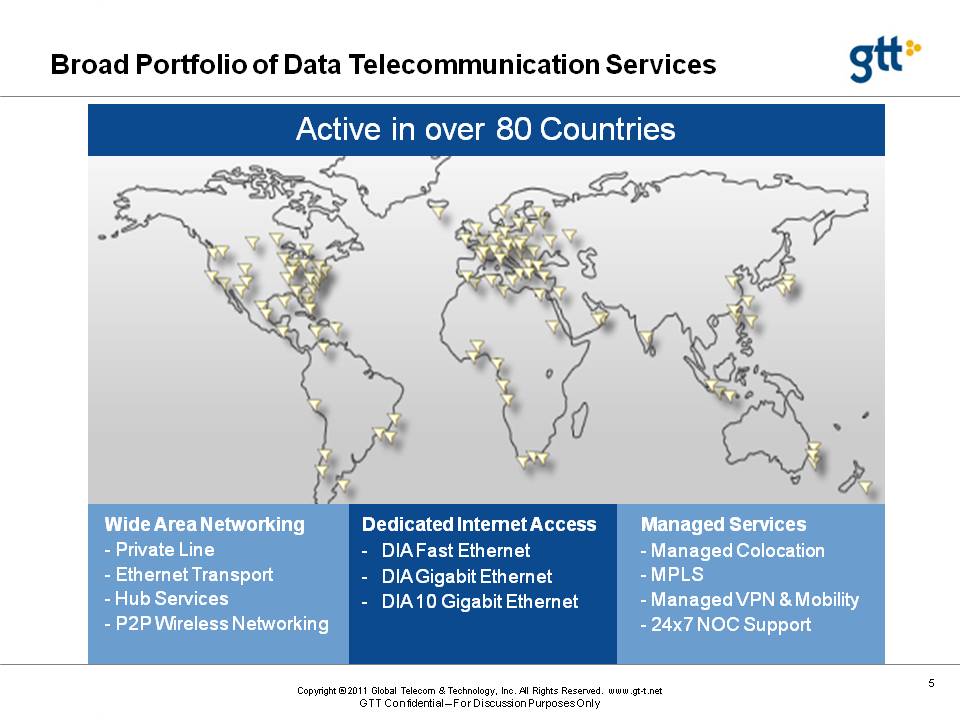
5 Broad Portfolio of Data Telecommunication Services Active in over 80 Countries Dedicated Internet AccessDIA Fast Ethernet DIA Gigabit Ethernet DIA 10 Gigabit Ethernet Managed Services Managed Colocation MPLS Managed VPN & Mobility 24x7 NOC Support Wide Area Networking Private Line Ethernet Transport Hub Services P2P Wireless Networking
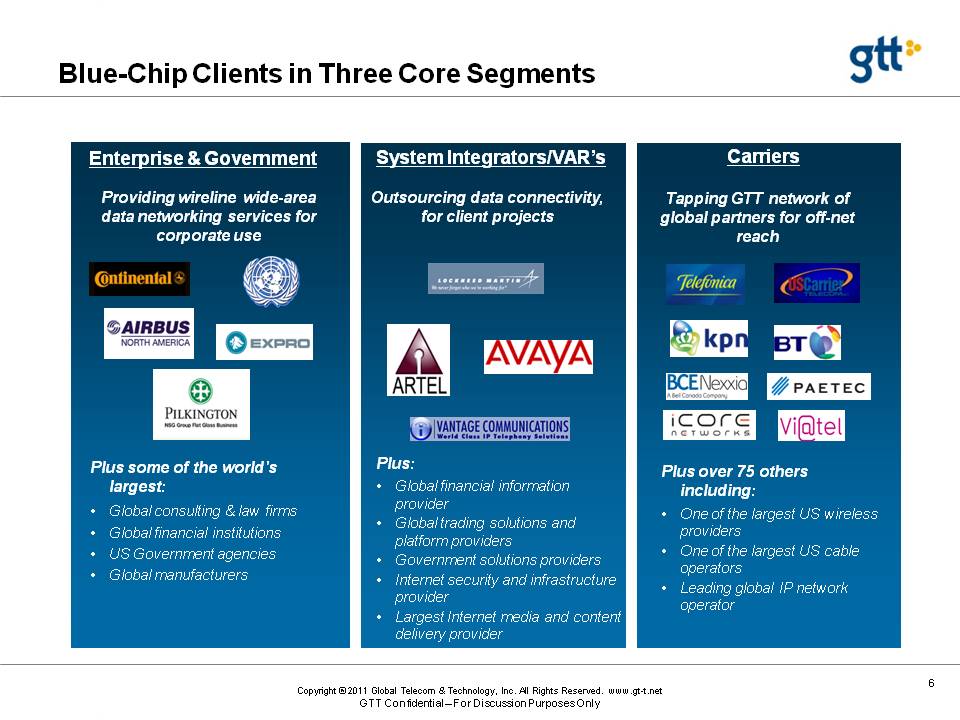
6 Blue-Chip Clients in Three Core Segments Enterprise & Government System Integrators/VAR’s Carriers Tapping GTT network of global partners for off-net reach Outsourcing data connectivity, for client projects Providing wireline wide-area data networking services for corporate use Plus over 75 others including:One of the largest US wireless providersOne of the largest US cable operatorsLeading global IP network operator Plus some of the world’s largest: Global consulting & law firms Global financial institutions US Government agencies Global manufacturers Plus: Global financial information provider Global trading solutions and platform providers Government solutions providers Internet security and infrastructure provider Largest Internet media and content delivery provider
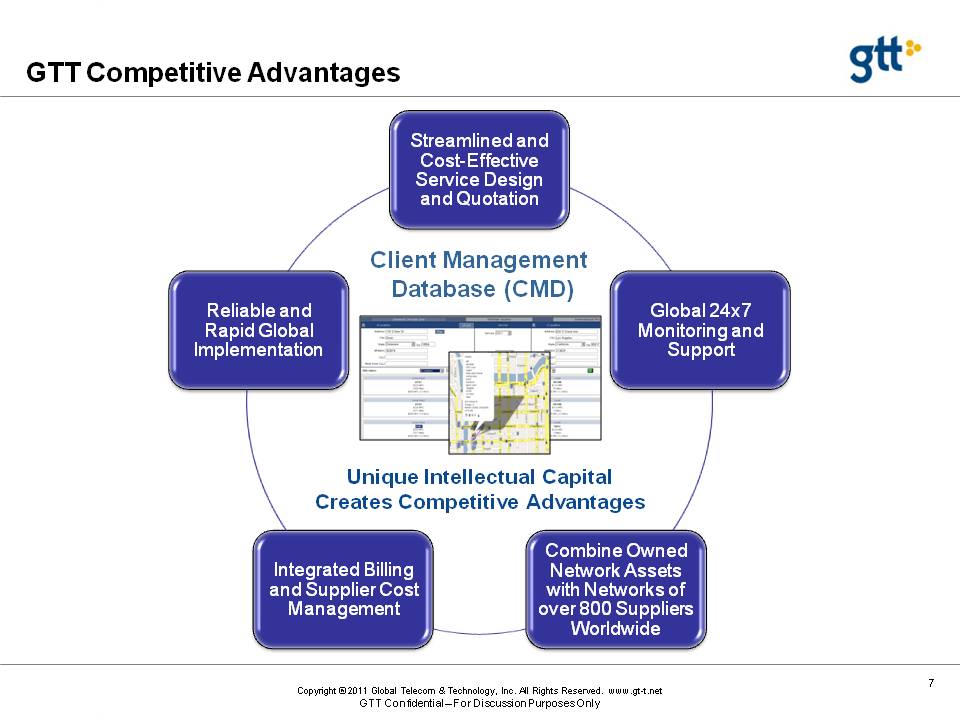
7 Differentiated by Global Reach and Reliable Implementation GTT Competitive Advantages Unique Intellectual Capital Creates Competitive Advantages Client Management Database (CMD)
8 Growth Strategy Drive Organic GrowthFocus on data telecom servicesFocus on medium to large clients, including enterprises, system integrators, government and carriersInvest in GTT network assetsDrive Growth through AcquisitionFocus on data telecom services with medium to large clientsAcquire complementary network assetsIdentified targets in US and Europe
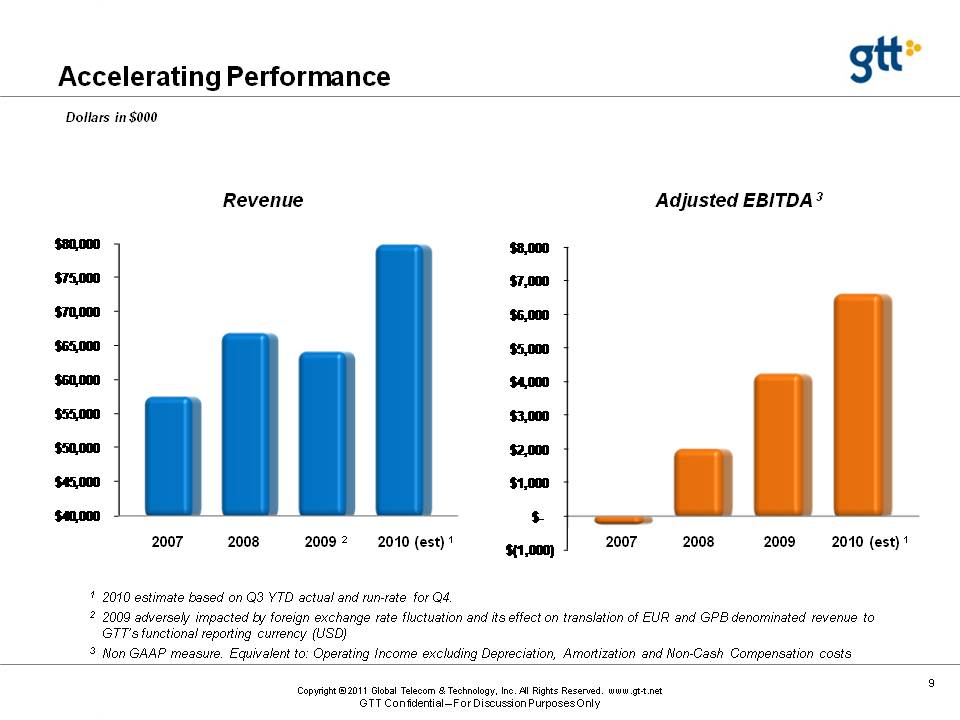
9 Accelerating Performance Dollars in $000 Adjusted EBITDA 3 Revenue 1 2010 estimate based on Q3 YTD actual and run-rate for Q4. 2 2009 adversely impacted by foreign exchange rate fluctuation and its effect on translation of EUR and GPB denominated revenue to GTT’s functional reporting currency (USD)3 Non GAAP measure. Equivalent to: Operating Income excluding Depreciation, Amortization and Non-Cash Compensation costs(Gp:) 2007 2008 2009 2 2010 (est) 1 2007 2008 2009 2010 (est) 1
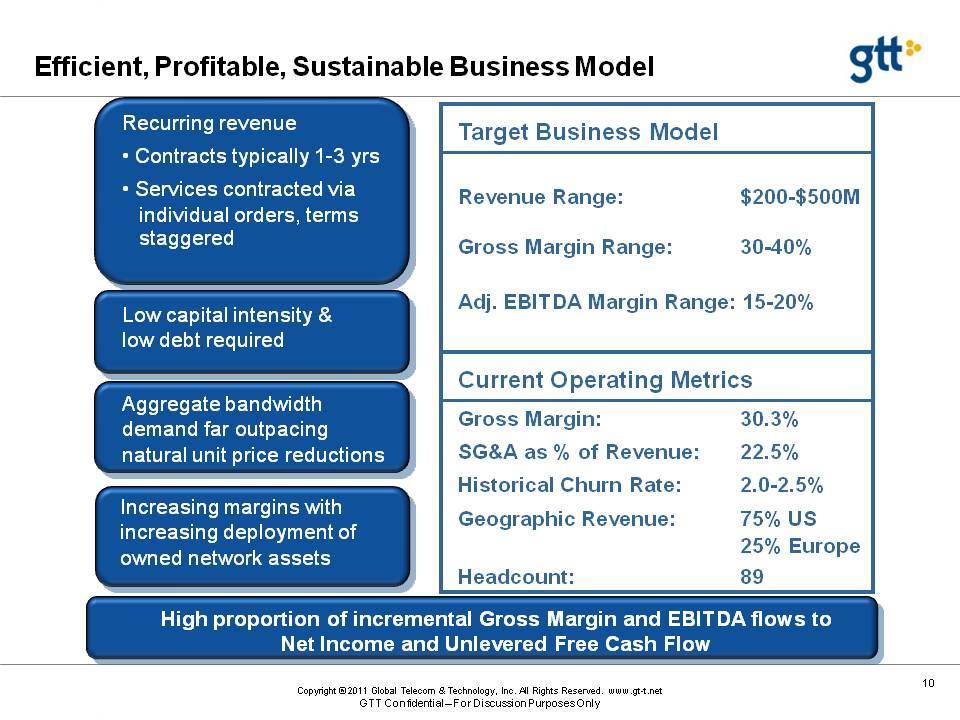
10 Efficient, Profitable, Sustainable Business Model Recurring revenue Contracts typically 1-3 yrs Services contracted via individual orders, terms staggered Low capital intensity & low debt required Aggregate bandwidth demand far outpacing natural unit price reductions Increasing margins with increasing deployment of owned network assets High proportion of incremental Gross Margin and EBITDA flows to Net Income and Unlevered Free Cash Flow Revenue Range: $200-$500MGross Margin Range: 30-40%Adj. EBITDA Margin Range: 15-20% Target Business Model Current Operating Metrics Gross Margin: 30.3%SG&A as % of Revenue: 22.5%Historical Churn Rate: 2.0-2.5% Geographic Revenue: 75% US 25% EuropeHeadcount: 89
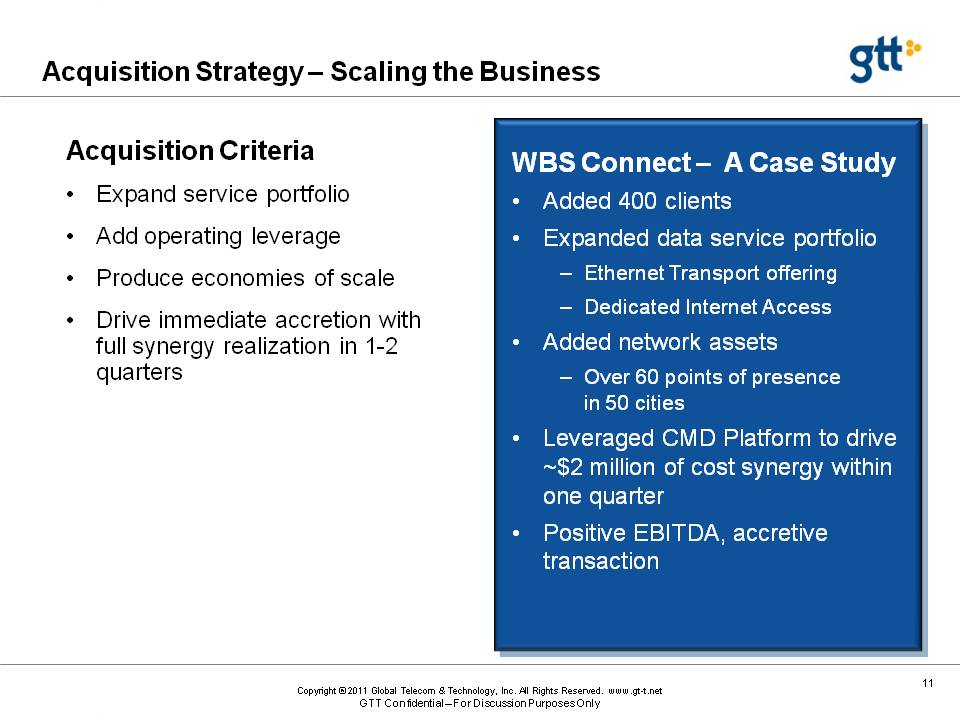
11 Acquisition Strategy – Scaling the Business WBS Connect – A Case StudyAdded 400 clientsExpanded data service portfolioEthernet Transport offeringDedicated Internet AccessAdded network assetsOver 60 points of presence in 50 citiesLeveraged CMD Platform to drive ~$2 million of cost synergy within one quarter Positive EBITDA, accretive transaction Acquisition CriteriaExpand service portfolioAdd operating leverageProduce economies of scaleDrive immediate accretion with full synergy realization in 1-2 quarters
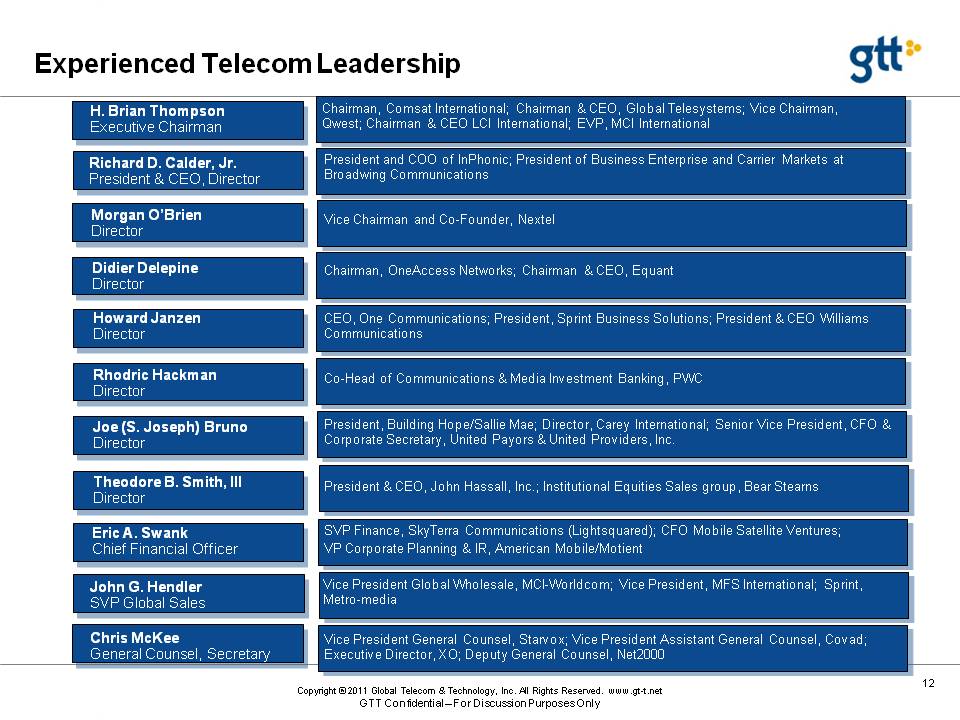
12 Experienced Telecom Leadership H. Brian ThompsonExecutive Chairman Chairman, Comsat International; Chairman & CEO, Global Telesystems; Vice Chairman, Qwest; Chairman & CEO LCI International; EVP, MCI International President and COO of InPhonic; President of Business Enterprise and Carrier Markets at Broadwing Communications Vice Chairman and Co-Founder, Nextel Chairman, OneAccess Networks; Chairman & CEO, Equant CEO, One Communications; President, Sprint Business Solutions; President & CEO Williams Communications Co-Head of Communications & Media Investment Banking, PWC President, Building Hope/Sallie Mae; Director, Carey International; Senior Vice President, CFO & Corporate Secretary, United Payors & United Providers, Inc. Vice President Global Wholesale, MCI-Worldcom; Vice President, MFS International; Sprint, Metro-media Vice President General Counsel, Starvox; Vice President Assistant General Counsel, Covad; Executive Director, XO; Deputy General Counsel, Net2000 SVP Finance, SkyTerra Communications (Lightsquared); CFO Mobile Satellite Ventures; VP Corporate Planning & IR, American Mobile/Motient President & CEO, John Hassall, Inc.; Institutional Equities Sales group, Bear Stearns Richard D. Calder, Jr.President & CEO, Director Morgan O’BrienDirector Didier Delepine Director Howard Janzen Director Rhodric Hackman Director Joe (S. Joseph) Bruno Director Theodore B. Smith, III Director Eric A. Swank Chief Financial Officer John G. Hendler SVP Global Sales Chris McKee General Counsel, Secretary
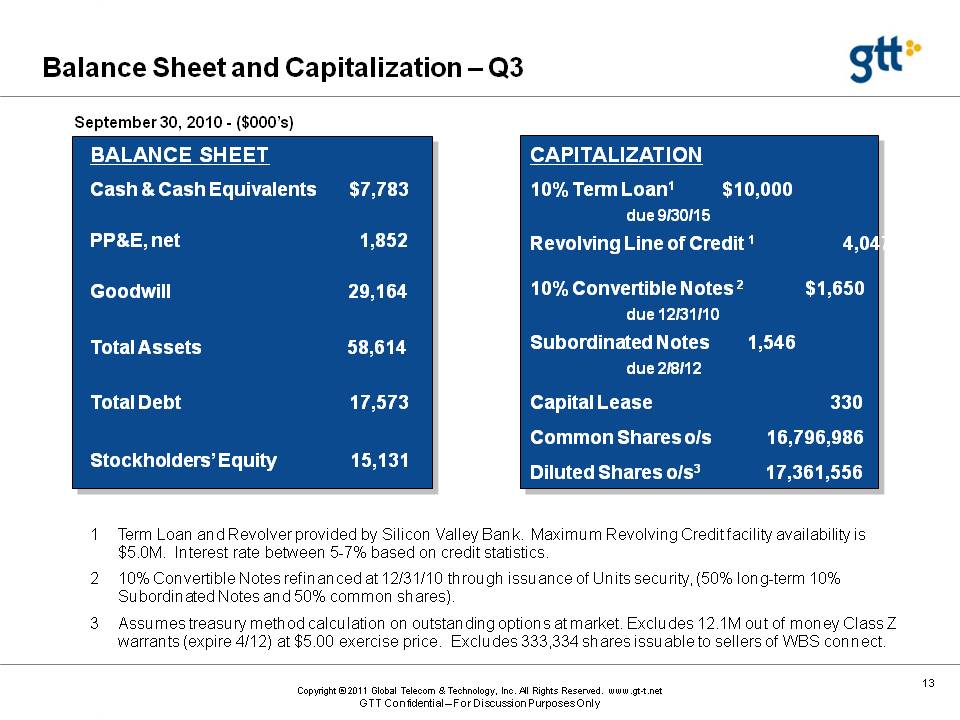
13 Balance Sheet and Capitalization – Q3 BALANCE SHEET Cash & Cash Equivalents $7,783PP&E, net 1,852Goodwill 29,164Total Assets 58,614Total Debt 17,573 Stockholders’ Equity 15,131 CAPITALIZATION10% Term Loan1 $10,000 due 9/30/15Revolving Line of Credit 1 4,04710% Convertible Notes 2 $1,650 due 12/31/10Subordinated Notes 1,546 due 2/8/12Capital Lease 330Common Shares o/s 16,796,986 Diluted Shares o/s3 17,361,556 September 30, 2010 - ($000’s) Term Loan and Revolver provided by Silicon Valley Bank. Maximum Revolving Credit facility availability is $5.0M. Interest rate between 5-7% based on credit statistics. 10% Convertible Notes refinanced at 12/31/10 through issuance of Units security, (50% long-term 10% Subordinated Notes and 50% common shares). Assumes treasury method calculation on outstanding options at market. Excludes 12.1M out of money Class Z warrants (expire 4/12) at $5.00 exercise price. Excludes 333,334 shares issuable to sellers of WBS connect.
14 Investment Highlights Leading provider of global data telecom services Accelerating demand for bandwidth and network interconnections Proprietary operating platform drives competitive advantages, economies of scale Profitable, cash-flow generating business model with proven results Deep telecommunications sector experience and leadership Positioned for continued organic growth and growth through acquisition