Attached files
| file | filename |
|---|---|
| 8-K - FORM 8-K - NAUTILUS, INC. | d8k.htm |
 ICR 13
Annual XChange
Conference
January 12, 2011
Exhibit 99.1
th |
 Safe Harbor
Statement 2
This document and the presentation of which it forms a part includes forward-looking
statements (statements which are not historical facts) within the meaning of the
Private Securities Litigation Reform Act of 1995, including any statements concerning management's expectation of
improvement in consumer credit approval rates, continued correlation of credit approval rates
and direct sales and anticipated or possible improvements in direct sales and results
of operations. Factors that could cause Nautilus, Inc. actual results to differ materially from
these forward-looking statements include availability and price of media time consistent
with our cost and audience profile standards, our ability to continue to reduce
operating costs, a further decline in consumer spending due to unfavorable economic conditions, a change in
the availability of credit for our customers who finance their purchases, our ability to
effectively develop, market and sell future products, the impact that delisting or
potential delisting of our common stock from the New York Stock Exchange may have on our customer and
supplier relationships and reputation, our ability to get foreign-sourced product through
customs in a timely manner, our ability to protect our intellectual property,
introduction of lower-priced competing products, unpredictable events and circumstances relating to
international operations including our use of foreign manufacturers, government regulatory
action and general economic conditions. Additional assumptions, risks and
uncertainties are described in detail in our registration statements, reports and other filings with the Securities
and Exchange Commission, including the "Risk Factors" set forth in our Annual Report
on Form 10-K, as supplemented by our quarterly reports on Form 10-Q. Such
filings are available on our website or at www.sec.gov. You are cautioned that such statements are not guarantees of future
performance. Actual results may differ materially from those set forth in the
forward-looking statements. We undertake no obligation to publicly update or revise
forward-looking statements to reflect subsequent events or circumstances. |
 Introduction
•
Nautilus is a provider of fitness equipment in the consumer health and wellness
industry
•
The company was founded in 1986 as Bowflex
of America
–
Bowflex
direct marketing on TV started in 1993
•
Expanded into commercial health club market via acquisition of Nautilus, Inc. in 1999
•
Further expanded into consumer retail market in 2001
–
Acquisition of Schwinn
Fitness in 2001
–
Added Bowflex
and Nautilus branded strength and cardio products to the retail
mix
•
Economic downturn in 2008/2009 negatively affected consumer discretionary
purchases
•
Restructured in 2009-2010 to refocus on the consumer segment
-
Direct to consumer via TV / Internet
-
Retail via both traditional store placement and leading e-commerce sites
3 |
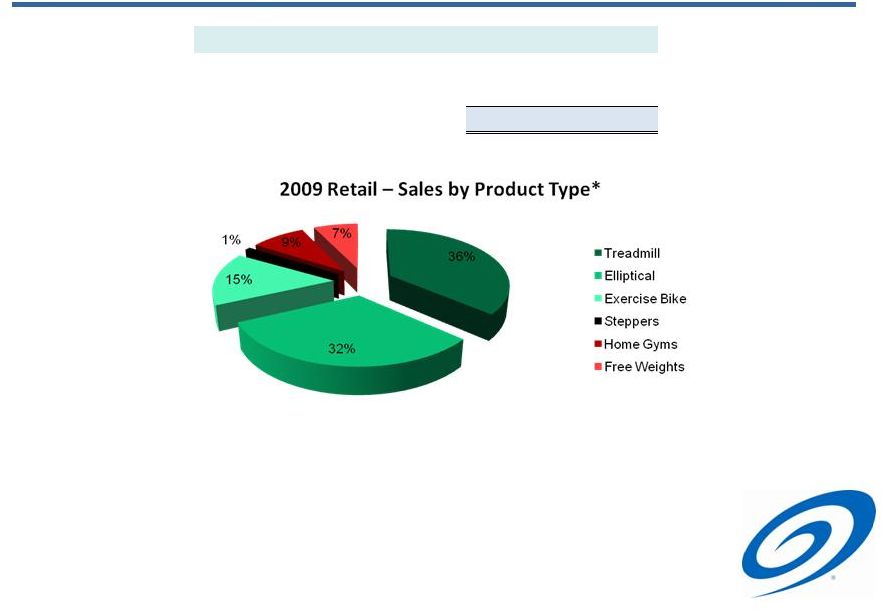 Fitness Equipment
Market •
Cardio machines constitute 84% of retail equipment sales in the major categories
2009 Consumer Fitness Equipment Market Size
Retail (Wholesale)*
$3.2B
Direct to Consumer**
$1B
Total
$4.2B
4
*Source: SGMA 2010 – Tracking the Fitness Movement Annual Report
**Source: TouchPoint Communications 2009 Media Survey and Nautilus internal
research |
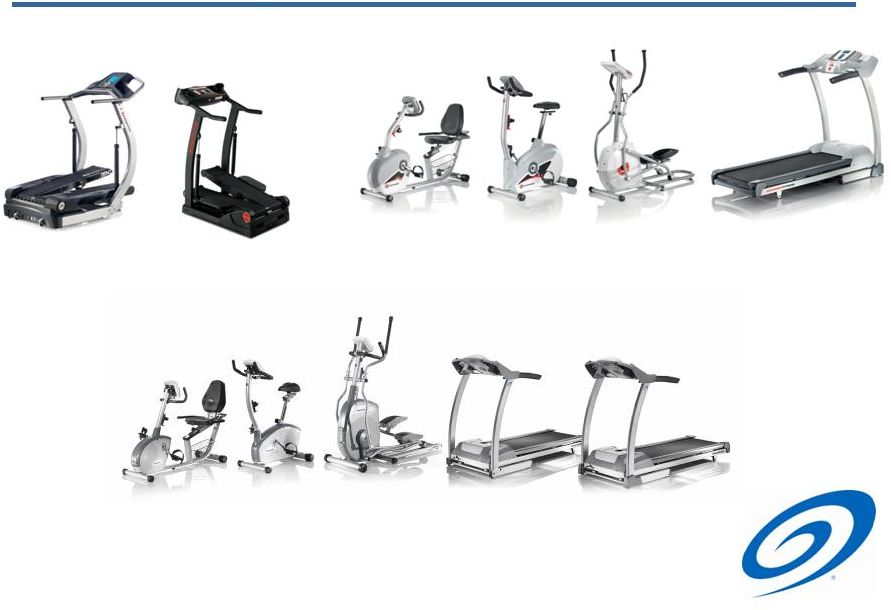 Nautilus Cardio
Product Lines TreadClimber
Schwinn
Fitness
Nautilus
5 |
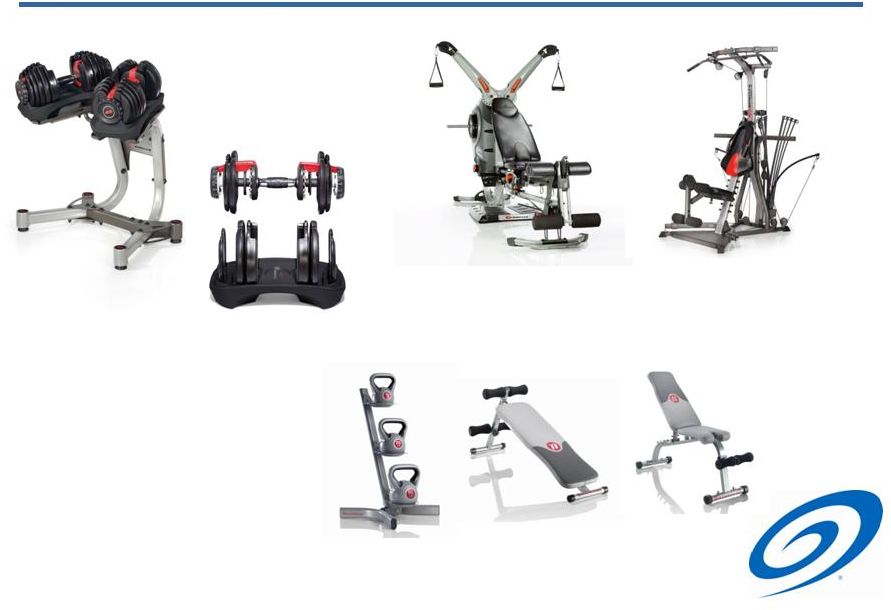 Nautilus Strength
Product Lines Bowflex
/ Nautilus
SelectTech
Dumbbells
Bowflex
Revolution and Rod Based
Home Gyms
Universal Strength Accessories
6 |
 Background to
Restructuring •
2008 recession severely affected all business lines
–
Retail consumer discretionary expenditures deferred
–
Direct consumer credit availability contracted
–
Commoditization of commercial health equipment market accelerated
•
Restructuring Plan
–
Radically reduced fixed operating expenses
–
Exited commercial equipment business
–
Refocused consumer business on the larger cardio equipment market
opportunity
–
Upgraded consumer finance program with a new, more aggressive, provider
7 |
 Brand
Strength Nautilus owns four of the premier brands in the fitness industry
8 |
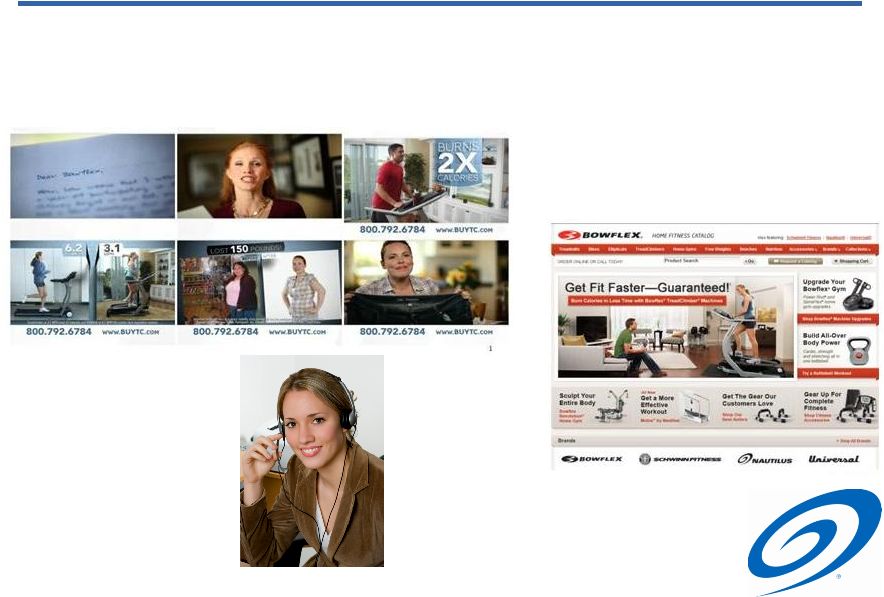 Consumer Reach
- Direct
•
Direct to Consumer
–
Our direct to consumer business utilizes television and online advertising to drive sales via
our websites and within our internal call center
9 |
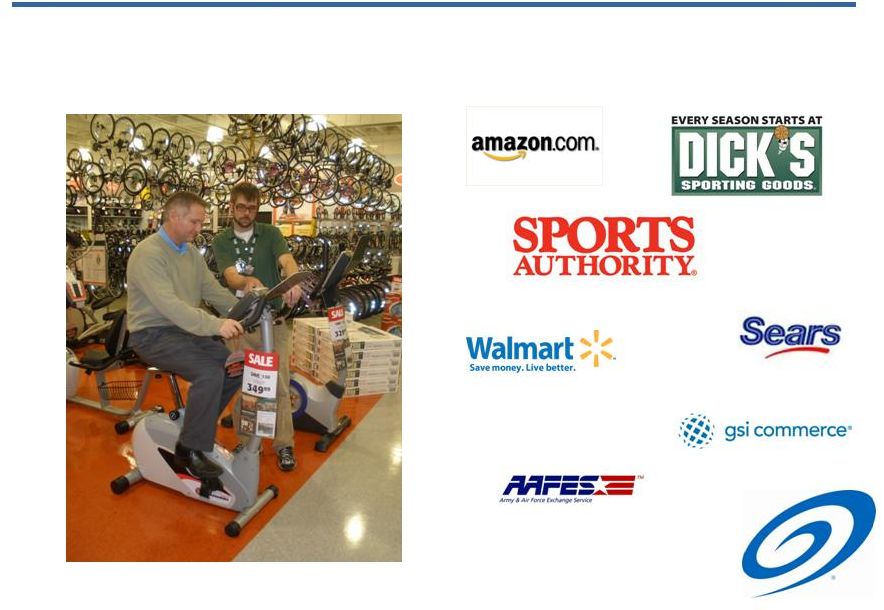 Consumer Reach
- Retail
•
Retail
–
Distributes products via multiple locations in the US and Canada, as well as through leading
e-commerce sites such as Amazon.com
10 |
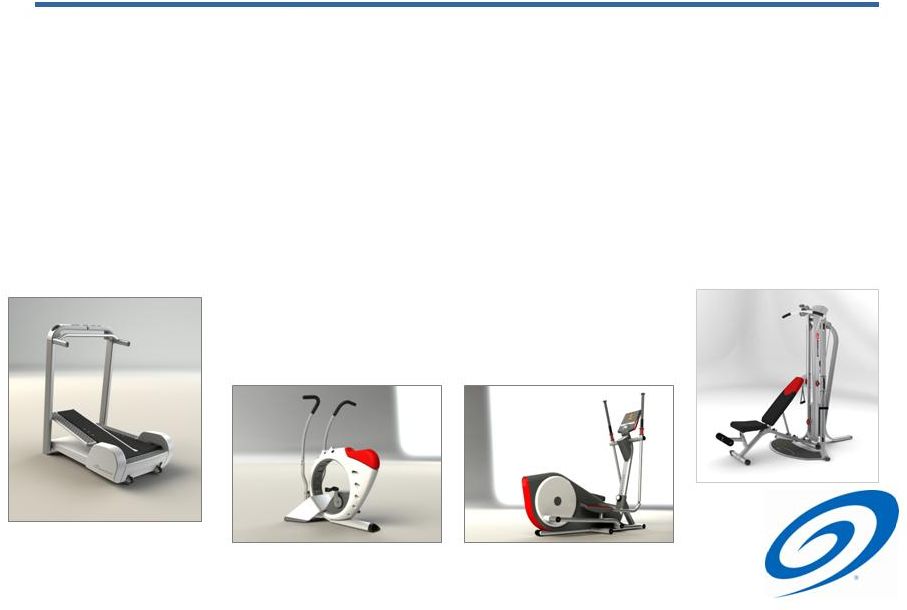 Innovation
•
Throughout our restructuring and cost cutting, Nautilus has continued to invest in
research and development
•
Key areas of focus for future products
–
Further
enhancements
to
proprietary
TreadClimber
cardio
machine
–
Low cost / single area targeted strength products featuring videos
–
New resistance mechanisms and consoles in exercise bikes
–
International market ready versions of products to allow for growth outside the
US and Canada
Product Concepts in
Development
11 |
 Near Term Cardio
Focus •
The most popular fitness activity in
the U.S. is walking
(110M participants)
*Source: SGMA 2010 -
Tracking the Fitness Movement
Yoga / Pilates
Stretching
26.5 Million
Home Gym
24.8 Million
Cardio:
Elliptical / Treadmill
77.9 Million
Walking for Fitness
110 Million
U.S. Fitness Participation (2010)*
Indoor Bike
34.8 Million
12 |
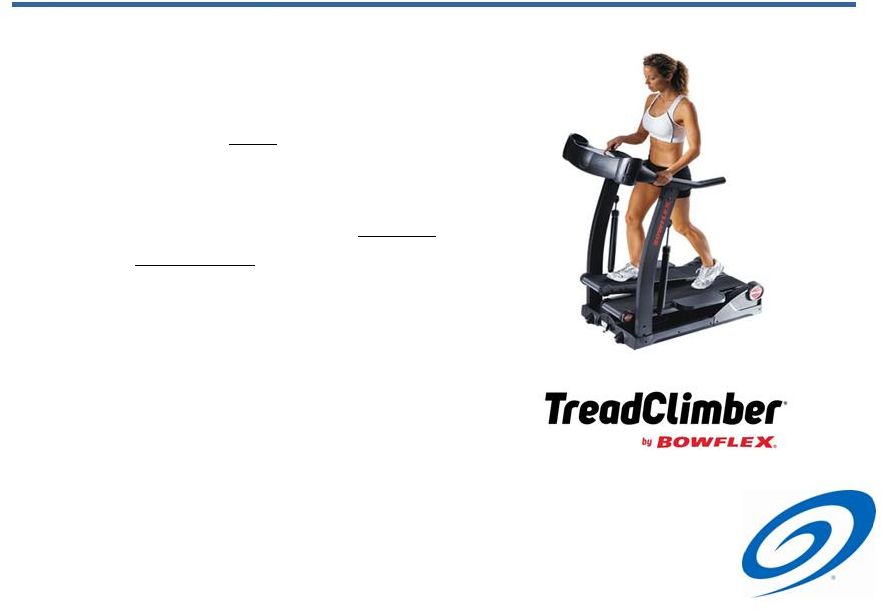 TreadClimber
•
Allows the user to walk
during use,
resulting in low impact to joints and
knees
•
Machine’s combined motion of walking
with the calorie burn
of running at
6mph*
•
Proprietary product
–
Significant patent protection
13
*Source: Independent research at Adelphi University and University of Wisconsin -
LaCrosse |
 TreadClimber
in the Direct Channel
•
Television and Online Media Target High Value Consumers
–
Creative and network placement allow for tailoring the product message to a
specific audience
–
Improved buyer demographics
–
TreadClimber
product line appeals an incremental customer base of the long
standing home gym product line:
•
High Operating Leverage
–
Relatively high gross margins
•
Low Capital Requirements for Growth
–
Negative working capital model
Age Profile
18-24
25-34
35-44
45-54
55+
Rod Based Gym
15%
24%
27%
22%
12%
TreadClimber
4%
14%
26%
35%
18%
14 |
 Operating
Statistics •
Selected data from continuing operations
–
Lower fixed operating expenses
–
Retail sales level stabilizing and showing signs of improvement
–
Direct sales benefited from new consumer financing programs implemented in
September 2010
–
Adjusted Operating Loss is a non-GAAP measure. Management believes that
showing operating loss net of restructuring expenses and asset impairment losses
enables more meaningful comparisons of operating results among periods
* Preliminary and unaudited
2009
2010
($ millions)
Q1
Q2
Q3
Q4
Q1
Q2
Q3
Q4*
Retail
$ 12.5
$ 11.4
$ 15.7
$ 24.0
$ 15.9
$ 11.8
$ 16.1
$ 23.9
% growth
(50.3%)
(39.8%)
(33.8%)
(9.4%)
27.0%
4.1%
2.9%
(0.4%)
Direct
40.7
28.2
25.3
28.9
28.5
18.4
21.5
28.2
% growth
(41.5%)
(31.7%)
(34.5%)
(19.9%)
(30.0%)
(34.6%)
(14.8%)
(2.4%)
Corporate
0.9
0.5
0.4
0.8
1.2
0.4
0.9
1.4
Total Revenue
$ 54.1
$ 40.1
$ 41.4
$ 53.7
$ 45.6
$ 30.6
$ 38.5
$53.5
% growth
(42.9%)
(33.5%)
(33.7%)
(14.1%)
(15.6%)
(23.6%)
(7.2%)
(0.3%)
Gross Profit
$ 30.3
$ 19.8
$ 20.3
$ 26.1
$ 23.0
$ 13.5
$ 16.6
as a % of revenue
56.0%
49.4%
49.0%
48.6%
50.4%
44.1%
43.1%
Operating Expenses
34.0
34.7
23.1
33.9
24.9
20.2
19.8
Operating Loss
(3.7)
(14.9)
(2.8)
(7.7)
(1.9)
(6.8)
(3.2)
Adjustments:
Restructuring Expenses
2.0
11.8
0.2
0.1
-
-
-
Asset Impairment Losses
-
-
2.1
3.8
-
-
-
Adjusted Operating Loss *
$ (1.7)
$ (3.1)
$ (0.5)
$ (3.8)
$ (1.9)
$ (6.8)
$ (3.2)
as a % of revenue
(3.1%)
(7.7%)
(1.2%)
(7.1%)
(4.2%)
(22.2%)
(8.3%)
15 |
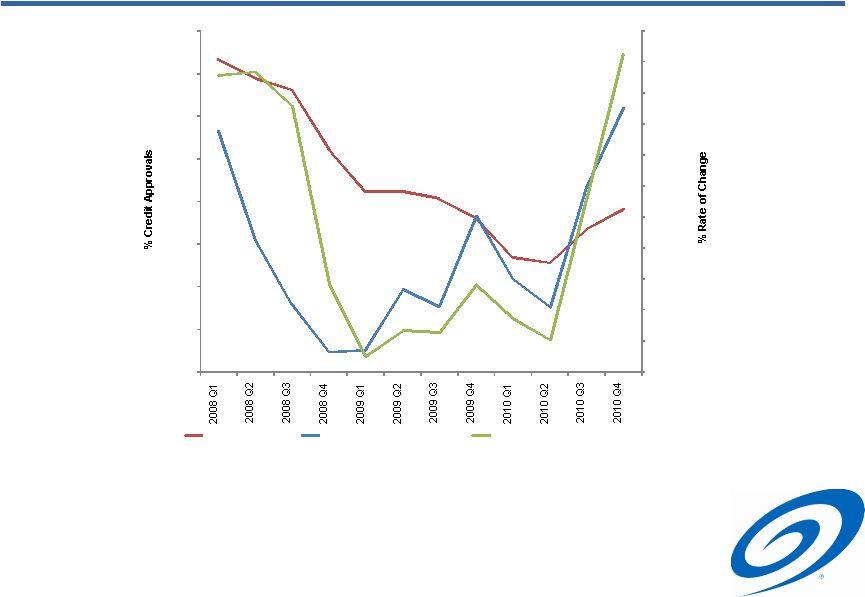 Rate of Change:
Direct Sales versus Credit Approvals •
Strong correlation between financing availability and Direct-to-Consumer sales
16
(45.0%)
(40.0%)
(35.0%)
(30.0%)
(25.0%)
(20.0%)
(15.0%)
(10.0%)
(5.0%)
-
5.0%
10.0%
-
5.0%
10.0%
15.0%
20.0%
25.0%
30.0%
35.0%
40.0%
Credit Approvals
Revenue % Rate of Change
Credit Approvals % Rate of Change |
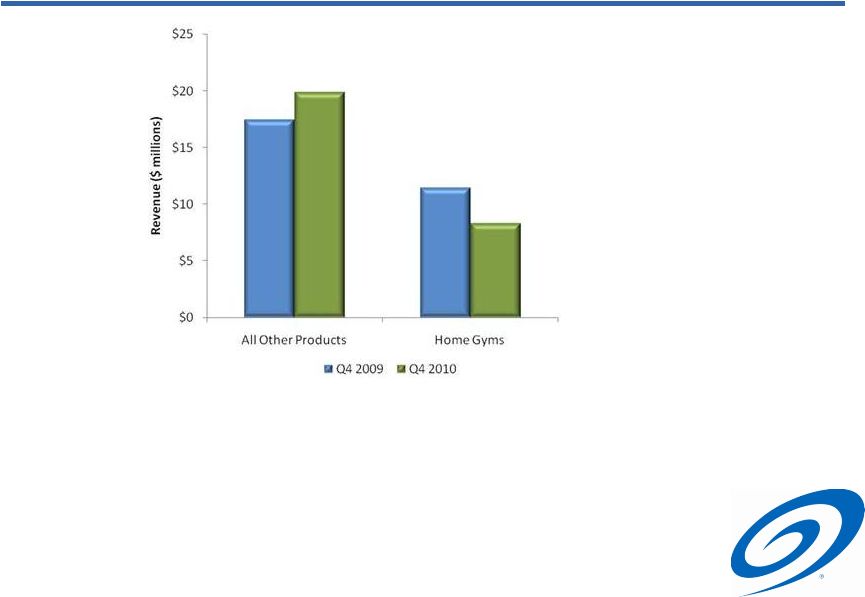 Results of Cardio
Strategy – Direct
•
Q4
2010
Cardio
year-over-year
growth
rate
of
14%
•
Home
Gyms
sales
declined
27%
year-over-year
–
Declining proportion of sales mix
•
Credit approval rate trend is improving for Cardio products
–
Will begin to compare favorably to prior year in 2011
–
Q4 growth achieved with lower than prior year approval rate in cardio
–
Opportunity to increase advertising to increase sales
* Q4 2010 Preliminary and unaudited
17 |
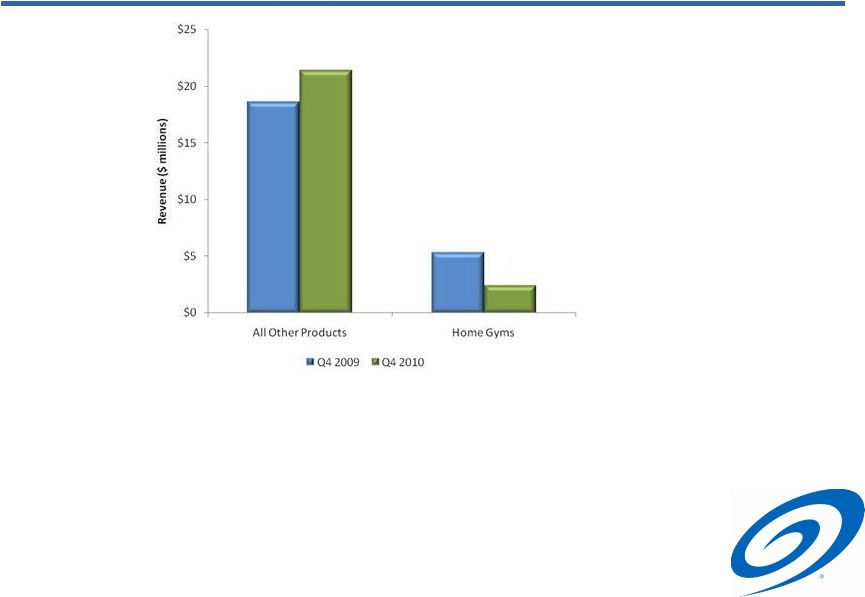 Results of Cardio
Strategy – Retail
•
Q4 2010 Cardio year-over-year growth rate of 15%
–
Excellent performance in stationary bikes
•
Home Gyms sales declined 54% year-over-year
–
Sales level becoming immaterial
* Q4 2010 Preliminary and unaudited
18 |
 Balance Sheet
Strength •
Improved balance sheet strength during economic downturn
–
Focus on liquidity results in adequate balance sheet strength
–
Permits self-financing in seasonally high working capital quarter (September)
•
Working capital performance has improved
–
Exit from Commercial business significantly reduced working capital investment
A/R
Inventory
DSO
Turnover
December 2007
54 days
4.9x
December 2008
53 days
3.8x
December 2009
47 days
6.8x
September 2010
29 days
6.5x
19
Net Cash/
Gross
($ millions)
(Debt)
Cash
Actual December 2007
(71)
$
8
$
Less: Acquisition commitment
(69)
-
Pro Forma December 2007
(140)
$
8
$
Actual December 2008
(12)
$
6
$
Actual December 2009
7
$
7
$
Actual September 2010
9
$
14
$ |
 Summary
•
Four highly regarded brand names
•
Participation in the larger cardio equipment market improving
•
Capability to reach end consumers with branded products across multiple
distribution channels
•
Restructuring in response to recession has significantly reduced
breakeven level
•
Balance sheet stronger than pre-recession level
–
Cash of $14.5 million with no pending debt maturities
•
Improving market and credit approvals outlook
•
Direct model allows for growth with little to no additional capital required
20 |
 |