Attached files
| file | filename |
|---|---|
| 8-K - 8-K - BRUKER CORP | a11-3517_18k.htm |
Exhibit 99.1
|
|
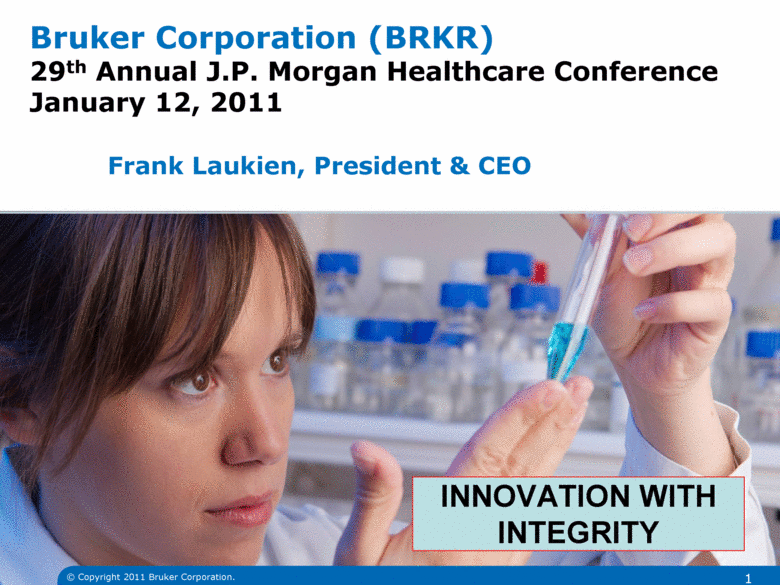
Bruker Board Meeting, Nov. 2, 2010 Bruker Strategy Update by Frank Laukien, Brian Monahan, Bill Knight Strictly BRKR Board Confidential (draft v2.5 10/30) 1 INNOVATION WITH INTEGRITY Bruker Corporation (BRKR) 29th Annual J.P. Morgan Healthcare Conference January 12, 2011 Frank Laukien, President & CEO © Copyright 2011 Bruker Corporation. |
|
|
Bruker Corporation Safe Harbor Statement Any statements contained in this presentation that do not describe historical facts may constitute forward-looking statements as that term is defined in the Private Securities Litigation Reform Act of 1995. Any forward-looking statements contained herein are based on current expectations, but are subject to risks and uncertainties that could cause actual results to differ materially from those projected, including, but not limited to, risks and uncertainties relating to adverse changes in conditions in the global economy and volatility in the capital markets, the integration of businesses we have acquired or may acquire in the future, changing technologies, product development and market acceptance of our products, the cost and pricing of our products, manufacturing, competition, dependence on collaborative partners and key suppliers, capital spending and government funding policies, changes in governmental regulations, realization of anticipated benefits from economic stimulus programs, intellectual property rights, litigation, and exposure to foreign currency fluctuations and other risk factors discussed from time to time in our filings with the Securities and Exchange Commission. These and other factors are identified and described in more detail in our filings with the SEC, including, without limitation, our annual report on Form 10-K for the year ended December 31, 2009, our most recent quarterly reports on Form 10-Q and our current reports on Form 8-K. We expressly disclaim any intent or obligation to update these forward-looking statements other than as required by law. INNOVATION WITH INTEGRITY |
|
|
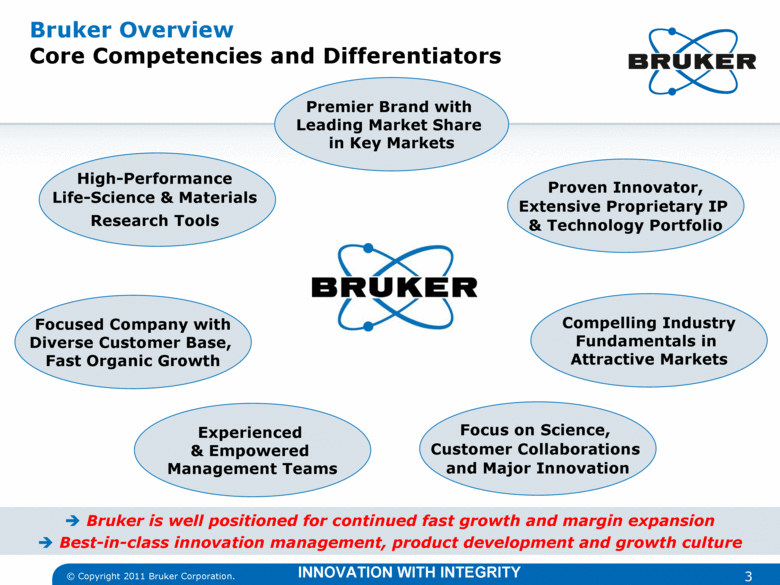
Premier Brand with Leading Market Share in Key Markets High-Performance Life-Science & Materials Research Tools Focused Company with Diverse Customer Base, Fast Organic Growth Experienced & Empowered Management Teams Focus on Science, Customer Collaborations and Major Innovation Proven Innovator, Extensive Proprietary IP & Technology Portfolio Compelling Industry Fundamentals in Attractive Markets Bruker is well positioned for continued fast growth and margin expansion Best-in-class innovation management, product development and growth culture Bruker Overview Core Competencies and Differentiators INNOVATION WITH INTEGRITY |
|
|
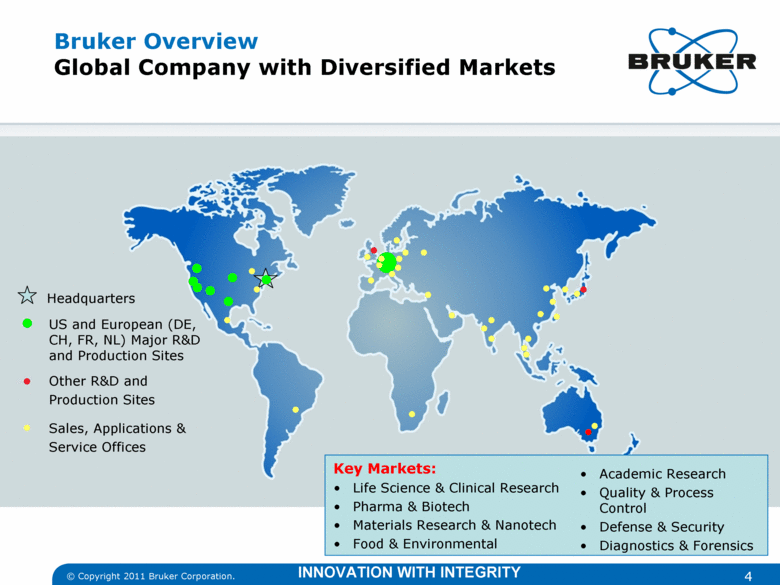
Bruker Overview Global Company with Diversified Markets Other R&D and Production Sites Sales, Applications & Service Offices US and European (DE, CH, FR, NL) Major R&D and Production Sites Headquarters Key Markets: Life Science & Clinical Research Pharma & Biotech Materials Research & Nanotech Food & Environmental Academic Research Quality & Process Control Defense & Security Diagnostics & Forensics INNOVATION WITH INTEGRITY |
|
|
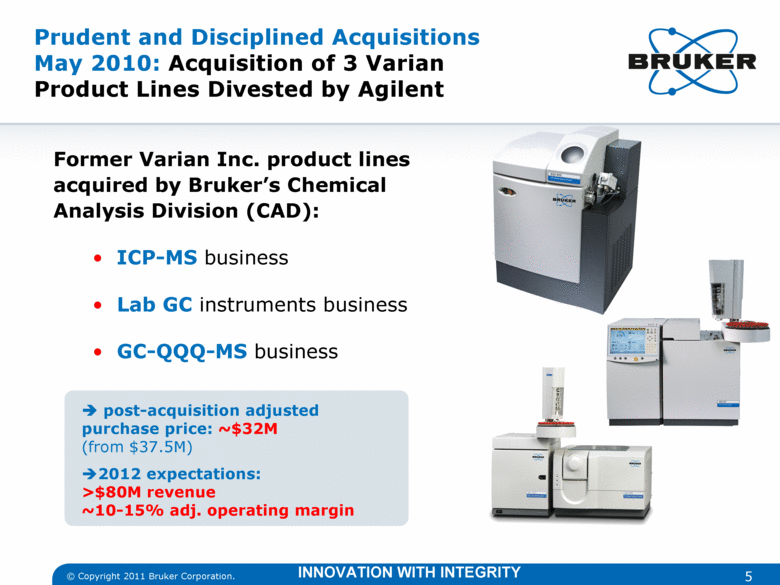
Prudent and Disciplined Acquisitions May 2010: Acquisition of 3 Varian Product Lines Divested by Agilent Former Varian Inc. product lines acquired by Bruker’s Chemical Analysis Division (CAD): ICP-MS business Lab GC instruments business GC-QQQ-MS business post-acquisition adjusted purchase price: ~$32M (from $37.5M) 2012 expectations: >$80M revenue ~10-15% adj. operating margin INNOVATION WITH INTEGRITY |
|
|
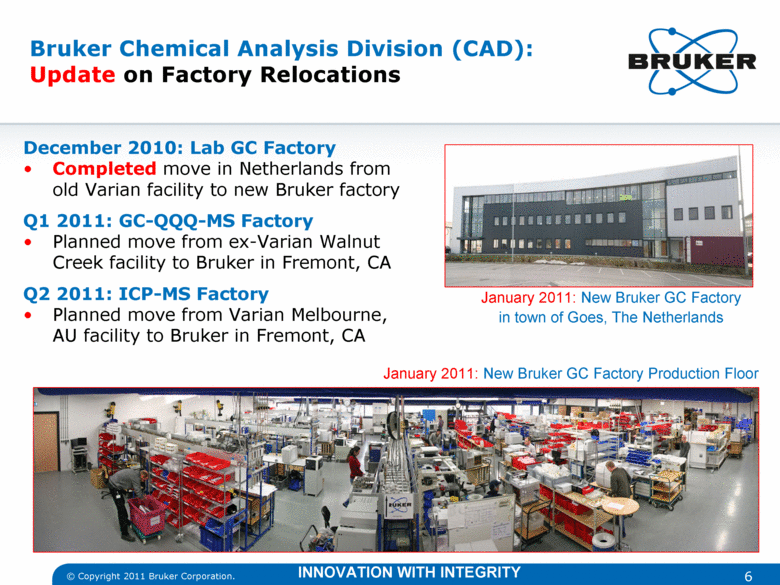
Bruker Chemical Analysis Division (CAD): Update on Factory Relocations December 2010: Lab GC Factory Completed move in Netherlands from old Varian facility to new Bruker factory Q1 2011: GC-QQQ-MS Factory Planned move from ex-Varian Walnut Creek facility to Bruker in Fremont, CA Q2 2011: ICP-MS Factory Planned move from Varian Melbourne, AU facility to Bruker in Fremont, CA INNOVATION WITH INTEGRITY January 2011: New Bruker GC Factory in town of Goes, The Netherlands January 2011: New Bruker GC Factory Production Floor |
|
|
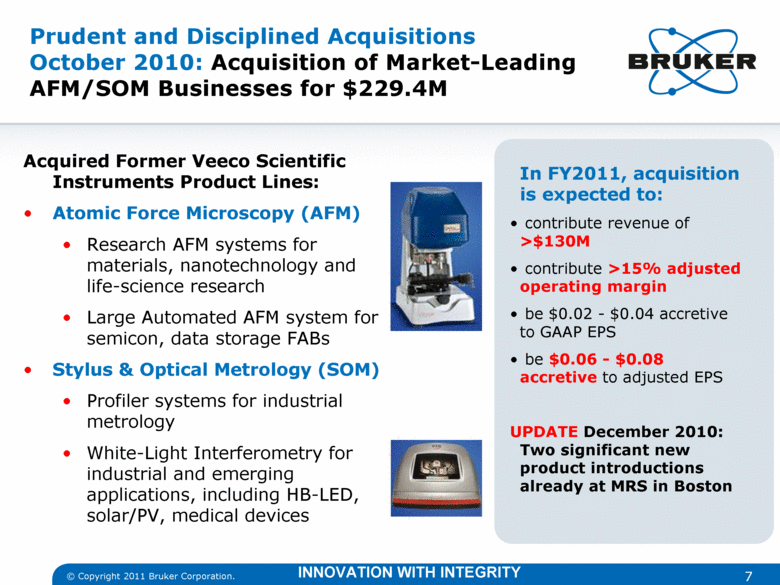
Prudent and Disciplined Acquisitions October 2010: Acquisition of Market-Leading AFM/SOM Businesses for $229.4M Acquired Former Veeco Scientific Instruments Product Lines: Atomic Force Microscopy (AFM) Research AFM systems for materials, nanotechnology and life-science research Large Automated AFM system for semicon, data storage FABs Stylus & Optical Metrology (SOM) Profiler systems for industrial metrology White-Light Interferometry for industrial and emerging applications, including HB-LED, solar/PV, medical devices In FY2011, acquisition is expected to: contribute revenue of >$130M contribute >15% adjusted operating margin be $0.02 - $0.04 accretive to GAAP EPS be $0.06 - $0.08 accretive to adjusted EPS UPDATE December 2010: Two significant new product introductions already at MRS in Boston INNOVATION WITH INTEGRITY |
|
|
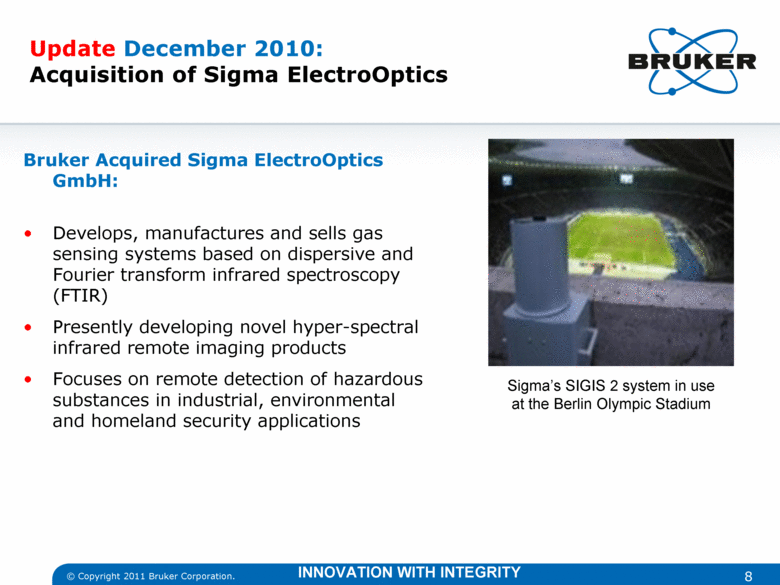
Update December 2010: Acquisition of Sigma ElectroOptics Bruker Acquired Sigma ElectroOptics GmbH: Develops, manufactures and sells gas sensing systems based on dispersive and Fourier transform infrared spectroscopy (FTIR) Presently developing novel hyper-spectral infrared remote imaging products Focuses on remote detection of hazardous substances in industrial, environmental and homeland security applications INNOVATION WITH INTEGRITY Sigma’s SIGIS 2 system in use at the Berlin Olympic Stadium |
|
|
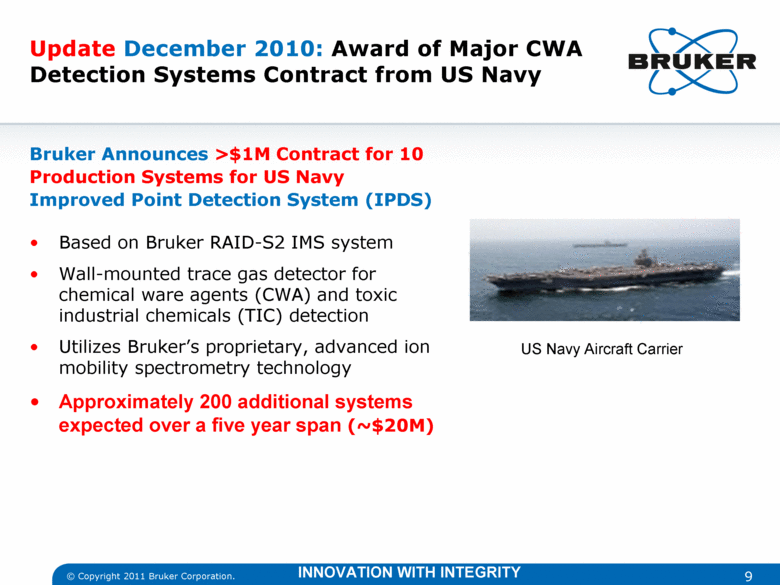
Update December 2010: Award of Major CWA Detection Systems Contract from US Navy Bruker Announces >$1M Contract for 10 Production Systems for US Navy Improved Point Detection System (IPDS) Based on Bruker RAID-S2 IMS system Wall-mounted trace gas detector for chemical ware agents (CWA) and toxic industrial chemicals (TIC) detection Utilizes Bruker’s proprietary, advanced ion mobility spectrometry technology Approximately 200 additional systems expected over a five year span (~$20M) INNOVATION WITH INTEGRITY US Navy Aircraft Carrier |
|
|
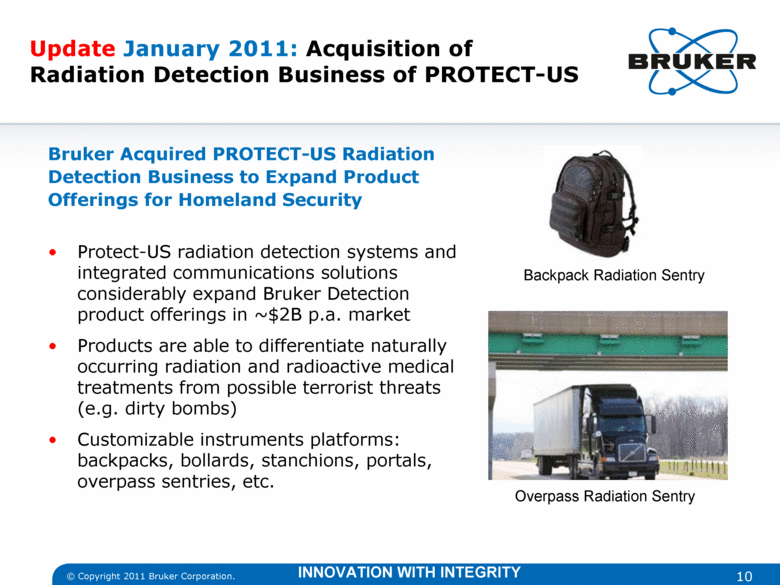
Update January 2011: Acquisition of Radiation Detection Business of PROTECT-US Bruker Acquired PROTECT-US Radiation Detection Business to Expand Product Offerings for Homeland Security Protect-US radiation detection systems and integrated communications solutions considerably expand Bruker Detection product offerings in ~$2B p.a. market Products are able to differentiate naturally occurring radiation and radioactive medical treatments from possible terrorist threats (e.g. dirty bombs) Customizable instruments platforms: backpacks, bollards, stanchions, portals, overpass sentries, etc. INNOVATION WITH INTEGRITY Backpack Radiation Sentry Overpass Radiation Sentry |
|
|
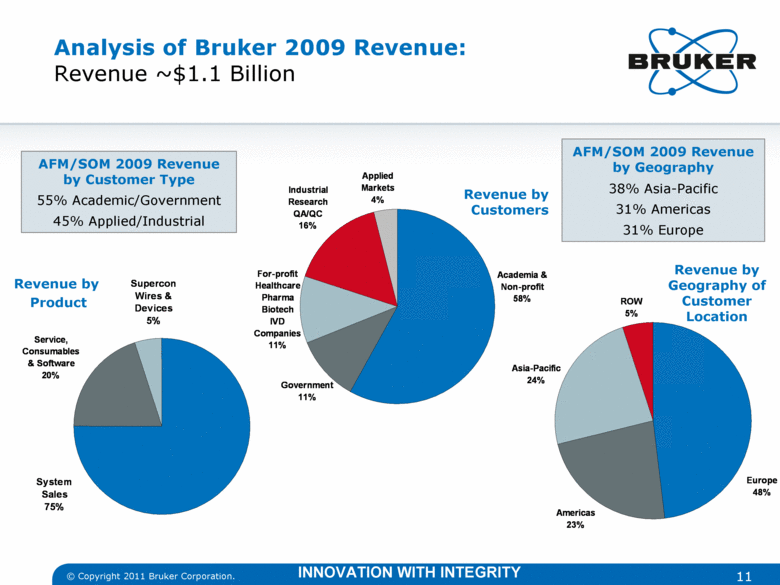
Analysis of Bruker 2009 Revenue: Revenue ~$1.1 Billion Revenue by Customers Revenue by Geography of Customer Location Revenue by Product AFM/SOM 2009 Revenue by Geography 38% Asia-Pacific 31% Americas 31% Europe AFM/SOM 2009 Revenue by Customer Type 55% Academic/Government 45% Applied/Industrial INNOVATION WITH INTEGRITY System Sales 75% Service, Consumables & Software 20% Supercon Wires & Devices 5% Americas 23% ROW 5% Europe 48% Asia-Pacific 24% Applied Markets 4% Academia & Non-profit 58% Government 11% For-profit Healthcare Pharma Biotech IVD Companies 11% Industrial Research QA/QC 16% |
|
|
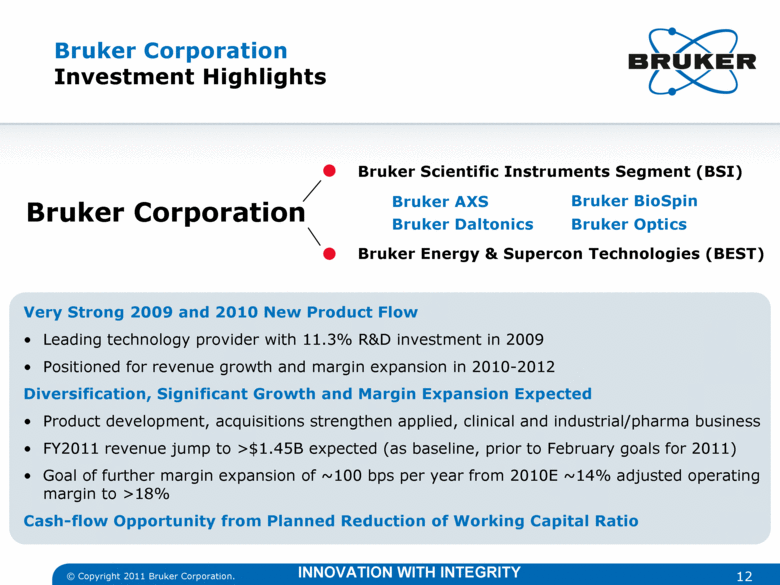
Bruker Corporation Bruker AXS Bruker Daltonics Bruker Scientific Instruments Segment (BSI) Bruker Energy & Supercon Technologies (BEST) Bruker BioSpin Bruker Optics Very Strong 2009 and 2010 New Product Flow Leading technology provider with 11.3% R&D investment in 2009 Positioned for revenue growth and margin expansion in 2010-2012 Diversification, Significant Growth and Margin Expansion Expected Product development, acquisitions strengthen applied, clinical and industrial/pharma business FY2011 revenue jump to >$1.45B expected (as baseline, prior to February goals for 2011) Goal of further margin expansion of ~100 bps per year from 2010E ~14% adjusted operating margin to >18% Cash-flow Opportunity from Planned Reduction of Working Capital Ratio Bruker Corporation Investment Highlights INNOVATION WITH INTEGRITY |
|
|
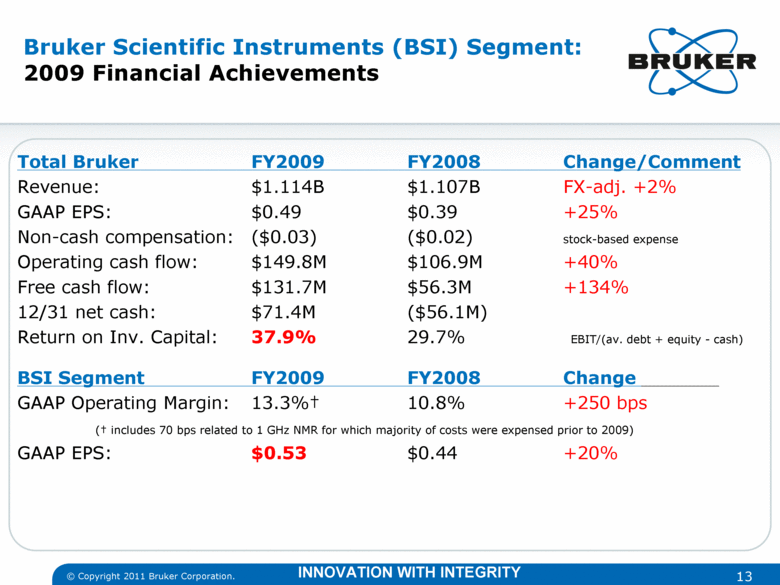
Bruker Scientific Instruments (BSI) Segment: 2009 Financial Achievements Total Bruker FY2009 FY2008 Change/Comment Revenue: $1.114B $1.107B FX-adj. +2% GAAP EPS: $0.49 $0.39 +25% Non-cash compensation: ($0.03) ($0.02) stock-based expense Operating cash flow: $149.8M $106.9M +40% Free cash flow: $131.7M $56.3M +134% 12/31 net cash: $71.4M ($56.1M) Return on Inv. Capital: 37.9% 29.7% EBIT/(av. debt + equity - cash) BSI Segment FY2009 FY2008 Change GAAP Operating Margin: 13.3%† 10.8% +250 bps († includes 70 bps related to 1 GHz NMR for which majority of costs were expensed prior to 2009) GAAP EPS: $0.53 $0.44 +20% INNOVATION WITH INTEGRITY |
|
|
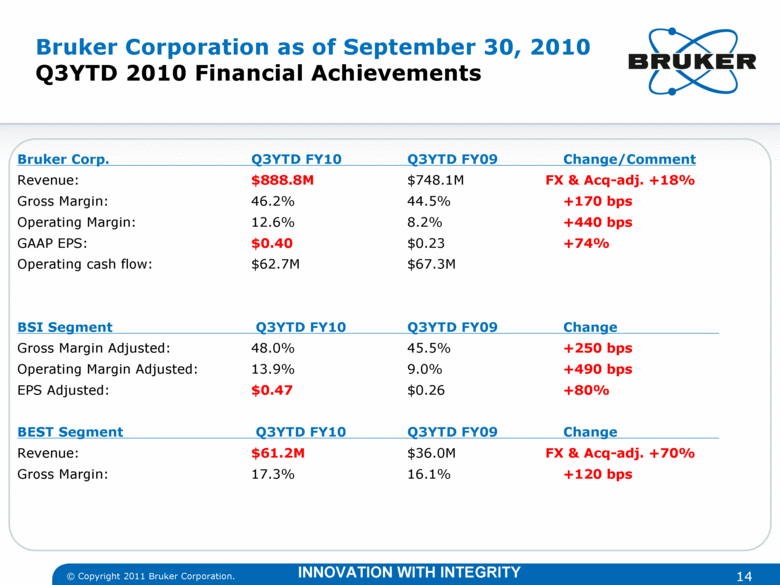
Bruker Corporation as of September 30, 2010 Q3YTD 2010 Financial Achievements Bruker Corp. Q3YTD FY10 Q3YTD FY09 Change/Comment Revenue: $888.8M $748.1M FX & Acq-adj. +18% Gross Margin: 46.2% 44.5% +170 bps Operating Margin: 12.6% 8.2% +440 bps GAAP EPS: $0.40 $0.23 +74% Operating cash flow: $62.7M $67.3M BSI Segment Q3YTD FY10 Q3YTD FY09 Change Gross Margin Adjusted: 48.0% 45.5% +250 bps Operating Margin Adjusted: 13.9% 9.0% +490 bps EPS Adjusted: $0.47 $0.26 +80% BEST Segment Q3YTD FY10 Q3YTD FY09 Change Revenue: $61.2M $36.0M FX & Acq-adj. +70% Gross Margin: 17.3% 16.1% +120 bps INNOVATION WITH INTEGRITY |
|
|
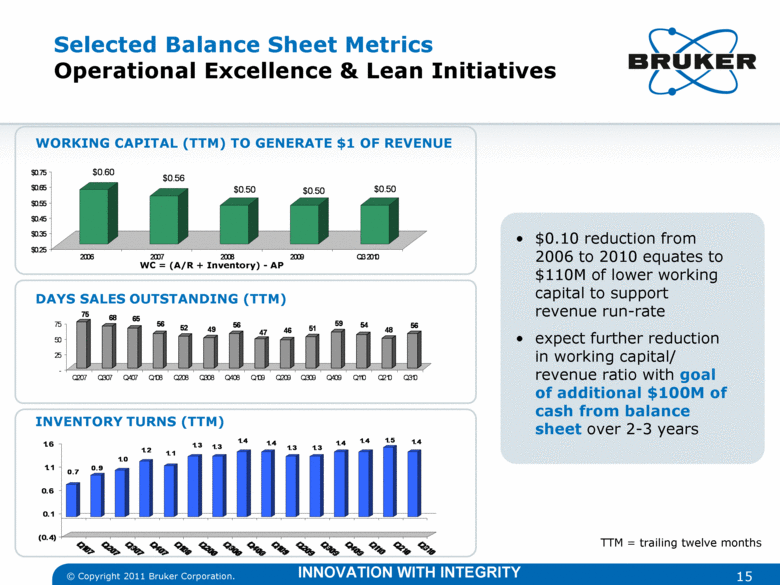
Selected Balance Sheet Metrics Operational Excellence & Lean Initiatives WC = (A/R + Inventory) - AP DAYS SALES OUTSTANDING (TTM) INVENTORY TURNS (TTM) WORKING CAPITAL (TTM) TO GENERATE $1 OF REVENUE $0.10 reduction from 2006 to 2010 equates to $110M of lower working capital to support revenue run-rate expect further reduction in working capital/ revenue ratio with goal of additional $100M of cash from balance sheet over 2-3 years TTM = trailing twelve months INNOVATION WITH INTEGRITY 0.7 0.9 1.0 1.2 1.1 1.3 1.3 1.4 1.4 1.3 1.3 1.4 1.4 1.5 1.4 (0.4) 0.1 0.6 1.1 1.6 75 68 65 56 52 49 56 47 46 51 59 54 48 56 - 25 50 75 Q207 Q307 Q407 Q108 Q208 Q308 Q408 Q109 Q209 Q309 Q409 Q110 Q210 Q310 $0.60 $0.56 $0.50 $0.50 $0.50 $0.25 $0.35 $0.45 $0.55 $0.65 $0.75 2006 2007 2008 2009 Q3 2010 |
|
|
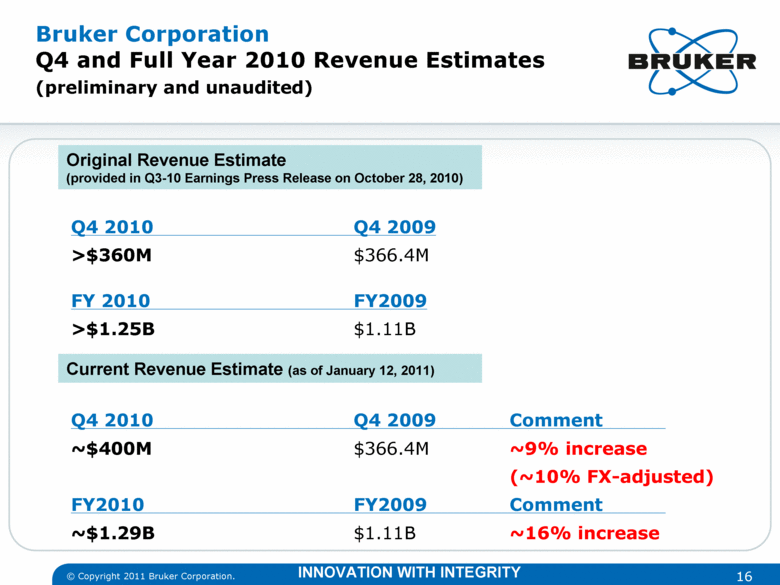
Bruker Corporation Q4 and Full Year 2010 Revenue Estimates (preliminary and unaudited) Q4 2010 Q4 2009 >$360M $366.4M FY 2010 FY2009 >$1.25B $1.11B Q4 2010 Q4 2009 Comment ~$400M $366.4M ~9% increase (~10% FX-adjusted) FY2010 FY2009 Comment ~$1.29B $1.11B ~16% increase INNOVATION WITH INTEGRITY Current Revenue Estimate (as of January 12, 2011) Original Revenue Estimate (provided in Q3-10 Earnings Press Release on October 28, 2010) |
|
|
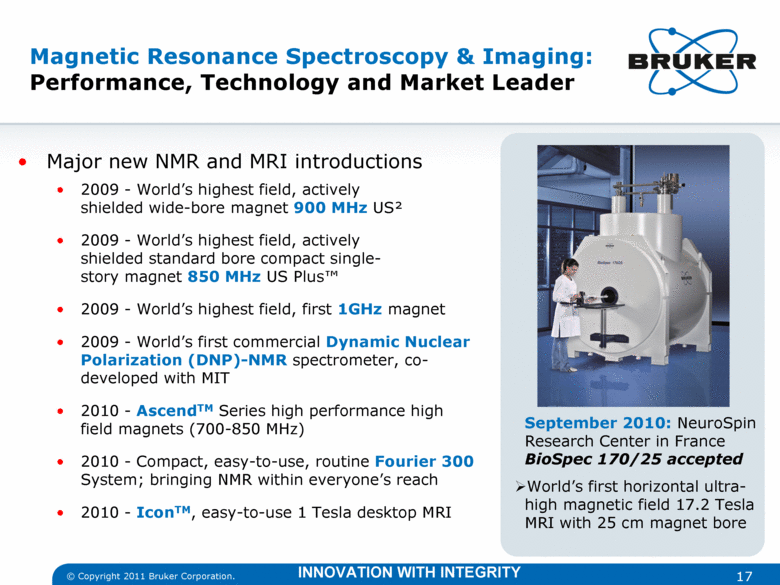
Magnetic Resonance Spectroscopy & Imaging: Performance, Technology and Market Leader Major new NMR and MRI introductions 2009 - World’s highest field, actively shielded wide-bore magnet 900 MHz US² 2009 - World’s highest field, actively shielded standard bore compact single-story magnet 850 MHz US Plus™ 2009 - World’s highest field, first 1GHz magnet 2009 - World’s first commercial Dynamic Nuclear Polarization (DNP)-NMR spectrometer, co-developed with MIT 2010 - AscendTM Series high performance high field magnets (700-850 MHz) 2010 - Compact, easy-to-use, routine Fourier 300 System; bringing NMR within everyone’s reach 2010 - IconTM, easy-to-use 1 Tesla desktop MRI September 2010: NeuroSpin Research Center in France BioSpec 170/25 accepted World’s first horizontal ultra-high magnetic field 17.2 Tesla MRI with 25 cm magnet bore INNOVATION WITH INTEGRITY |
|
|
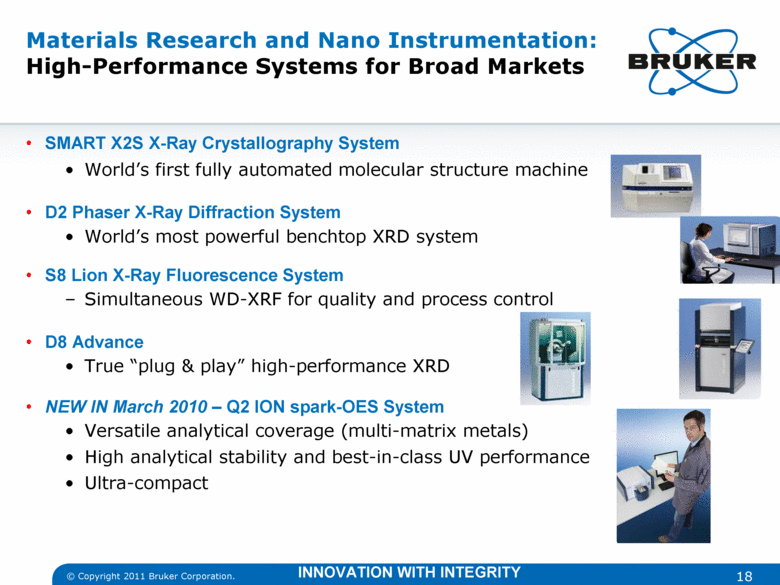
Materials Research and Nano Instrumentation: High-Performance Systems for Broad Markets SMART X2S X-Ray Crystallography System World’s first fully automated molecular structure machine D2 Phaser X-Ray Diffraction System World’s most powerful benchtop XRD system S8 Lion X-Ray Fluorescence System Simultaneous WD-XRF for quality and process control D8 Advance True “plug & play” high-performance XRD NEW IN March 2010 – Q2 ION spark-OES System Versatile analytical coverage (multi-matrix metals) High analytical stability and best-in-class UV performance Ultra-compact INNOVATION WITH INTEGRITY |
|
|
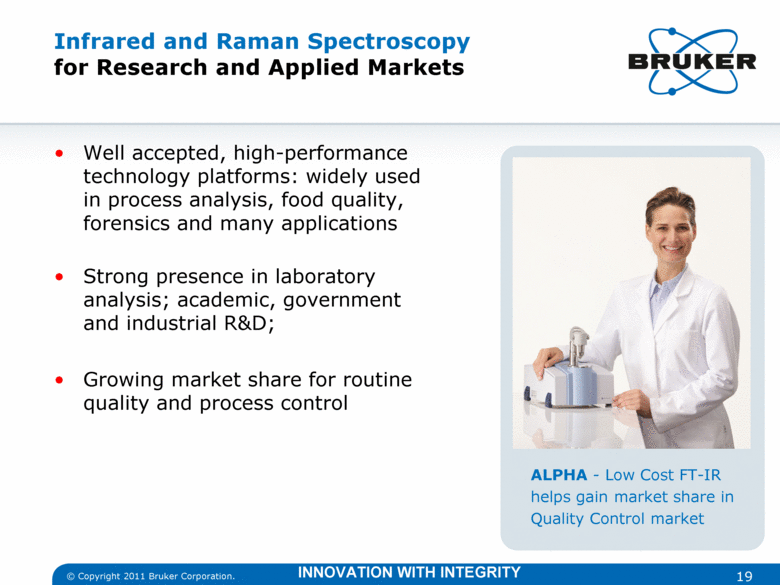
Infrared and Raman Spectroscopy for Research and Applied Markets Well accepted, high-performance technology platforms: widely used in process analysis, food quality, forensics and many applications Strong presence in laboratory analysis; academic, government and industrial R&D; Growing market share for routine quality and process control ALPHA - Low Cost FT-IR helps gain market share in Quality Control market INNOVATION WITH INTEGRITY |
|
|
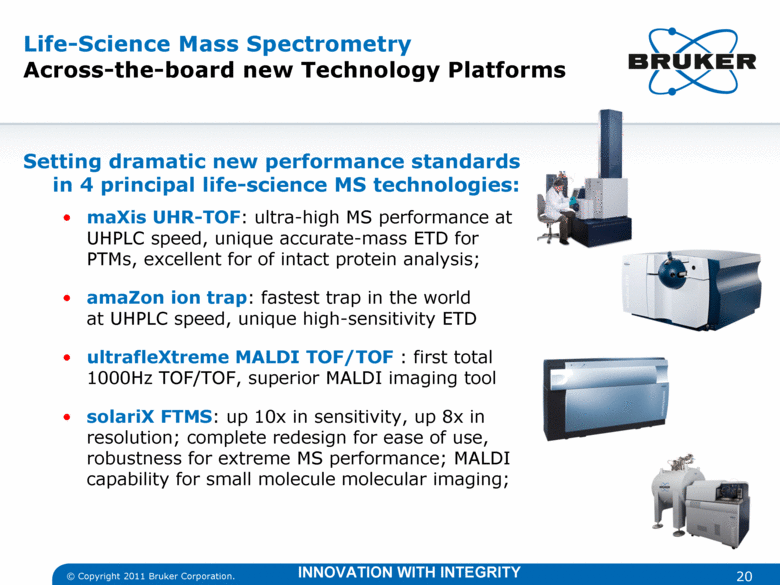
Life-Science Mass Spectrometry Across-the-board new Technology Platforms Setting dramatic new performance standards in 4 principal life-science MS technologies: maXis UHR-TOF: ultra-high MS performance at UHPLC speed, unique accurate-mass ETD for PTMs, excellent for of intact protein analysis; amaZon ion trap: fastest trap in the world at UHPLC speed, unique high-sensitivity ETD ultrafleXtreme MALDI TOF/TOF : first total 1000Hz TOF/TOF, superior MALDI imaging tool solariX FTMS: up 10x in sensitivity, up 8x in resolution; complete redesign for ease of use, robustness for extreme MS performance; MALDI capability for small molecule molecular imaging; INNOVATION WITH INTEGRITY |
|
|
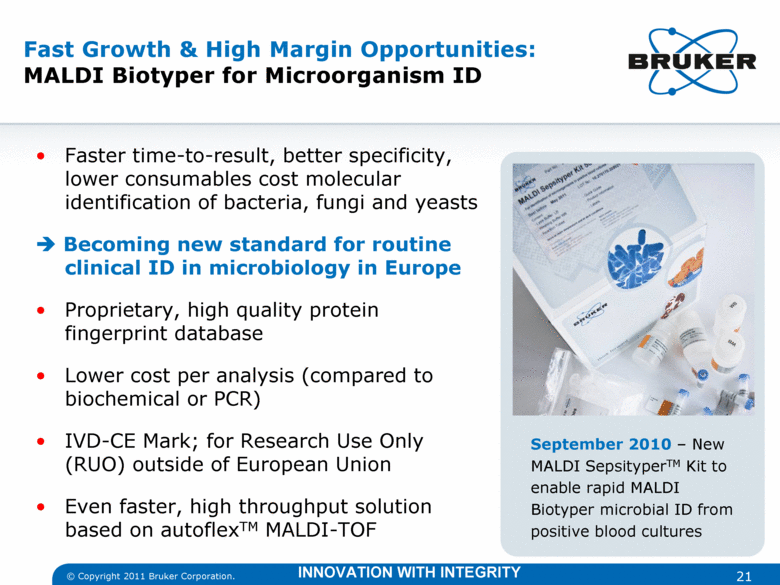
Fast Growth & High Margin Opportunities: MALDI Biotyper for Microorganism ID Faster time-to-result, better specificity, lower consumables cost molecular identification of bacteria, fungi and yeasts Becoming new standard for routine clinical ID in microbiology in Europe Proprietary, high quality protein fingerprint database Lower cost per analysis (compared to biochemical or PCR) IVD-CE Mark; for Research Use Only (RUO) outside of European Union Even faster, high throughput solution based on autoflexTM MALDI-TOF September 2010 – New MALDI SepsityperTM Kit to enable rapid MALDI Biotyper microbial ID from positive blood cultures INNOVATION WITH INTEGRITY |
|
|
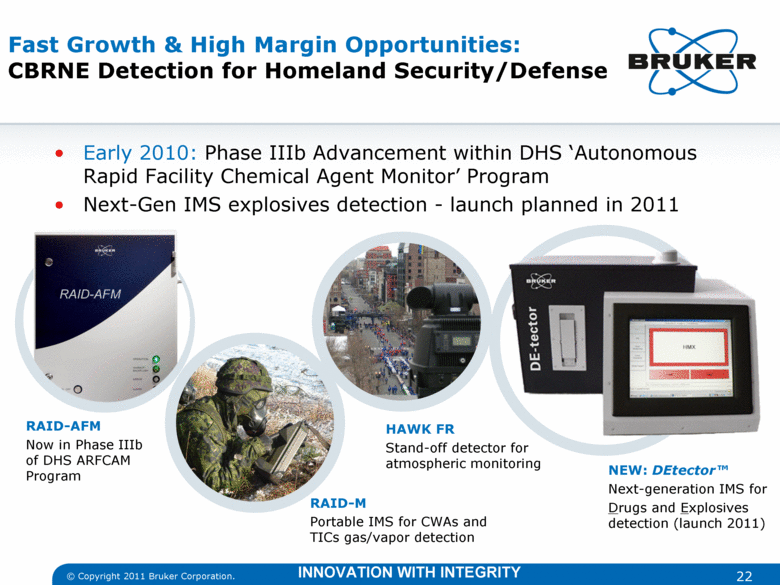
Fast Growth & High Margin Opportunities: CBRNE Detection for Homeland Security/Defense Early 2010: Phase IIIb Advancement within DHS ‘Autonomous Rapid Facility Chemical Agent Monitor’ Program Next-Gen IMS explosives detection - launch planned in 2011 NEW: DEtector™ Next-generation IMS for Drugs and Explosives detection (launch 2011) RAID-AFM Now in Phase IIIb of DHS ARFCAM Program RAID-M Portable IMS for CWAs and TICs gas/vapor detection HAWK FR Stand-off detector for atmospheric monitoring INNOVATION WITH INTEGRITY |
|
|
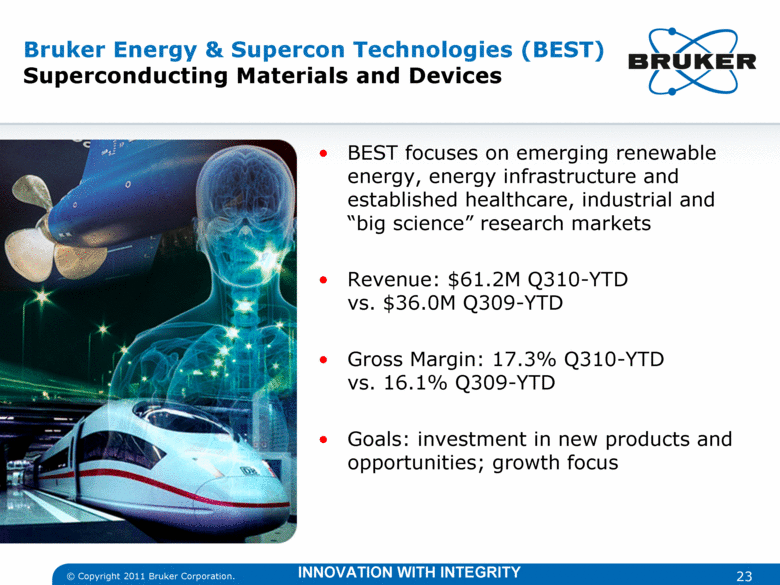
Bruker Energy & Supercon Technologies (BEST) Superconducting Materials and Devices BEST focuses on emerging renewable energy, energy infrastructure and established healthcare, industrial and “big science” research markets Revenue: $61.2M Q310-YTD vs. $36.0M Q309-YTD Gross Margin: 17.3% Q310-YTD vs. 16.1% Q309-YTD Goals: investment in new products and opportunities; growth focus INNOVATION WITH INTEGRITY |
|
|
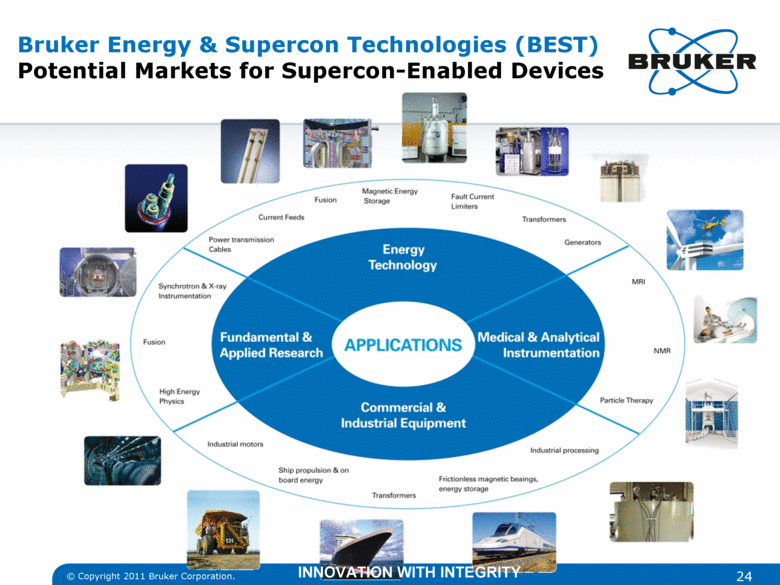
Bruker Energy & Supercon Technologies (BEST) Potential Markets for Supercon-Enabled Devices INNOVATION WITH INTEGRITY |
|
|
January 12, 2011 25 www.bruker.com © Copyright 2011 Bruker Corporation. INNOVATION WITH INTEGRITY |
|
|
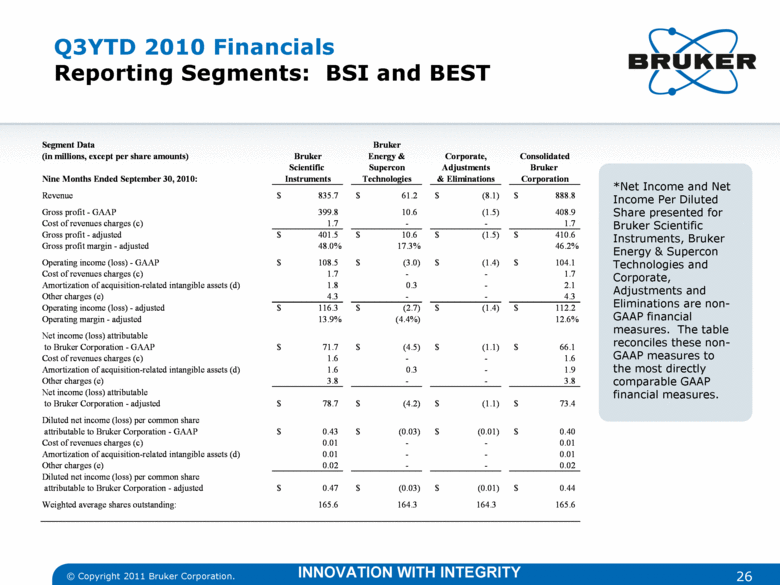
Q3YTD 2010 Financials Reporting Segments: BSI and BEST *Net Income and Net Income Per Diluted Share presented for Bruker Scientific Instruments, Bruker Energy & Supercon Technologies and Corporate, Adjustments and Eliminations are non-GAAP financial measures. The table reconciles these non-GAAP measures to the most directly comparable GAAP financial measures. INNOVATION WITH INTEGRITY Segment Data Bruker (in millions, except per share amounts) Bruker Energy & Corporate, Consolidated Scientific Supercon Adjustments Bruker Nine Months Ended September 30, 2010: Instruments Technologies & Eliminations Corporation Revenue 835.7 $ 61.2 $ (8.1) $ 888.8 $ Gross profit - GAAP 399.8 10.6 (1.5) 408.9 Cost of revenues charges (c) 1.7 - - 1.7 Gross profit - adjusted 401.5 $ 10.6 $ (1.5) $ 410.6 $ Gross profit margin - adjusted 48.0% 17.3% 46.2% Operating income (loss) - GAAP 108.5 $ (3.0) $ (1.4) $ 104.1 $ Cost of revenues charges (c) 1.7 - - 1.7 Amortization of acquisition-related intangible assets (d) 1.8 0.3 - 2.1 Other charges (e) 4.3 - - 4.3 Operating income (loss) - adjusted 116.3 $ (2.7) $ (1.4) $ 112.2 $ Operating margin - adjusted 13.9% (4.4%) 12.6% Net income (loss) attributable to Bruker Corporation - GAAP 71.7 $ (4.5) $ (1.1) $ 66.1 $ Cost of revenues charges (c) 1.6 - - 1.6 Amortization of acquisition-related intangible assets (d) 1.6 0.3 - 1.9 Other charges (e) 3.8 - - 3.8 Net income (loss) attributable to Bruker Corporation - adjusted 78.7 $ (4.2) $ (1.1) $ 73.4 $ Diluted net income (loss) per common share attributable to Bruker Corporation - GAAP 0.43 $ (0.03) $ (0.01) $ 0.40 $ Cost of revenues charges (c) 0.01 - - 0.01 Amortization of acquisition-related intangible assets (d) 0.01 - - 0.01 Other charges (e) 0.02 - - 0.02 Diluted net income (loss) per common share attributable to Bruker Corporation - adjusted 0.47 $ (0.03) $ (0.01) $ 0.44 $ Weighted average shares outstanding: 165.6 164.3 164.3 165.6 |
|
|
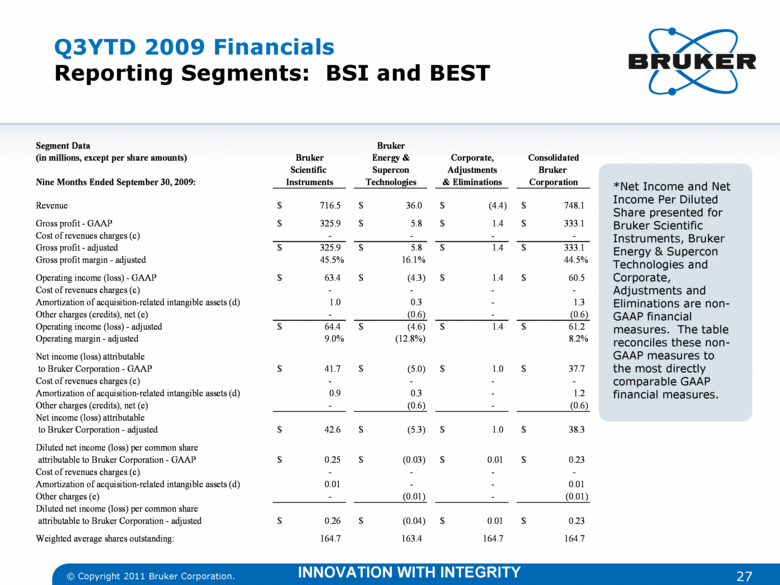
Q3YTD 2009 Financials Reporting Segments: BSI and BEST *Net Income and Net Income Per Diluted Share presented for Bruker Scientific Instruments, Bruker Energy & Supercon Technologies and Corporate, Adjustments and Eliminations are non-GAAP financial measures. The table reconciles these non-GAAP measures to the most directly comparable GAAP financial measures. INNOVATION WITH INTEGRITY Segment Data Bruker (in millions, except per share amounts) Bruker Energy & Corporate, Consolidated Scientific Supercon Adjustments Bruker Nine Months Ended September 30, 2009: Instruments Technologies & Eliminations Corporation Revenue 716.5 $ 36.0 $ (4.4) $ 748.1 $ Gross profit - GAAP 325.9 $ 5.8 $ 1.4 $ 333.1 $ Cost of revenues charges (c) - - - - Gross profit - adjusted 325.9 $ 5.8 $ 1.4 $ 333.1 $ Gross profit margin - adjusted 45.5% 16.1% 44.5% Operating income (loss) - GAAP 63.4 $ (4.3) $ 1.4 $ 60.5 $ Cost of revenues charges (c) - - - - Amortization of acquisition-related intangible assets (d) 1.0 0.3 - 1.3 Other charges (credits), net (e) - (0.6) - (0.6) Operating income (loss) - adjusted 64.4 $ (4.6) $ 1.4 $ 61.2 $ Operating margin - adjusted 9.0% (12.8%) 8.2% Net income (loss) attributable to Bruker Corporation - GAAP 41.7 $ (5.0) $ 1.0 $ 37.7 $ Cost of revenues charges (c) - - - - Amortization of acquisition-related intangible assets (d) 0.9 0.3 - 1.2 Other charges (credits), net (e) - (0.6) - (0.6) Net income (loss) attributable to Bruker Corporation - adjusted 42.6 $ (5.3) $ 1.0 $ 38.3 $ Diluted net income (loss) per common share attributable to Bruker Corporation - GAAP 0.25 $ (0.03) $ 0.01 $ 0.23 $ Cost of revenues charges (c) - - - - Amortization of acquisition-related intangible assets (d) 0.01 - - 0.01 Other charges (e) - (0.01) - (0.01) Diluted net income (loss) per common share attributable to Bruker Corporation - adjusted 0.26 $ (0.04) $ 0.01 $ 0.23 $ Weighted average shares outstanding: 164.7 163.4 164.7 164.7 |
|
|
January 12, 2011 28 www.bruker.com © Copyright 2011 Bruker Corporation. INNOVATION WITH INTEGRITY |

