Attached files
| file | filename |
|---|---|
| 8-K - FORM 8-K - SYNERGETICS USA INC | c62151e8vk.htm |
Exhibit
99.1

| January 2011 Investor Presentation QUALITY. PERFORMANCE. INNOVATION. |

| Certain statements made in this presentation are forward-looking within the meaning of the Private Securities Litigation Reform Act of 1995. Among other, statements concerning management's expectations of future financial results, potential business, acquisitions, government agency approvals, additional indications and therapeutic applications for medical devices, as well as their outcomes, clinical efficacy and potential markets are forward looking. Forward-looking statements involve risks and uncertainties that could cause actual results to differ materially from predicted results. For a discussion of such risks and uncertainties, please refer to the information set forth under "Risk Factors" included in Synergetics USA, Inc.'s Annual Report on Form 10-K for the year ended July 31, 2010 and information contained in subsequent filings with the Securities and Exchange Commission. These forward looking statements are made based upon our current expectations and we undertake no duty to update information provided in this presentation. presentation. presentation. presentation. presentation. presentation. presentation. presentation. presentation. presentation. presentation. presentation. presentation. presentation. presentation. presentation. 2 |

| Synergetics is a medical device company focused in the ophthalmology and neurosurgery market Synergetics USA, Inc. was formed through a reverse merger of Synergetics, Inc. and Valley Forge Scientific in 2005 Synergetics was founded in 1991 and Valley Forge was founded in 1980 and became a publicly-held company in November 1989 Synergetics USA, Inc. (NASDAQ: SURG) Corporate Headquarters: O'Fallon, MO Manufacturing Facilities: O'Fallon, MO and King of Prussia, PA Shares Outstanding: 24.84mm 52 Week Range: $1.15 - $4.92 Market Cap.: $122.22mm 3 |

| Quarter to Quarter (2010 vs. 2011) 1Q FY 2010 1Q FY 2011 % Increase (Decrease) Ophthalmic $ 7,522 $ 7,976 6.0% Neurosurgery 2,900 487 (83.2%) Marketing Partners -- 1,762 N/M Total Neurosurgery & Marketing Partners 2,900 2,249 (22.4%) OEM (Codman, Stryker & Iridex) 1,690 1,837 8.7% Other 34 14 (58.8%) Total $12,146 $12,076 (0.6%) Year to Year (2009 vs. 2010) FY 2009 FY 2010 % Increase (Decrease) Ophthalmic $29,981 $31,689 5.7% Neurosurgery 13,968 8,175 (41.5%) Marketing Partners N/A 4,204 N/M Total Neurosurgery & Marketing Partners 13,968 12,379 (11.4%) OEM (Codman, Stryker & Iridex) 8,538 7,878 (7.7%) Other 478 129 (73.0%) Total $52,965 $52,075 (1.7%) Total $52,965 $52,075 (1.7%) Total $52,965 $52,075 (1.7%) 4 |

| Neuro Transition Complete Approximately $1m residual "Direct" business remains Marketing Partners are on forecast thru 1st Quarter 2011 Codman has exercised "exclusivity" on Bipolar Coagulators 1st clean quarter for comparables: 4th Quarter FY 2011 R&D, new products on schedule for introduction in FY 2011 Alcon, OEM opportunity on track for shipment during 3rd Quarter FY 2011 Steady progress towards 60% Gross Margin goal Last Bond (on building) will be retired 2/11. Total remaining debt $2.3m Retinal Solutions consulting agreement CMC-V Release 5 |

| Drive operational efficiencies to improve the platform's profitability Lean Manufacturing Inventory Reduction Select Outsourcing Elements of Project Restore Ophthalmology: Strategic Growth Retina Fill gaps Expand offering Expand into new market segments Develop strategy for ASC dynamic Develop strategy for emerging markets Opportunistic acquisitions Neurosurgery - Generate Cash Leverage marketing partner's distribution networks Focus development on high margin electrosurgery products Sales Force Productivity Sales Force Productivity Sales Force Productivity Sales Force Productivity Sales Force Productivity Sales Force Productivity Sales Force Productivity Sales Force Productivity Sales Force Productivity Sales Force Productivity Sales Force Productivity Sales Force Productivity Sales Force Productivity Sales Force Productivity Sales Force Productivity Sales Force Productivity Sales Force Productivity Sales Force Productivity 6 |

| Markets |

| 2009 Anterior (Cataract) and Posterior (Retinal) Markets Compared 8 |

| Total Market: M$770 Estimated Yearly Growth: 5.4% Global Retinal Device Markets 2009 9 |

| Anti-VEGF Therapies (i.e. Lucentis) Long Term Drug Delivery Implants Artificial Vision Microplasmin Vitreous Disinsertion Site of Service Migration, e.g. ASC, Office Site of Service Migration, e.g. ASC, Office Site of Service Migration, e.g. ASC, Office Site of Service Migration, e.g. ASC, Office Site of Service Migration, e.g. ASC, Office Site of Service Migration, e.g. ASC, Office Site of Service Migration, e.g. ASC, Office Site of Service Migration, e.g. ASC, Office Site of Service Migration, e.g. ASC, Office Site of Service Migration, e.g. ASC, Office 10 |
| Product Review |

| Ophthalmology Products 12 DDMS Quantel Laser Directional Laser Probes Endoilluminator - Awh Chandelier Photon II |

| The OMNI is the most innovative and user-friendly ultrasonic aspirator available. In addition to the soft tissue removal capabilities common, it effectively addresses dense, fibrotic lesions, and pioneers the fine dissection of bone traditionally performed with rotating drills. The OMNI The Disposable Spetzler-Malis "Yellow" bipolar forceps offer surgeons brand- new, high-polished tips for guaranteed non-stick performance. Disposable Bipolar Forceps Our next generation Malis(r) Bipolar Generator. Dual- waveform technology provides delicate and efficient cutting and coagulation control at even lower power settings, further reducing thermal spread and collateral tissue damage. The Advantage(tm) 13 |

| CMC V Codman Synergy Stryker Lesion Generator 14 |

| 15 |

| 16 |

| Financials |

| Sales were down slightly for the fiscal year ended July 31, 2010 with disposables sales up 6.7% and capital sales down 22.1%. Commercial Expenses were down 9.2% primarily due to our transition of our neurosurgery business to marketing partners. Net income from operations increased by 130.6% and earnings per share increased by 114.3%. Cash flow from operations increased from a $492,000 to a positive $7.4 million (excluding one-time events impact) as compared to fiscal 2009. Total interest bearing debt decreased $9.1 million from FYE 2009 to approximately $4.1 million bringing our leverage down to 8.4%. Post Alcon transaction (including payment of taxes), Company has $18.7 million of cash on its balance sheet and has significantly reduced its debt. million of cash on its balance sheet and has significantly reduced its debt. million of cash on its balance sheet and has significantly reduced its debt. million of cash on its balance sheet and has significantly reduced its debt. million of cash on its balance sheet and has significantly reduced its debt. million of cash on its balance sheet and has significantly reduced its debt. million of cash on its balance sheet and has significantly reduced its debt. million of cash on its balance sheet and has significantly reduced its debt. million of cash on its balance sheet and has significantly reduced its debt. million of cash on its balance sheet and has significantly reduced its debt. million of cash on its balance sheet and has significantly reduced its debt. million of cash on its balance sheet and has significantly reduced its debt. million of cash on its balance sheet and has significantly reduced its debt. million of cash on its balance sheet and has significantly reduced its debt. million of cash on its balance sheet and has significantly reduced its debt. million of cash on its balance sheet and has significantly reduced its debt. million of cash on its balance sheet and has significantly reduced its debt. million of cash on its balance sheet and has significantly reduced its debt. 18 |

| Sales were flat (at $12.1 million) for the first fiscal quarter ended October 31, 2010 with disposables sales up 6.0% and capital sales down 23.1%. ($440,000 loss in Omni sales from 1Q 2010) Gross Profit Margin increased to 1.2 points to 58.2% due to improved margins on our ophthalmology products and improved absorption. Sales & Marketing expense decrease of $236,000, R&D increase of $90,000 and a G&A increase of $222,000. Net income from operations increased by $50,000 (16.8%) and earnings per share increased by $0.01 (50.0%). Total interest bearing debt decreased $175,000 from first quarter of fiscal 2011 to approximately $3.9 million. Following the February retirement of last bond, debt falls to $2.3 million. Post Alcon transaction, Company has $18.5 million of cash on its balance sheet and has significantly reduced its debt. and has significantly reduced its debt. and has significantly reduced its debt. and has significantly reduced its debt. and has significantly reduced its debt. and has significantly reduced its debt. and has significantly reduced its debt. and has significantly reduced its debt. and has significantly reduced its debt. and has significantly reduced its debt. and has significantly reduced its debt. and has significantly reduced its debt. and has significantly reduced its debt. and has significantly reduced its debt. and has significantly reduced its debt. and has significantly reduced its debt. and has significantly reduced its debt. and has significantly reduced its debt. and has significantly reduced its debt. and has significantly reduced its debt. 19 |

| FY 2010 FY 2009 Increase/ (Decrease) Sales $52,075 $52,965 (1.7%) Gross Profit 29,909 29,415 1.7% Gross Profit Margin 57.4% 55.5% 3.4% Commercial Expenses 23,869 26,290 (9.2%) Operating Income 6,040 3,125 93.0% Net Income $5,733 $1,595 259.4% Net Income from Operations $3,678 $1,595 130.6% EPS $0.23 $0.07 228.6% EPS from Operations $0.15 $0.07 114.3% 20 |
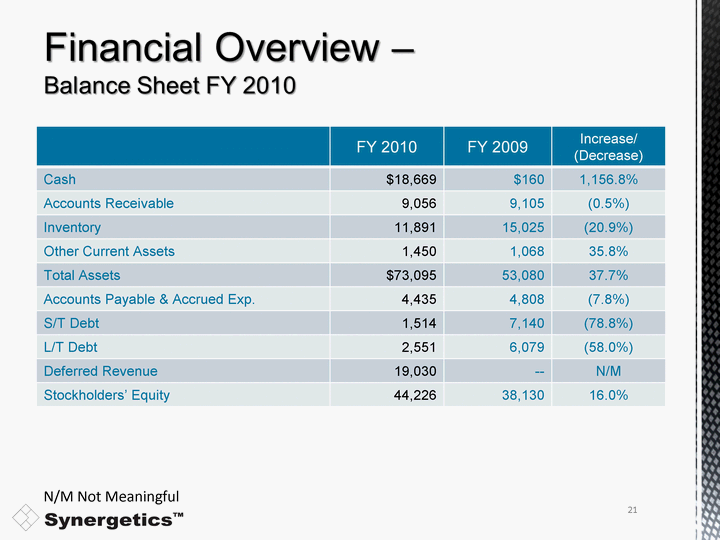
| FY 2010 FY 2009 Increase/ (Decrease) Cash $18,669 $160 1,156.8% Accounts Receivable 9,056 9,105 (0.5%) Inventory 11,891 15,025 (20.9%) Other Current Assets 1,450 1,068 35.8% Total Assets $73,095 53,080 37.7% Accounts Payable & Accrued Exp. 4,435 4,808 (7.8%) S/T Debt 1,514 7,140 (78.8%) L/T Debt 2,551 6,079 (58.0%) Deferred Revenue 19,030 -- N/M Stockholders' Equity 44,226 38,130 16.0% N/M Not Meaningful 21 |
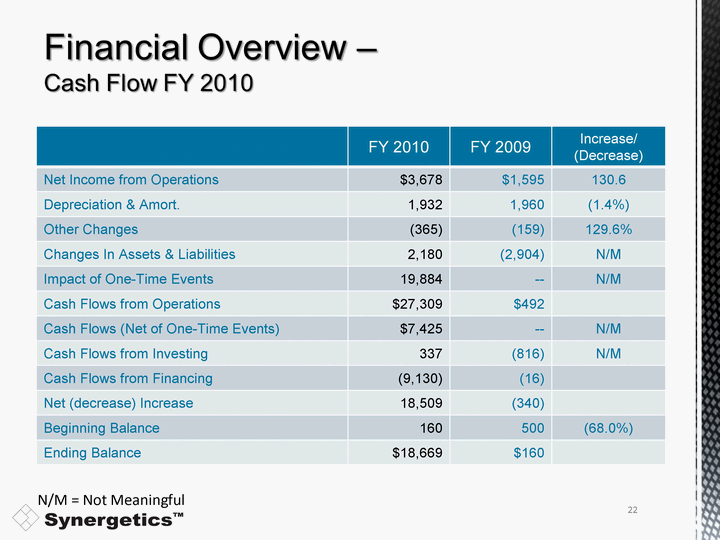
| FY 2010 FY 2009 Increase/ (Decrease) Net Income from Operations $3,678 $1,595 130.6 Depreciation & Amort. 1,932 1,960 (1.4%) Other Changes (365) (159) 129.6% Changes In Assets & Liabilities 2,180 (2,904) N/M Impact of One-Time Events 19,884 -- N/M Cash Flows from Operations $27,309 $492 Cash Flows (Net of One-Time Events) $7,425 -- N/M Cash Flows from Investing 337 (816) N/M Cash Flows from Financing (9,130) (16) Net (decrease) Increase 18,509 (340) Beginning Balance 160 500 (68.0%) Ending Balance $18,669 $160 N/M = Not Meaningful 22 |

| Preliminary FY 2010 FY 2009 Increase/ (Decrease) Income from Stryker Gain $817 $-- Income from Alcon settlement 2,398 -- Income from Operations 8,033 492 Net Income from Stryker Gain 522 -- Net Income from Alcon settlement 1,533 -- Net Income from Operations 3,678 1,595 130.6% EPS from Stryker Gain $0.02 $0.00 EPS from Alcon settlement 0.06 0.00 EPS from Operations $0.15 $0.07 114.3% Total EPS $0.23 $0.07 228.6% 23 |
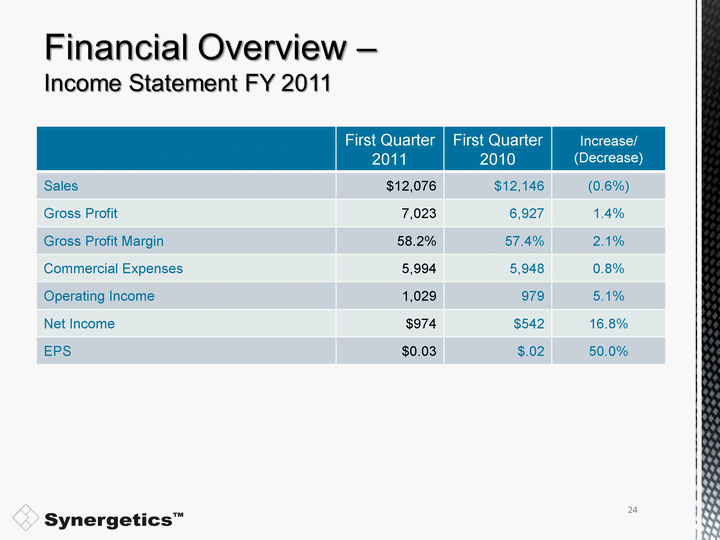
| First Quarter 2011 First Quarter 2010 Increase/ (Decrease) Sales $12,076 $12,146 (0.6%) Gross Profit 7,023 6,927 1.4% Gross Profit Margin 58.2% 57.4% 2.1% Commercial Expenses 5,994 5,948 0.8% Operating Income 1,029 979 5.1% Net Income $974 $542 16.8% EPS $0.03 $.02 50.0% 24 |

| First Quarter 2011 First Quarter 2010 Increase/ (Decrease) Cash $18,519 $363 500.2% Accounts Receivable 9,132 8,023 13.8% Inventory 13,421 14,846 (9.6%) Other Current Assets 1,188 1,027 15.7% Total Assets $74,143 56,737 30.7% Accounts Payable & Accrued Exp. 4,538 4,010 13.2% S/T Debt 1,523 5,937 (74.3%) L/T Debt 2,367 5,759 (58.9%) Deferred Revenue 19,030 -- N/M Stockholders' Equity 45,167 38,746 16.6% N/M Not Meaningful 25 |

| First Quarter 2011 First Quarter 2010 Increase/ (Decrease) Net Income from Operations $633 $542 16.8% Depreciation & Amort. 481 480 0.2% Other Changes (1) (31) 96.8% Changes In Assets & Liabilities (893) 604 N/M Cash Flows from Operations $220 $1,595 (86.2%) Cash Flows from Investing ($335) ($223) 50.2% Cash Flows from Financing ($63) ($1,169) 94.6% Foreign exchange rate effect 28 -- N/M Net (decrease) increase in cash ($150) 203 N/M Beginning Balance 18,669 160 1,156.8% Ending Balance $18,519 $363 500.2% N/M = Not Meaningful 26 |

| Improved stability of the platform Plans to re-invigorate sales growth Unique, technically proficient worldwide distribution capability Opportunity to create "Fast Follower" that will be viewed as an attractive entry vehicle to ophthalmology as an attractive entry vehicle to ophthalmology as an attractive entry vehicle to ophthalmology as an attractive entry vehicle to ophthalmology as an attractive entry vehicle to ophthalmology as an attractive entry vehicle to ophthalmology as an attractive entry vehicle to ophthalmology as an attractive entry vehicle to ophthalmology as an attractive entry vehicle to ophthalmology as an attractive entry vehicle to ophthalmology 27 |

| David M. Hable - President, CEO 30 years of progressive responsibility in sales, marketing, new business development and general management in the medical device industry. Pamela Boone - Executive Vice President, CFO Previously served as CFO, VP, and Corporate Controller for Maverick Tube Corporation. 25 years of financial expertise. Kurt Gampp - Executive Vice President, COO Co-founded Synergetics, Inc. 30 years of microsurgical instrument making experience. Jerry Malis, M.D. - Executive Vice President, CSO Served as President, CEO, & Chairman of Valley Forge. Over 40 years of industry experience. Published over 50 articles in the biological science, electronics and engineering fields. Issued ten U.S. patents. Jason Stroisch - Vice President, Marketing Over 15 years experience in the medical device industry covering engineering, international sales and marketing management roles. Michael Fanning - Vice President, Sales Over 20 years in sales and management roles, working in service, medical device, and manufacturing sectors. sectors. sectors. sectors. sectors. sectors. sectors. sectors. sectors. sectors. sectors. sectors. sectors. sectors. sectors. sectors. sectors. sectors. sectors. sectors. sectors. sectors. sectors. 28 |

| January 2011 Investor Presentation QUALITY. PERFORMANCE. INNOVATION. 3845 Corporate Centre Drive O'Fallon, MO 63368 (636) 939-5100 www.synergeticsusa.com |