Attached files
| file | filename |
|---|---|
| 8-K - FORM 8-K - MOSAIC CO | d8k.htm |
 Phosphate
and
Potash
Market
Volatility
Déjà
Vu All Over Again?
Ohio AgriBusiness
Association and OSU Extension
2011 Crop Production Conference
Columbus, OH
January 6, 2011
Dr. Michael R. Rahm
Vice President, Market and Strategic Analysis
The Mosaic Company
Exhibit 99.1 |
 2
Safe Harbor Statement
This presentation contains forward-looking statements within the meaning of
the Private Securities Litigation Reform Act of 1995. Such statements
include, but are not limited to, statements about future financial and operating results. Such statements are
based upon the current beliefs and expectations of The Mosaic Company’s
management and are subject to significant risks and uncertainties.
These
risks
and
uncertainties
include
but
are
not
limited
to
the
predictability
and
volatility
of,
and
customer
expectations
about,
agriculture,
fertilizer,
raw
material,
energy
and
transportation
markets
that
are
subject
to
competitive
and
other
pressures
and
economic and credit market conditions; the build-up of inventories in the
distribution channels for crop nutrients; changes in foreign currency and
exchange rates; international trade risks; changes in government policy; changes in environmental and other
governmental regulation, including greenhouse gas regulation, and implementation
of the U.S. Environmental Protection Agency’s numeric water quality
standards for the discharge of nutrients into Florida lakes and streams; further developments in the lawsuit
involving the federal wetlands permit for the extension of the Company’s
South Fort Meade, Florida, mine into Hardee County, including orders,
rulings, injunctions or other actions by the court or actions by the plaintiffs, the Army Corps of Engineers or others
in relation to the lawsuit, or any actions the Company may identify and implement
in an effort to mitigate the effects of the lawsuit; other difficulties or
delays in receiving, or increased costs, or revocation, of, necessary governmental permits or approvals; the
effectiveness of our processes for managing our strategic priorities; adverse
weather conditions affecting operations in Central Florida or the Gulf Coast
of the United States, including potential hurricanes or excess rainfall; actual costs of various items
differing from management’s current estimates, including among others asset
retirement, environmental remediation, reclamation or other environmental
regulation, or Canadian resource taxes and royalties; accidents and other disruptions involving Mosaic’s
operations, including brine inflows at its Esterhazy, Saskatchewan potash mine and
other potential mine fires, floods, explosions, seismic events or releases
of hazardous or volatile chemicals, as well as other risks and uncertainties reported from time to time in
The Mosaic Company’s reports filed with the Securities and Exchange
Commission. Actual results may differ from those set forth in the
forward-looking statements. |
 Topics
January 2011 vs. January 2008
Powerful Demand Drivers –
Upbeat Forecasts
Phosphate Outlook:
Surging Demand –
Uncertain Supply
Potash Outlook:
Increasingly Tight Fundamentals
Factors to Watch (and Handicap)
3 |
 January 2011 vs. January 2008 |
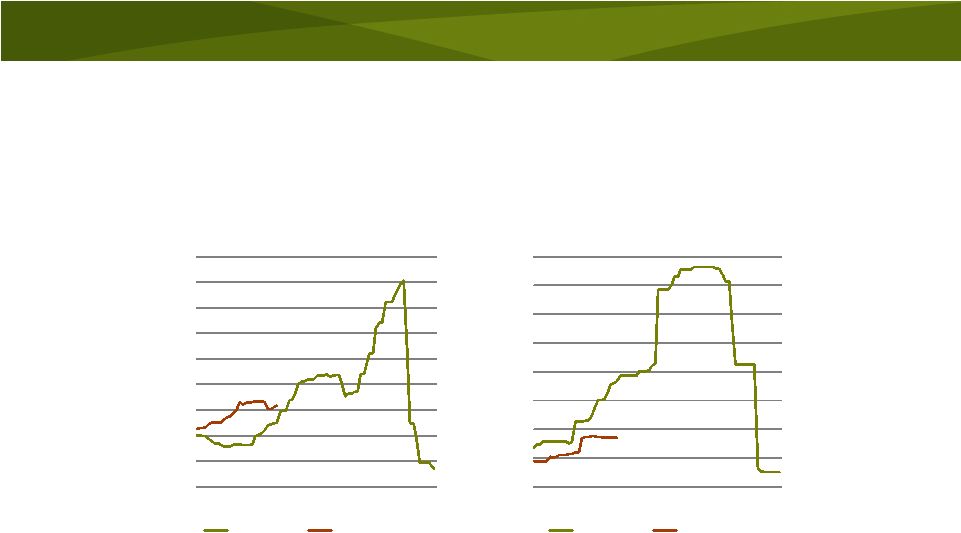
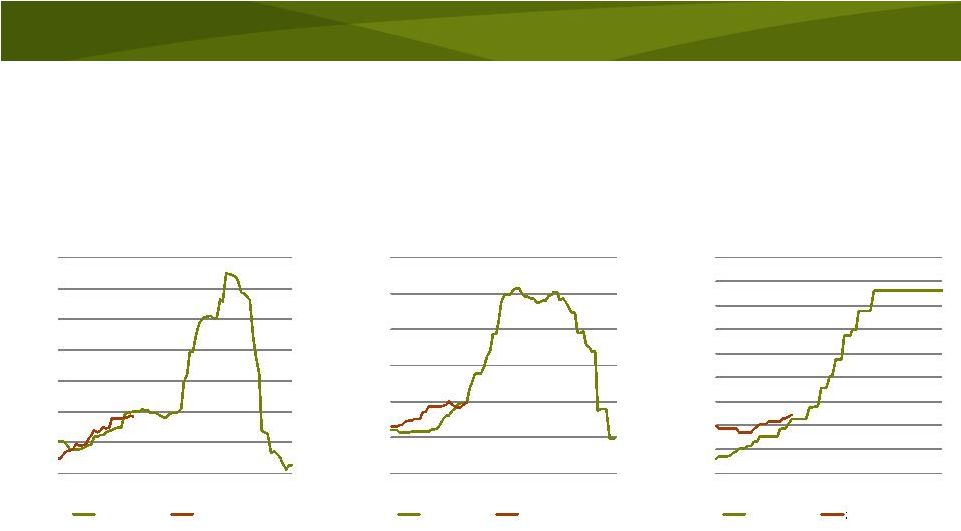 5
Current prices for crop nutrient products are at
roughly the same levels as 2008
Weekly published prices
2007/2008 -
Jul 1 2007 to Dec 31 2008
2010/2011 -
Jul 1 2010 to Dec 31 2010
200
300
400
500
600
700
800
900
Jul
Oct
Jan
Apr
Jul
Oct
$ Tonne
Mideast Granular Urea Prices
2007/2008
2010/2011
Source: Fertilizer Week America
200
400
600
800
1000
1200
1400
Jul
Oct
Jan
Apr
Jul
Oct
$ Tonne
Tampa fob DAP Prices
2007/2008
2010/2011
Source: Fertecon
200
300
400
500
600
700
800
900
1000
1100
Jul
Oct
Jan
Apr
Jul
Oct
$ Tonne
Brazil cnf
MOP Prices
2007/2008
2010/2011
Source: ICIS |
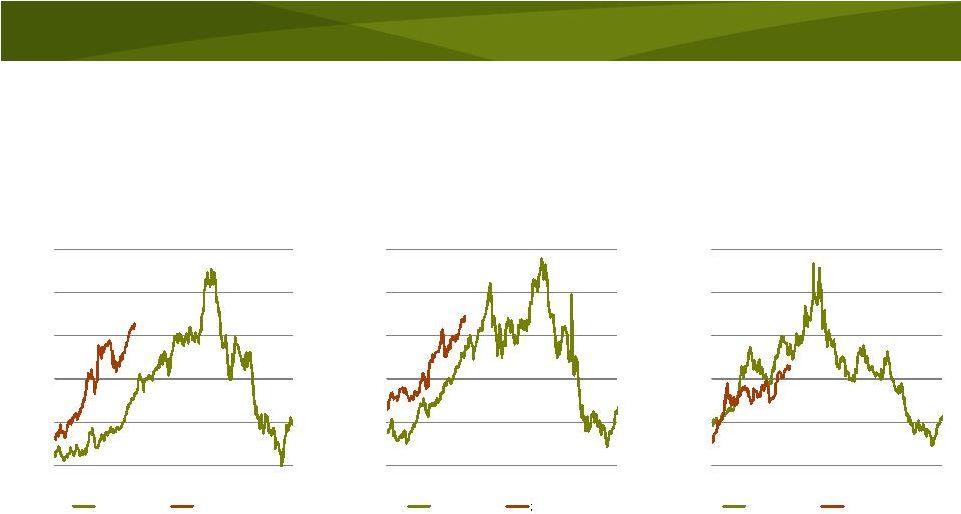 6
Nearby corn and soybean prices are higher,
but wheat prices are less than in 2008
Daily Close of Nearby Futures Contract
2007/2008 -
Jul 1 2007 to Dec 31 2008
2010/2011 -
Jul 1 2010 to Jan 3 2011
3.0
4.0
5.0
6.0
7.0
8.0
Jul
Oct
Jan
Apr
Jul
Oct
$ BU
Corn Prices
2007/2008
2010/2011
Source: CBOT
7.0
9.0
11.0
13.0
15.0
17.0
Jul
Oct
Jan
Apr
Jul
Oct
$ BU
Soybean Prices
2007/2008
2010/2011
Source: CBOT
4.0
6.0
8.0
10.0
12.0
14.0
Jul
Oct
Jan
Apr
Jul
Oct
$ BU
HRW Wheat Prices
2007/2008
2010/2011
Source: KCBOT |
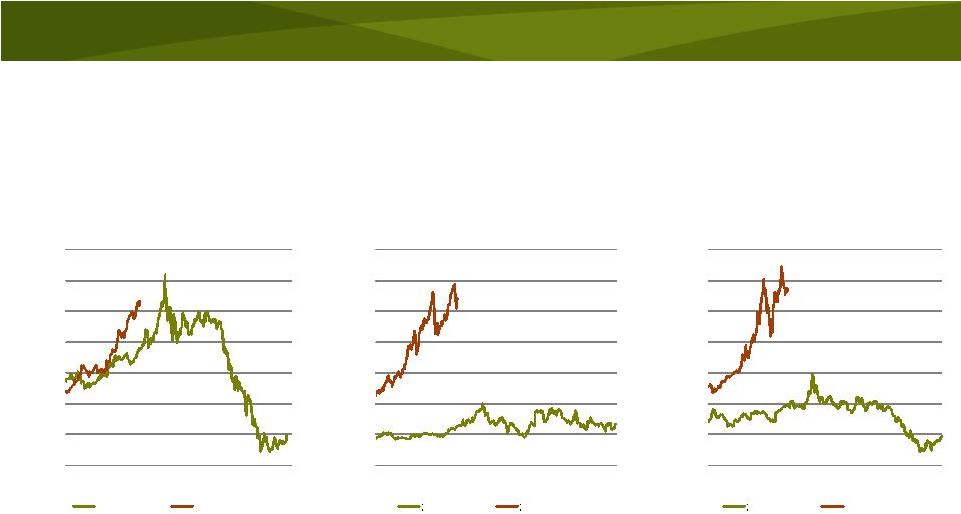 7
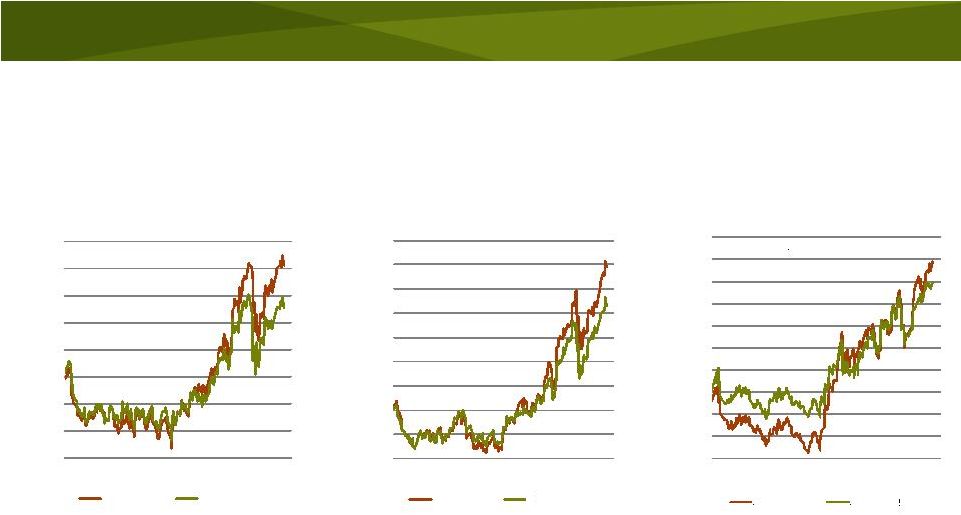
But much higher prices for other commodities -
implying greater competition for acres in 2011
Daily Close of Nearby Futures Contract
2007/2008 -
Jul 1 2007 to Dec 31 2008
2010/2011 -
Jul 1 2010 to Jan 3 2011
1200
1700
2200
2700
3200
3700
4200
4700
Jul
Oct
Jan
Apr
Jul
Oct
RM
Tonne
Palm Oil Prices
2007/2008
2010/2011
Source: Kuala Lumpur Exchange
5
10
15
20
25
30
35
40
Jul
Oct
Jan
Apr
Jul
Oct
CTS LB
Sugar (#11) Prices
2007/2008
2010/2011
Source: ICE
30
50
70
90
110
130
150
170
Jul
Oct
Jan
Apr
Jul
Oct
CTS LB
Cotton Prices
2007/2008
2010/2011
Source: ICE |
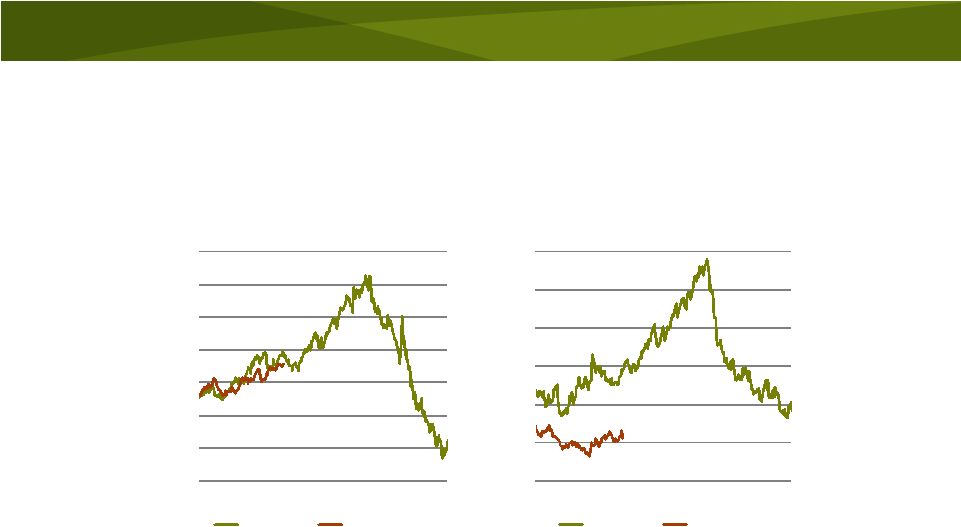 8
Oil prices are about the same but natural gas
prices are significantly less than in 2008
Daily Close of Nearby Futures Contract
2007/2008 -
Jul 1 2007 to Dec 31 2008
2010/2011 -
Jul 1 2010 to Jan 3 2011
20
40
60
80
100
120
140
160
Jul
Oct
Jan
Apr
Jul
Oct
$ BBL
WTI Crude Oil Prices
2007/2008
2010/2011
Source: NYMEX
2
4
6
8
10
12
14
Jul
Oct
Jan
Apr
Jul
Oct
$ MMBtu
HH Natural Gas Prices
2007/2008
2010/2011
Source: NYMEX |
 9
100
200
300
400
500
600
700
800
900
1000
Jul
Oct
Jan
Apr
Jul
Oct
$ Tonne
India cnf Ammonia Prices
2007/2008
2010/2011
Source: Fertecon
0
100
200
300
400
500
600
700
800
Jul
Oct
Jan
Apr
Jul
Oct
$ Tonne
China cnf Sulphur Prices
2007/2008
2010/2011
Source: Fertecon
Weekly published prices
2007/2008 -
Jul 1 2007 to Dec 31 2008
2010/2011 -
Jul 1 2010 to Dec 31 2010
Ammonia
prices
are
higher,
but
sulphur
prices
are
lower
than
in
2008
–
less
cost
pressure |
 10
The ratio of the crop nutrient price index to
the crop price index has declined in 2010
0.50
0.75
1.00
1.25
1.50
1.75
2.00
2.25
2.50
00
02
04
06
08
10
Crop Nutrient Price Index/Crop Price Index Ratio
Ratio
Average |
 Powerful Demand Drivers -
Upbeat
Demand Forecasts |
 12
Strong
price
signals
–
an
acreage
donnybrook
Daily Close of New Crop Options January 1 2010 to January 3 2011
3.75
4.00
4.25
4.50
4.75
5.00
5.25
5.50
5.75
Jan
Apr
Jul
Oct
Jan
$ BU
New Crop Corn Prices
Dec 2011
Dec 2012
Source: CBOT
9.00
9.50
10.00
10.50
11.00
11.50
12.00
12.50
13.00
13.50
Jan
Apr
Jul
Oct
Jan
$ BU
New Crop Soybean Prices
Nov 2011
Source: CBOT
5.20
5.60
6.00
6.40
6.80
7.20
7.60
8.00
8.40
8.80
9.20
Jan
Apr
Jul
Oct
Jan
$ BU
New Crop HRW Wheat Prices
July 2011
July 2012
Source: KCBOT
Nov 2012 |
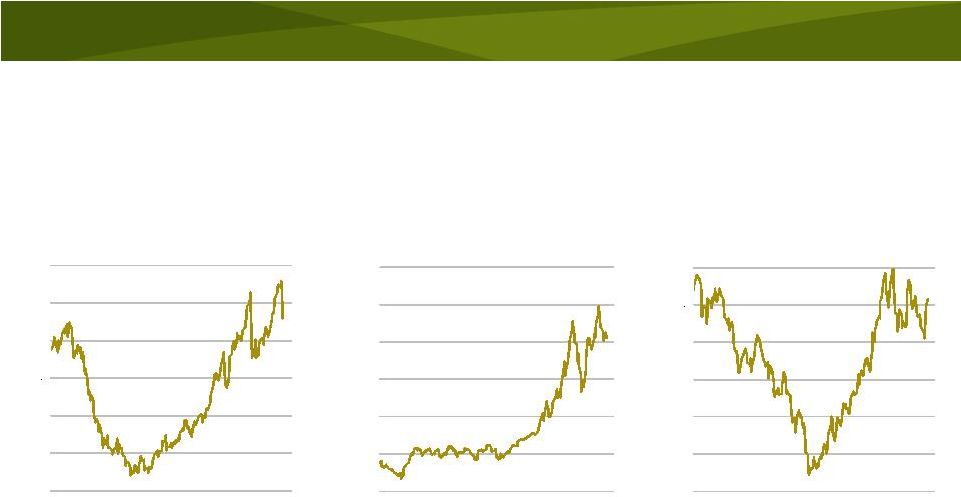 13
Daily Close of Nearby Futures Contract January 1 2010 to January 3 2011
And not just corn
12
16
20
24
28
32
36
Jan
Apr
Jul
Oct
Jan
CTS/LB
Sugar (#11) Price
Daily Close of Nearby Futures Contract
Source: ICE
60
80
100
120
140
160
180
Jan
Apr
Jul
Oct
Jan
CTS/LB
Cotton Price
Daily Close of Nearby Futures Contract
Source: ICE
9
10
11
12
13
14
15
Jan
Apr
Jul
Oct
Jan
CTS/LB
Rice (#2) Price
Daily Close of Nearby Futures Contract
Source: CBOT |
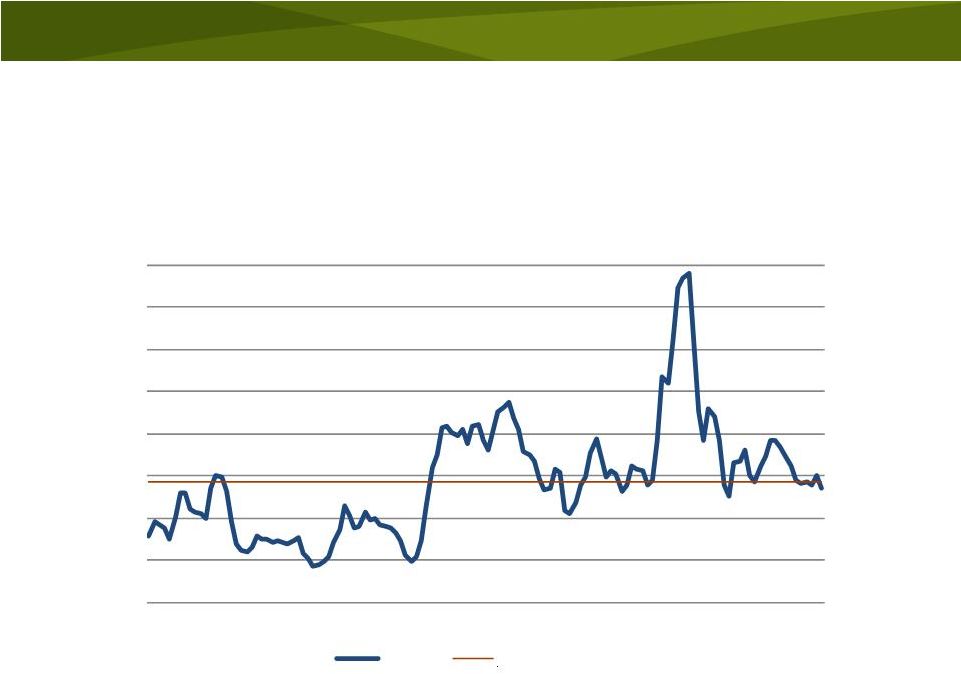
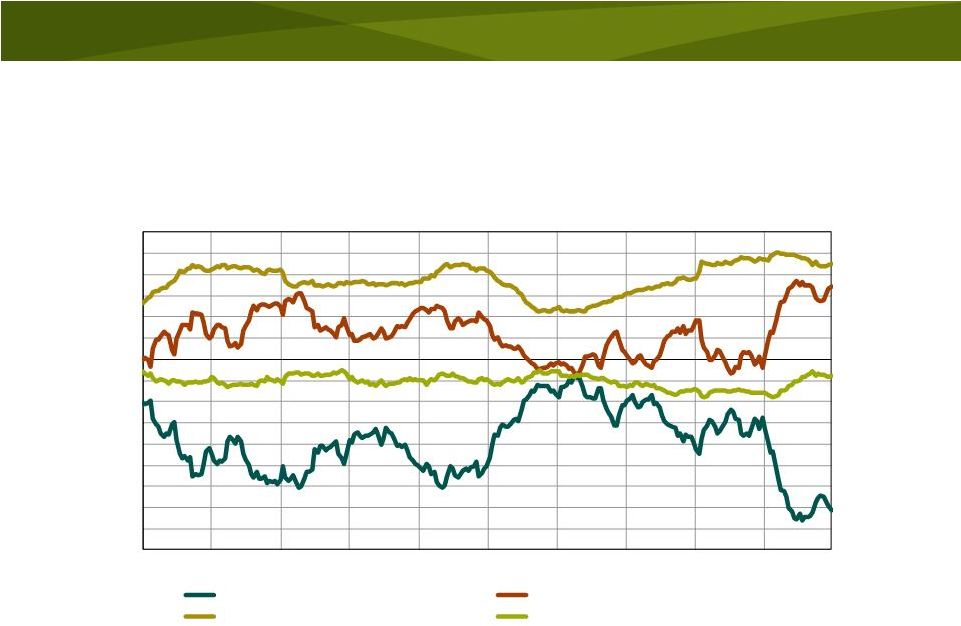 Is
it speculative exuberance? 14
-900,000
-800,000
-700,000
-600,000
-500,000
-400,000
-300,000
-200,000
-100,000
0
100,000
200,000
300,000
400,000
500,000
600,000
1/3/2006
7/3/2006
1/3/2007
7/3/2007
1/3/2008
7/3/2008
1/3/2009
7/3/2009
1/3/2010
7/3/2010
Contracts
Source: CFTC Commitments of Traders Weekly Report
Corn
Net Position by Futures Market Participants
Data thru December 28, 2010
Large Commercial Hedgers
Large Speculative Traders
Commodity Index Traders
Small Non-Reportable Positions |
 Or
is it fundamental strength? 15
0
25
50
75
100
125
150
175
200
225
70
72
74
76
78
80
82
84
86
88
90
92
94
96
98
00
02
04
06
08
10
Mil Tonnes
World Corn Stocks
China
Rest of World
Source: USDA |
 Or
is it fundamental strength? 16
0
7
14
21
28
35
42
49
56
63
70
0.0
0.5
1.0
1.5
2.0
2.5
3.0
3.5
4.0
4.5
5.0
70
72
74
76
78
80
82
84
86
88
90
92
94
96
98
00
02
04
06
08
10
Pct of Use
Bil Bu
U.S. Corn Stocks
Stocks
Pct of Use
Source: USDA and Mosaic
Key
Assumptions
for
2011/12
Planted acreage: 92.5 million
Trend Yield: 163.2 bu
acre
Total use: 13.55 bil
bu |
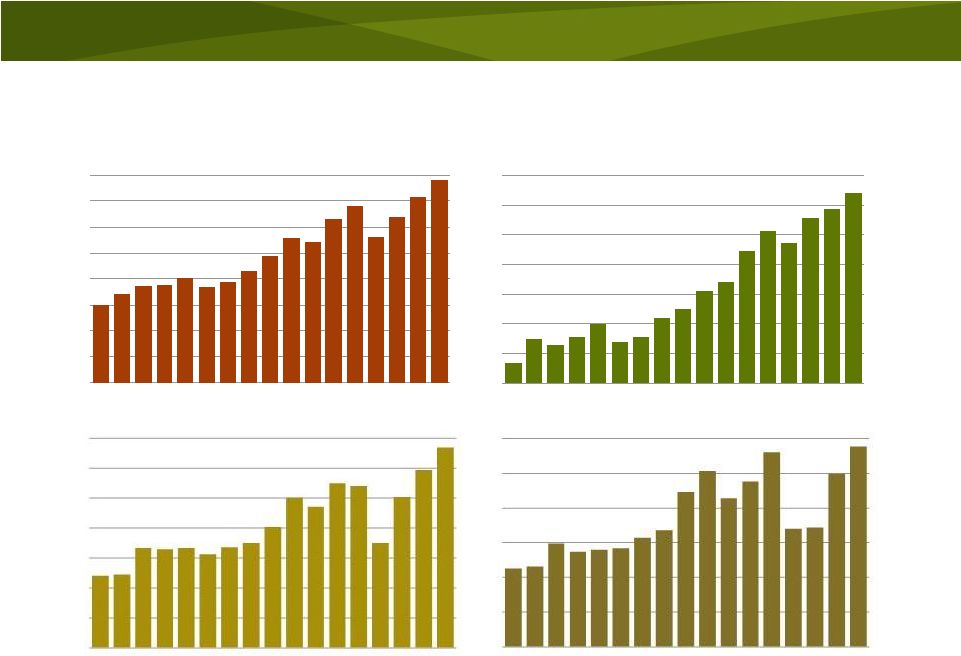 17
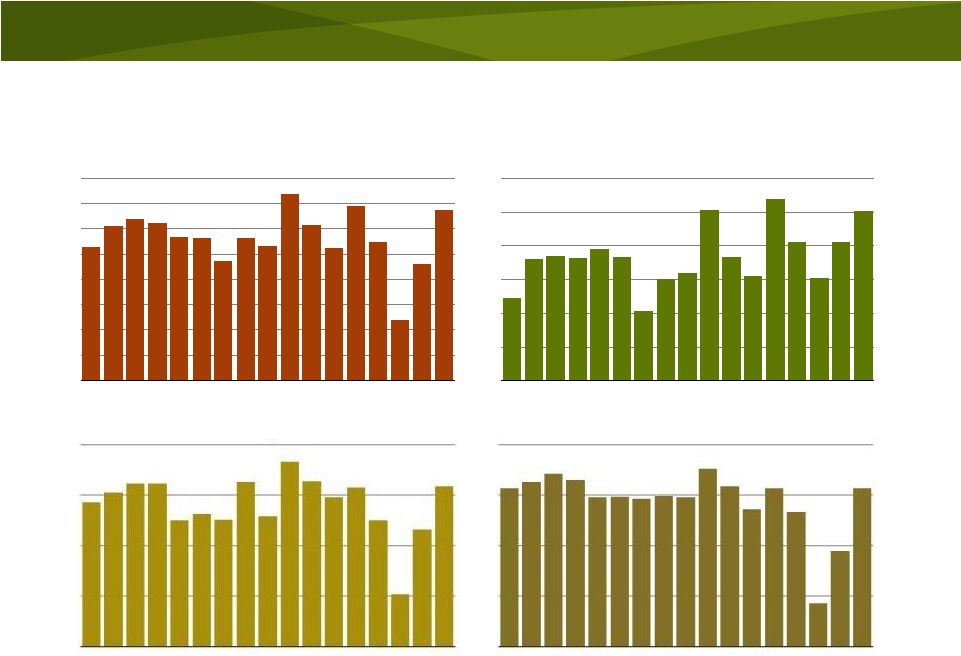
Strong global growth expected in 2011/12
100.0
110.0
120.0
130.0
140.0
150.0
160.0
170.0
180.0
95/96
97/98
99/00
01/02
03/04
05/06
07/08
09/10E
11/12F
Mil Tonnes
Source: IFA December 2010
World Nutrient Use
75.0
80.0
85.0
90.0
95.0
100.0
105.0
110.0
95/96
97/98
99/00
01/02
03/04
05/06
07/08
09/10E
11/12F
Mil Tonnes N
Source: IFA December 2010
World Nitrogen Use
25.0
27.5
30.0
32.5
35.0
37.5
40.0
42.5
95/96
97/98
99/00
01/02
03/04
05/06
07/08
09/10E
11/12F
Mil
Tonnes
P
O
Source: IFA December 2010
World Phosphate Use
15.0
17.5
20.0
22.5
25.0
27.5
30.0
95/96
97/98
99/00
01/02
03/04
05/06
07/08
09/10E
11/12F
Mil
Tonnes
K
O
Source: IFA December 2010
World Potash Use
2
2
5 |
 18
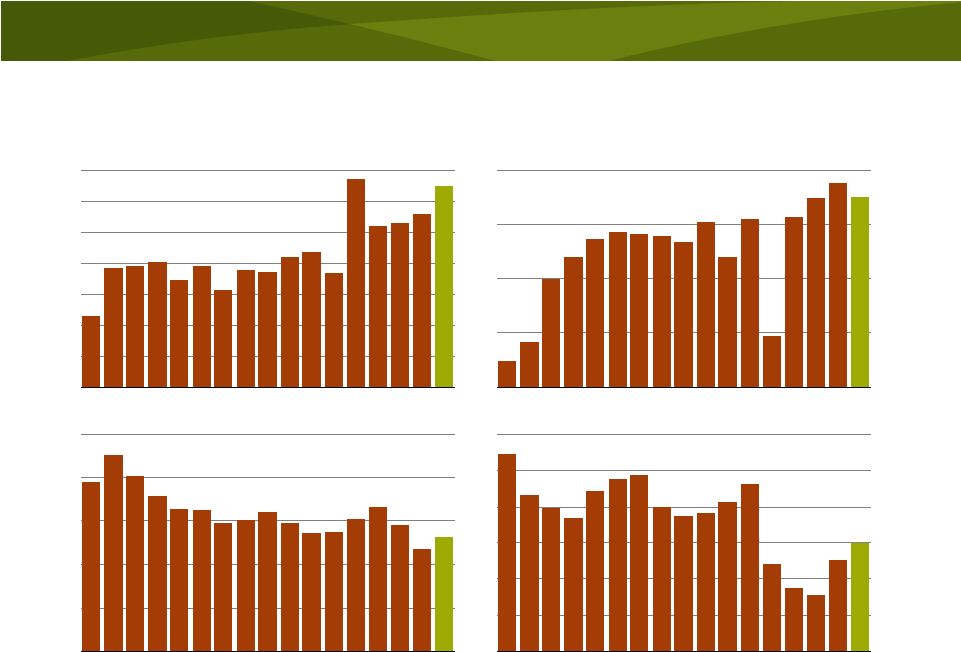
U.S. demand projected to grow 10%
16
17
18
19
20
21
22
23
24
95
96
97
98
99
00
01
02
03
04
05
06
07
08
09E
10E
11F
Mil Tons
Fertilizer Year Ending June 30
U.S. Nutrient Use
Source: AAPFCO and Mosaic
10.5
11.0
11.5
12.0
12.5
13.0
13.5
95
96
97
98
99
00
01
02
03
04
05
06
07
08
09E
10E
11F
Mil Tons N
Fertilizer Year Ending June 30
U.S. Nitrogen Use
Source: AAPFCO and Mosaic
3.0
3.5
4.0
4.5
5.0
95
96
97
98
99
00
01
02
03
04
05
06
07
08
09E
10E
11F
Fertilizer Year Ending June 30
U.S. Phosphate Use
Source: AAPFCO and Mosaic
2.0
3.0
4.0
5.0
6.0
95
96
97
98
99
00
01
02
03
04
05
06
07
08
09E
10E
11F
Fertilizer Year Ending June 30
U.S. Potash Use
Source: AAPFCO and Mosaic
Mil
Tonnes
P
O
2
5
Mil
Tonnes
K
O
2 |
 19
60
65
70
75
80
85
90
95
95
96
97
98
99
00
01
02
03
04
05
06
07
08
09
10
11F
Mil Acres
U.S. Corn Planted Acres
Source: USDA and Mosaic
60
65
70
75
80
95
96
97
98
99
00
01
02
03
04
05
06
07
08
09
10
11F
Mil Acres
U.S. Soybean Planted Acres
Source: USDA and Mosaic
Positive U.S. demand drivers
30
40
50
60
70
80
95
96
97
98
99
00
01
02
03
04
05
06
07
08
09
10
11F
Mil Acres
U.S. Wheat Planted Acres
Source: USDA and Mosaic
6
8
10
12
14
16
18
95
96
97
98
99
00
01
02
03
04
05
06
07
08
09
10
11F
Mil Acres
U.S. Cotton Planted Acres
Source: USDA and Mosaic |
 Phosphate Outlook:
Surging Demand –
Uncertain Supply |
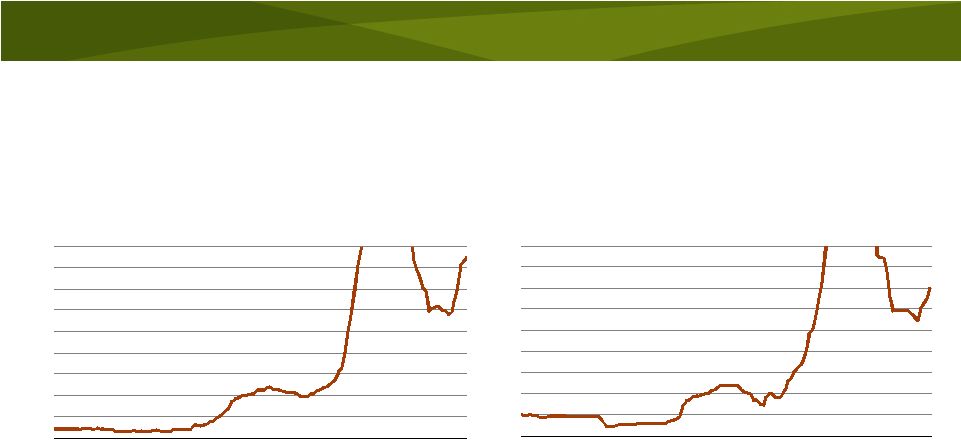
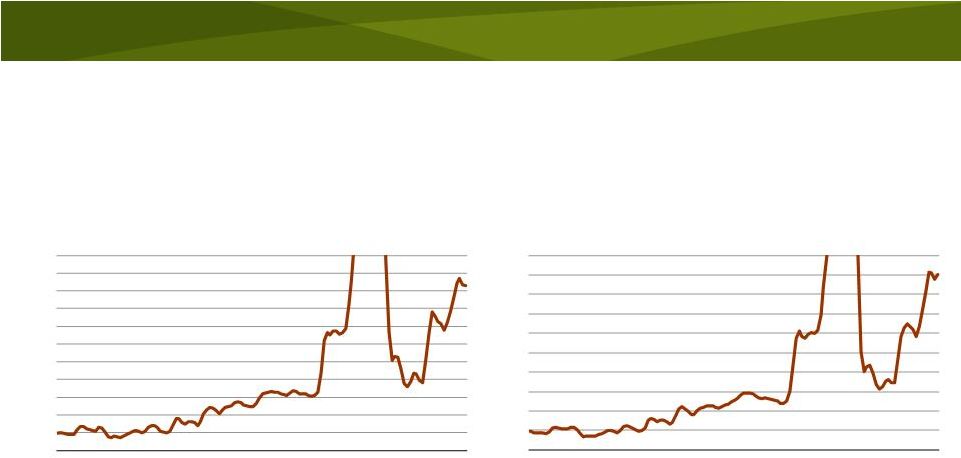 Market stable to slightly softer during this
seasonally slow period
21
100
150
200
250
300
350
400
450
500
550
600
650
00
01
02
03
04
05
06
07
08
09
10
11
$ MT
DAP Prices
fob Tampa Vessel
Source: Fertecon
100
150
200
250
300
350
400
450
500
550
600
00
01
02
03
04
05
06
07
08
09
10
11
$ ST
DAP Prices
NOLA Barge
Source: Green Markets |
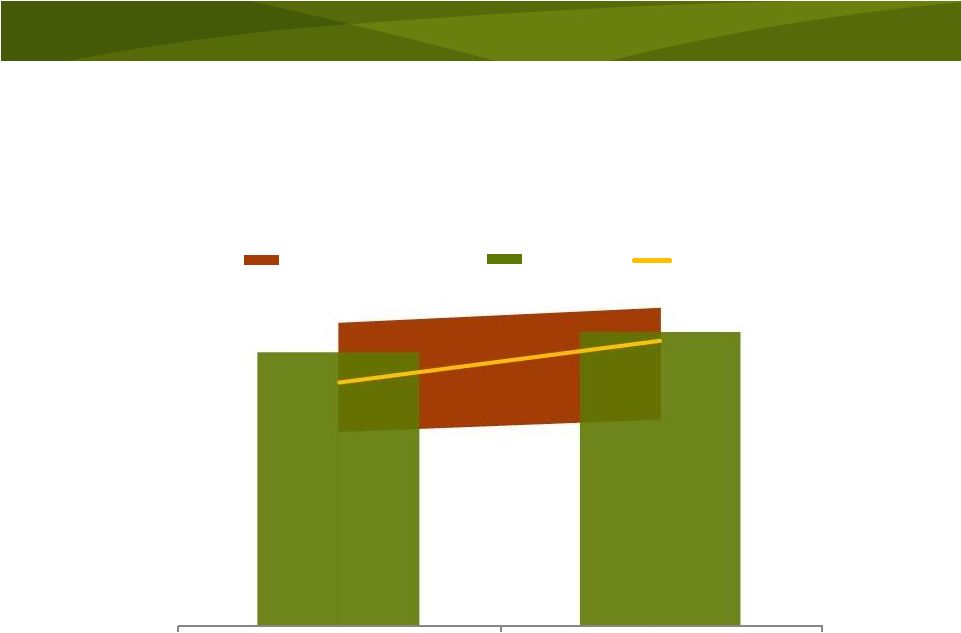
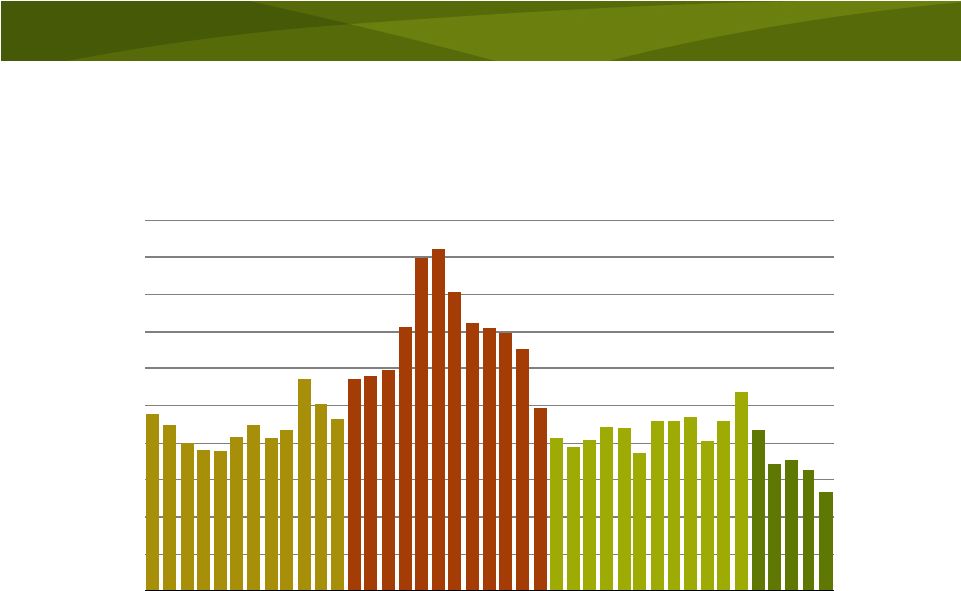
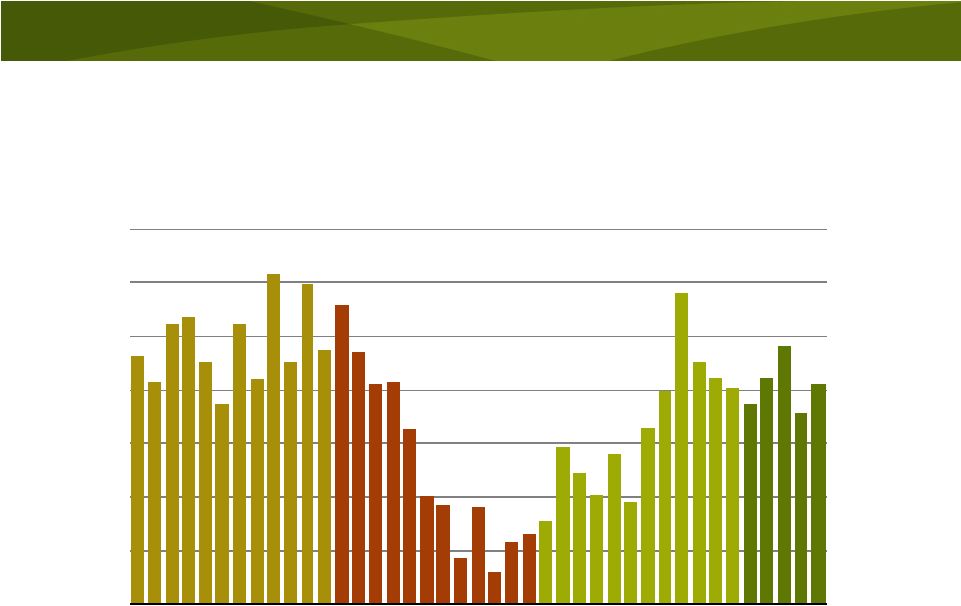
 25
30
35
40
45
50
55
60
65
95
96
97
98
99
00
01
02
03
04
05
06
07
08
09
10F
11F
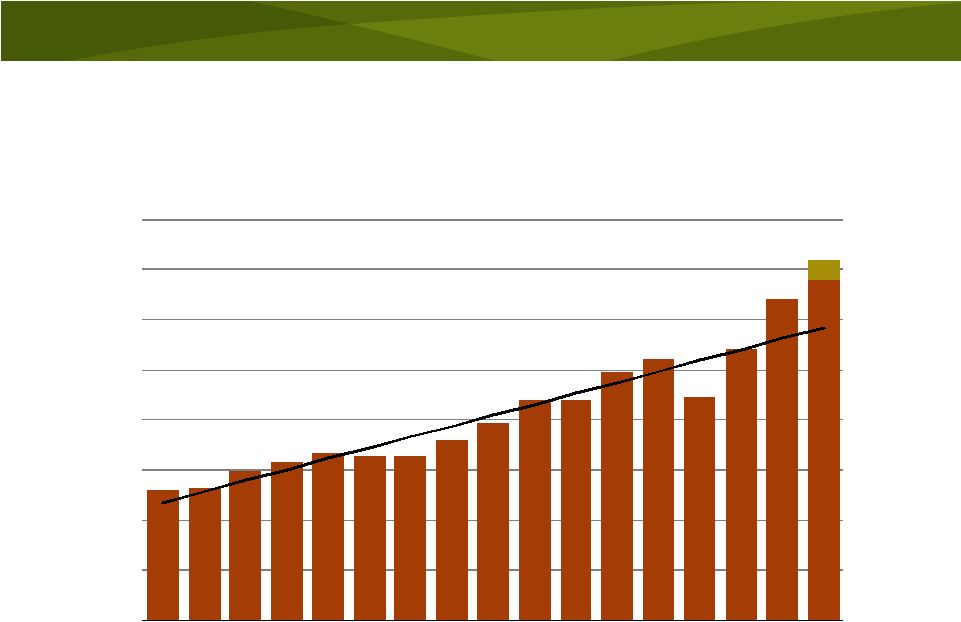
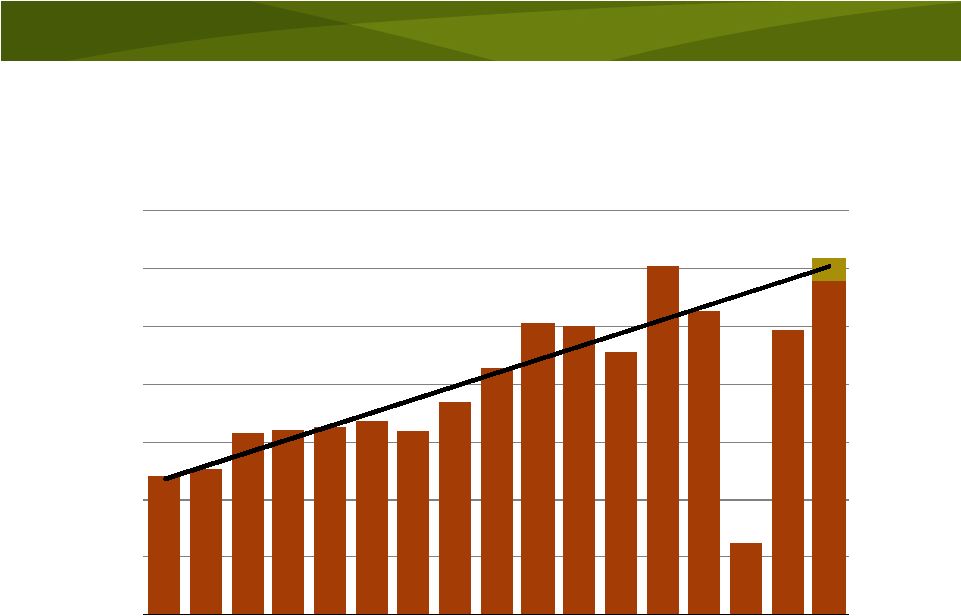
Mil Tonnes
DAP/MAP/TSP
World Processed Phosphate Shipments
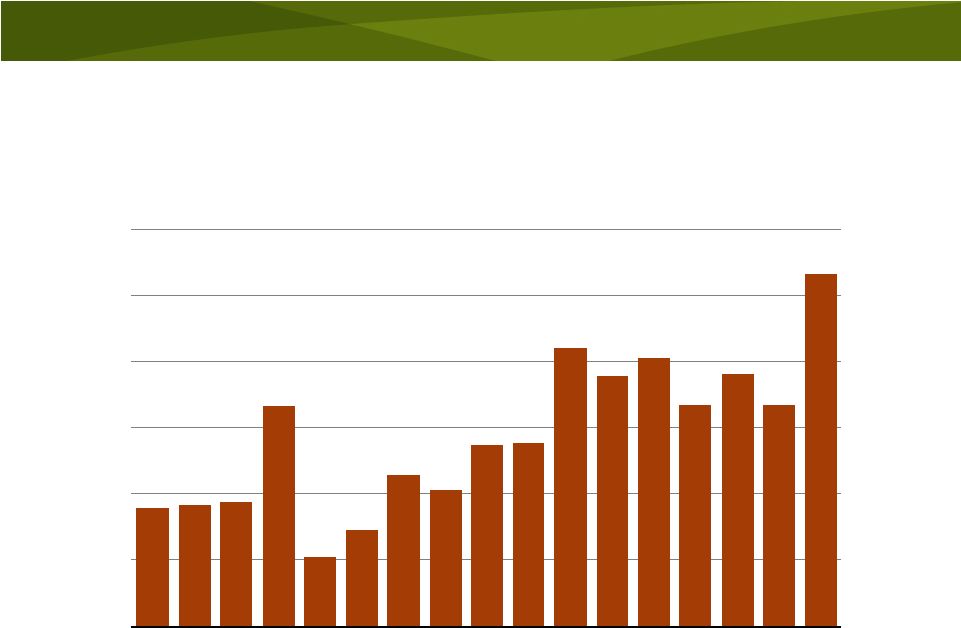
Surging global phosphate shipments
22
Source: Fertecon and Mosaic (Forecast Range for 2011, Trend 1995-2010)
|
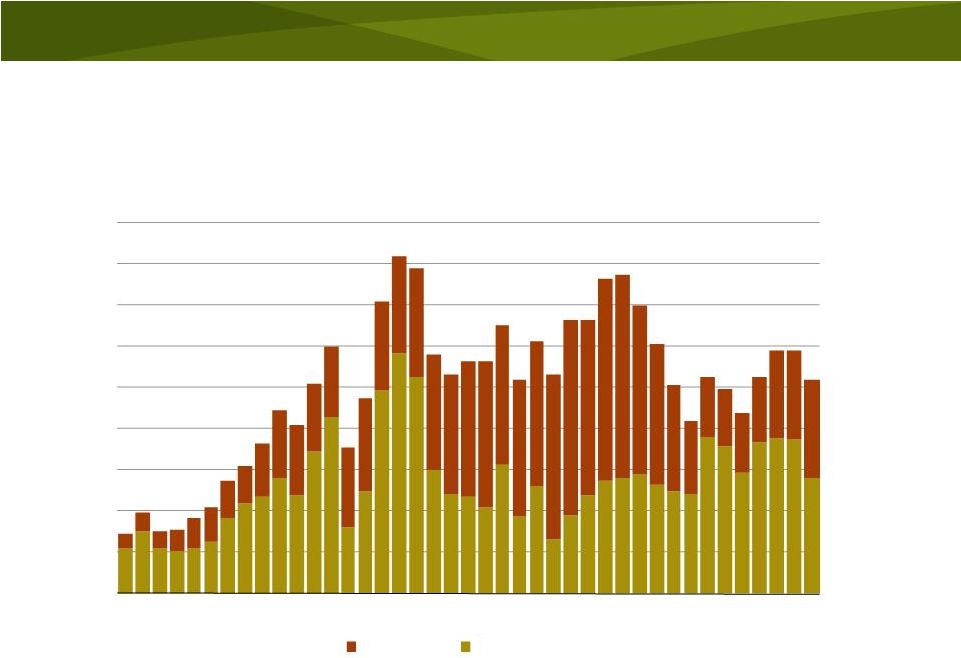
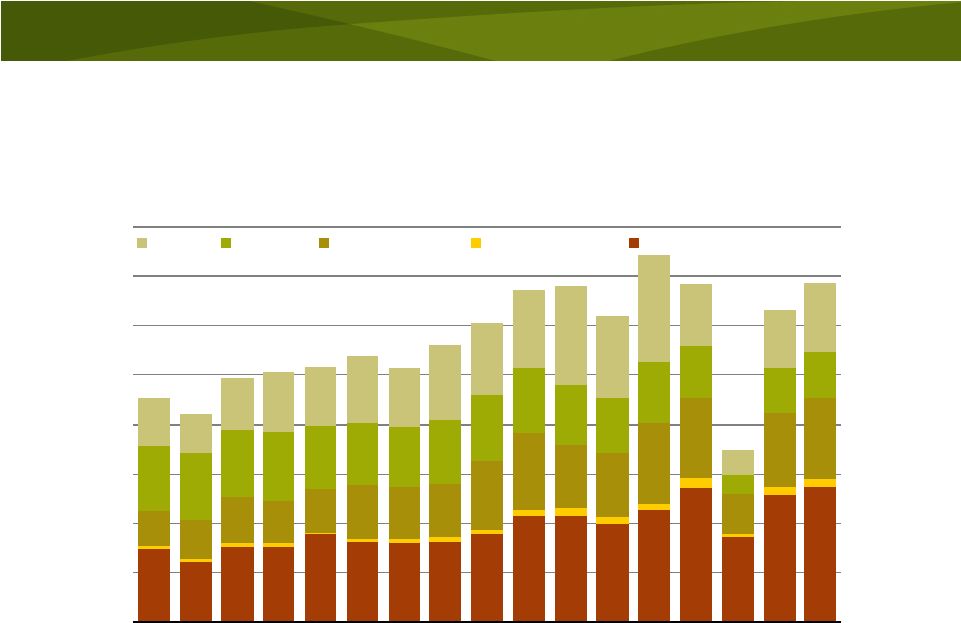
 Record phosphate trade
23
0
5
10
15
20
25
30
95
96
97
98
99
00
01
02
03
04
05
06
07
08
09
10F
11F
Mil Tonnes
DAP/MAP/TSP
World Processed Phosphate Import Demand
(Excludes China)
Other
Latin America
Asia less China
Europe
Source: Fertecon, IFA and Mosaic |
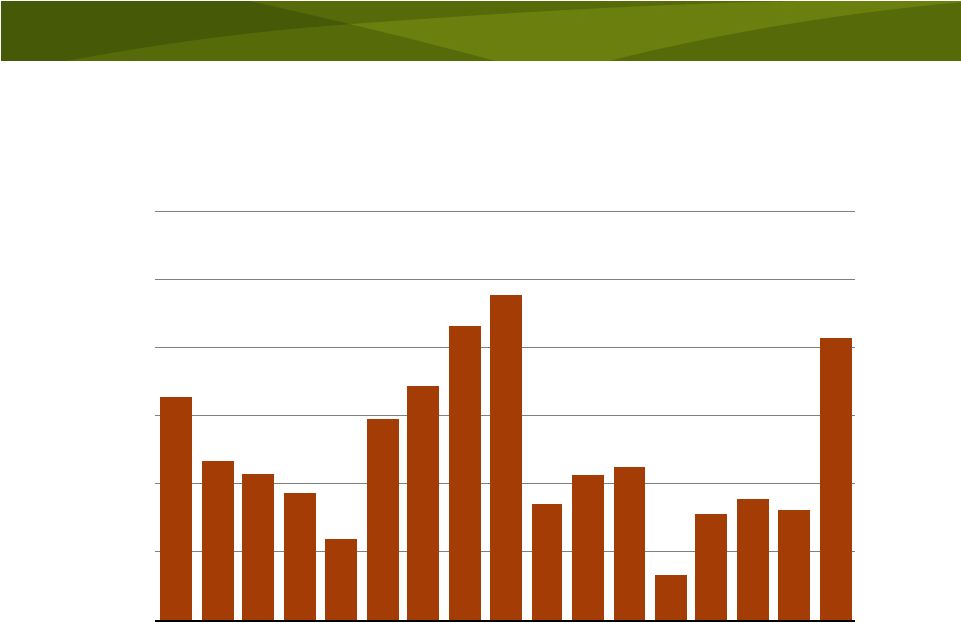
 24
U.S. DAP/MAP exports stable in 2010/11
0.0
2.0
4.0
6.0
8.0
10.0
12.0
14.0
95
96
97
98
99
00
01
02
03
04
05
06
07
08
09
10
11F
Mil Tons
U.S. DAP and MAP Exports
Source: TFI and Mosaic
Fertilizer Year Ending June 30 |
 25
0.0
0.1
0.2
0.3
0.4
0.5
0.6
0.7
0.8
0.9
Jul
07/08
Oct
Jan
Apr
Jul
08/09
Oct
Jan
Apr
Jul
09/10
Oct
Jan
Apr
Jul
10/11
Oct
Mil Tons
U.S. DAP and MAP Exports
Source: TFI
U.S. exports off 7% FY 2010/11 YTD |
 26
4.5
5.0
5.5
6.0
6.5
7.0
7.5
8.0
8.5
1.5
2.0
2.5
3.0
3.5
4.0
4.5
5.0
5.5
95
96
97
98
99
00
01
02
03
04
05
06
07
08
09E
10F
11F
Mil Tons
DAP/MAP
Mil Tons
P
2
O
5
U.S. Phosphate Use and DAP/MAP Shipments
Phosphate Use
DAP/MAP Shipments
Source: AAPFCO, TFI and Mosaic
Fertilizer Year Ending June 30
U.S. shipments forecast to climb another 13% |
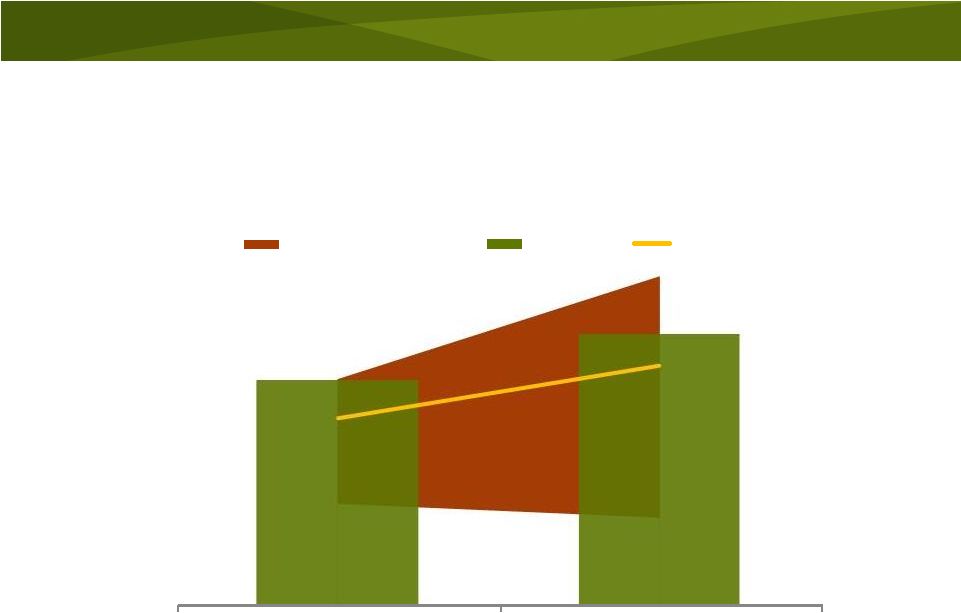
 Strong Spring shipments are expected
following an outstanding fall season
27
Source: TFI, US Department of Commerce and Mosaic
0.0
1.0
2.0
3.0
4.0
5.0
6.0
Jun
-Nov
Dec-May
Mil Tons
Implied North American Phosphate Shipments
5-Yr Min-Max Range
2010/11
5-Yr Average |
 28
0.0
0.2
0.4
0.6
0.8
1.0
1.2
1.4
Jul
07/08
Oct
Jan
Apr
Jul
08/09
Oct
Jan
Apr
Jul
09/10
Oct
Jan
Apr
Jul
10/11
Oct
Mil Tons
U.S. DAP and MAP Production
Source: TFI
Production down 2% FY 2010/11 YTD |
 29
0.0
0.1
0.2
0.3
0.4
0.5
0.6
95
96
97
98
99
00
01
02
03
04
05
06
07
08
09
10
11F
Mil Tons
U.S. DAP and MAP Imports
Source: TFI, USDOC, and Mosaic
Fertilizer Year Ending June 30
Surge of phosphate imports |
 30
0.0
0.2
0.4
0.6
0.8
1.0
1.2
1.4
1.6
1.8
2.0
Jul
07/08
Oct
Jan
Apr
Jul
08/09
Oct
Jan
Apr
Jul
09/10
Oct
Jan
Apr
Jul
10/11
Oct
Mil Tons
U.S. DAP and MAP Producer Stocks
Source: TFI
Record-low inventory level at producer sites |
 31
Bottom Line
Global shipments on a new growth trajectory
–
Global phosphate shipments likely increased to 57.0 MMT in
2010 and are forecast to increase to 59-61 MMT in 2011
–
Strong growth in Latin America and Asia
–
U.S. shipments projected to climb to 7.5 MST in 2010/11
based on higher acreage and application rates
–
“Perfect
Storm”
fall
season
in
NA
but
more
than
half
of
projected demand still ahead this spring
Supply uncertainties still overhang the market
–
Availability and cost of raw materials
–
Chinese export availability
–
Startup of new capacity in Saudi Arabia
–
Mosaic’s South Fort Meade mining permit
Market is expected to remain tight until new
capacity comes online |
 Potash Outlook:
Increasingly Tight Fundamentals |
 100
150
200
250
300
350
400
450
500
550
00
01
02
03
04
05
06
07
08
09
10
11
$ ST
MOP Prices
Blend Grade fob U.S. Midwest Warehouse
Source: Green Markets
Prices firm based on tighter fundamentals
33
100
150
200
250
300
350
400
450
500
550
00
01
02
03
04
05
06
07
08
09
10
11
$ MT
MOP Prices
Blend Grade c&f Brazil
Source: ICIS |
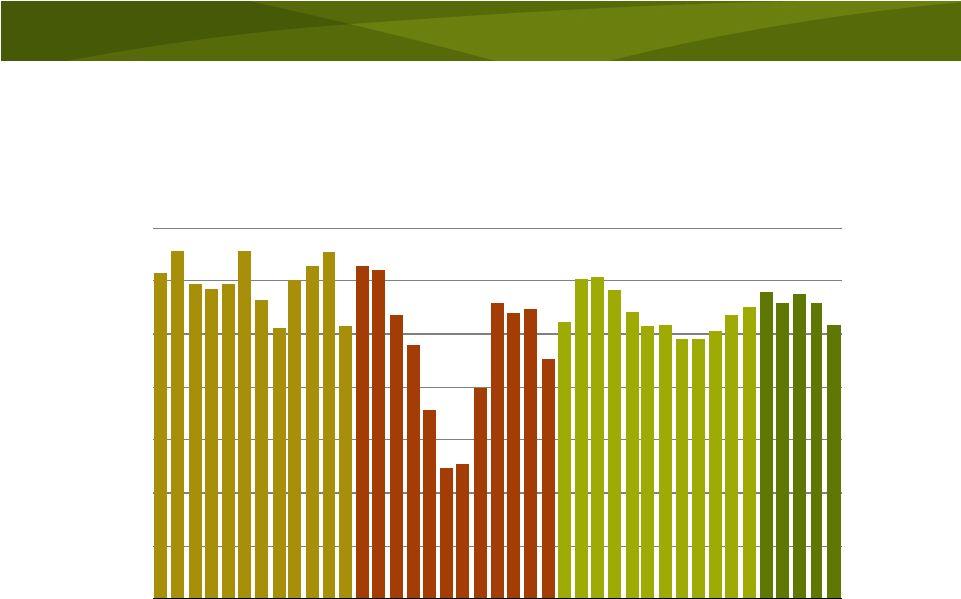
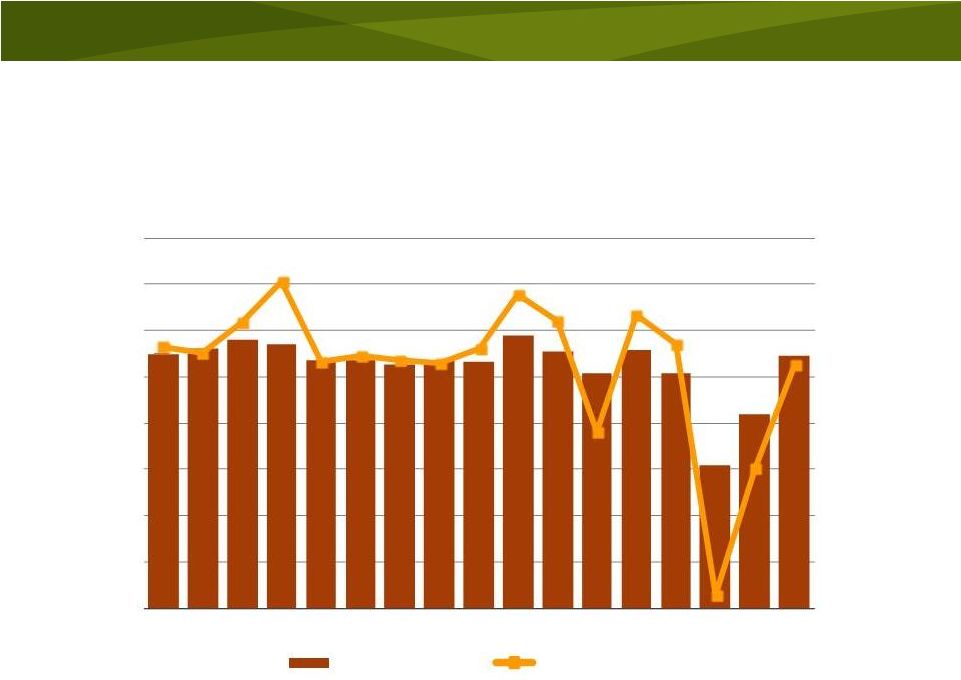
 25
30
35
40
45
50
55
60
95
96
97
98
99
00
01
02
03
04
05
06
07
08
09
10F
11F
Mil Tonnes
KCL
World MOP Shipments
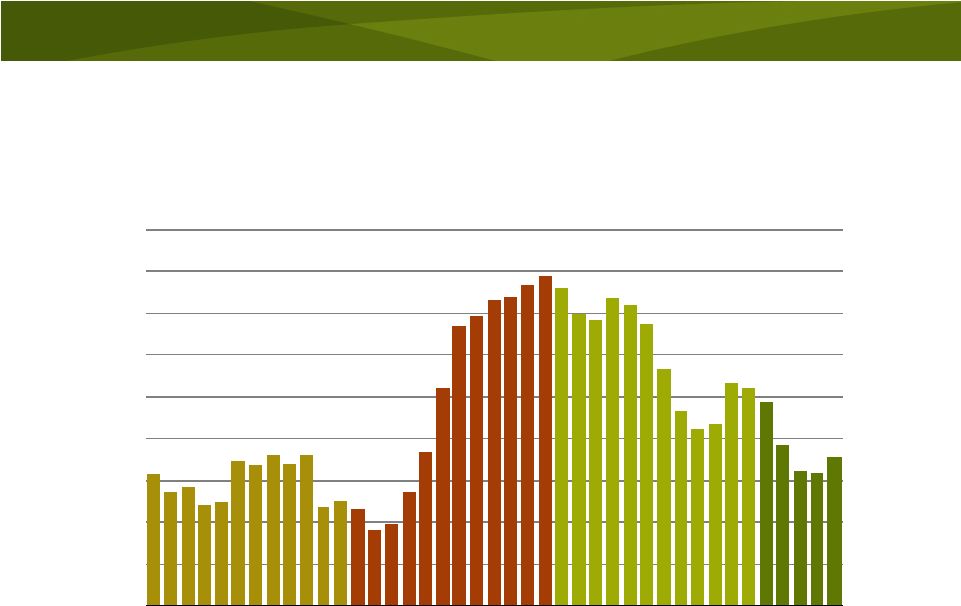
34
Global shipments back on track
Source: Fertecon and Mosaic (Forecast Range for 2011, Trend 1995-2006)
|
 35
0
5
10
15
20
25
30
35
40
95
96
97
98
99
00
01
02
03
04
05
06
07
08
09
10F
11F
Mil Tonnes
KCL
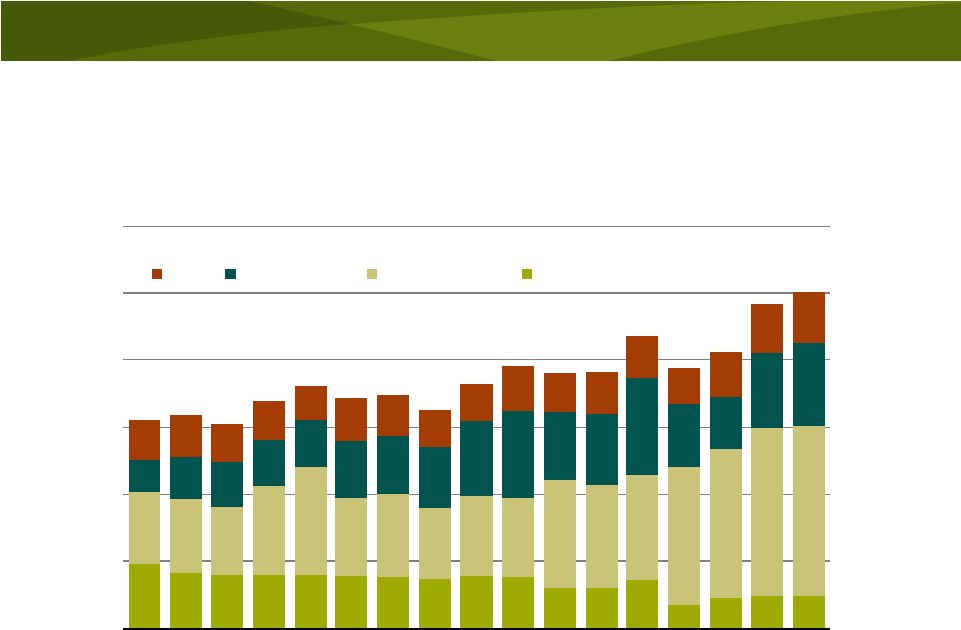
World MOP Import Demand
(excluding Canda > U.S. shipments)
Other
Europe
Latin America
North America
Asia
Source: Fertecon and Mosaic
Second highest world import demand |
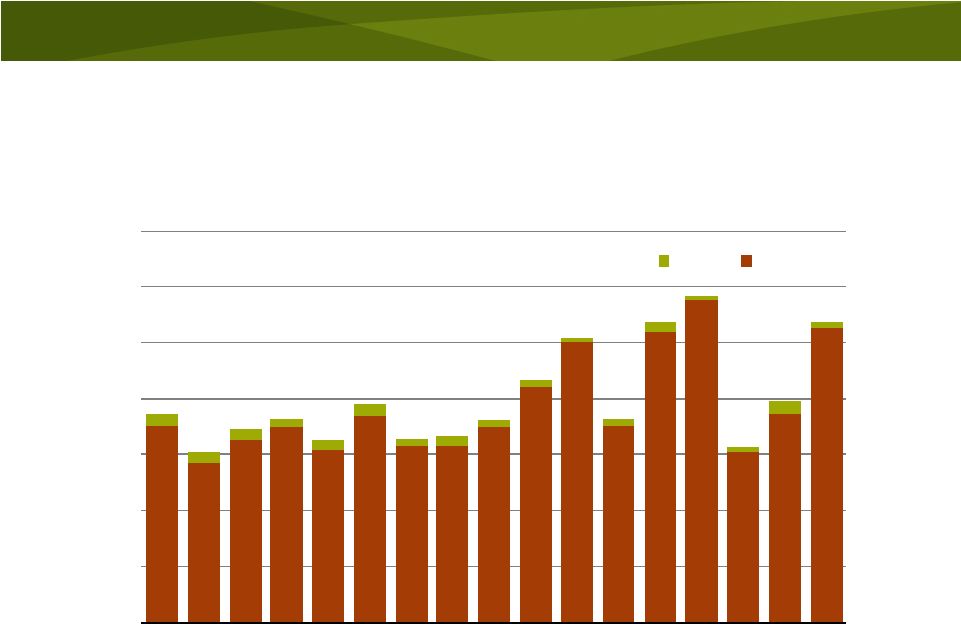 NA
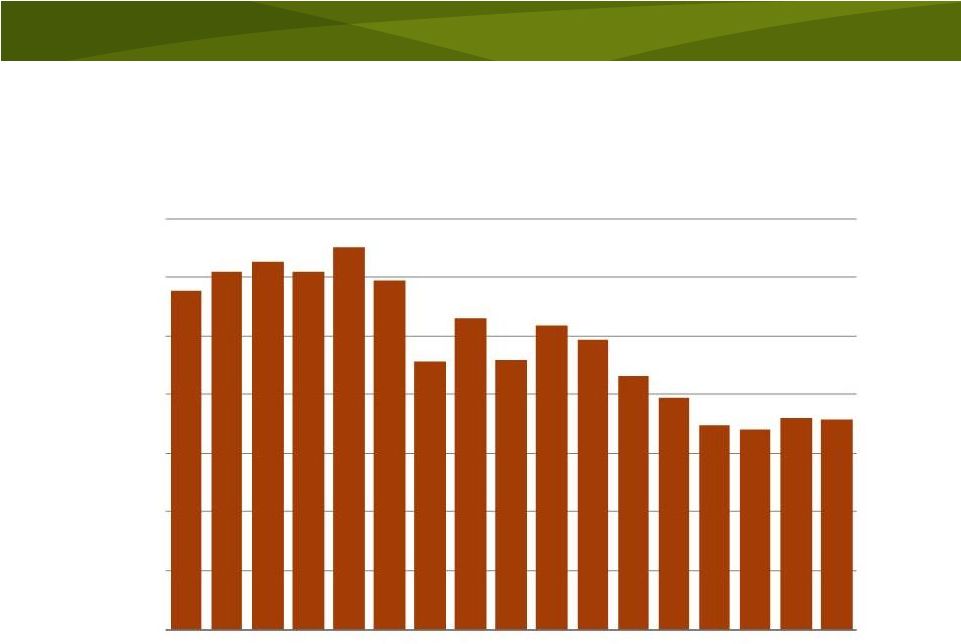
exports projected to increase 36% 36
0
2
4
6
8
10
12
14
95
96
97
98
99
00
01
02
03
04
05
06
07
08
09
10
11F
Mil Tons
KCL
North American MOP Exports
U.S.
Canada
Source: IPNI and Mosaic
Fertilizer Year Ending June 30 |
 NA
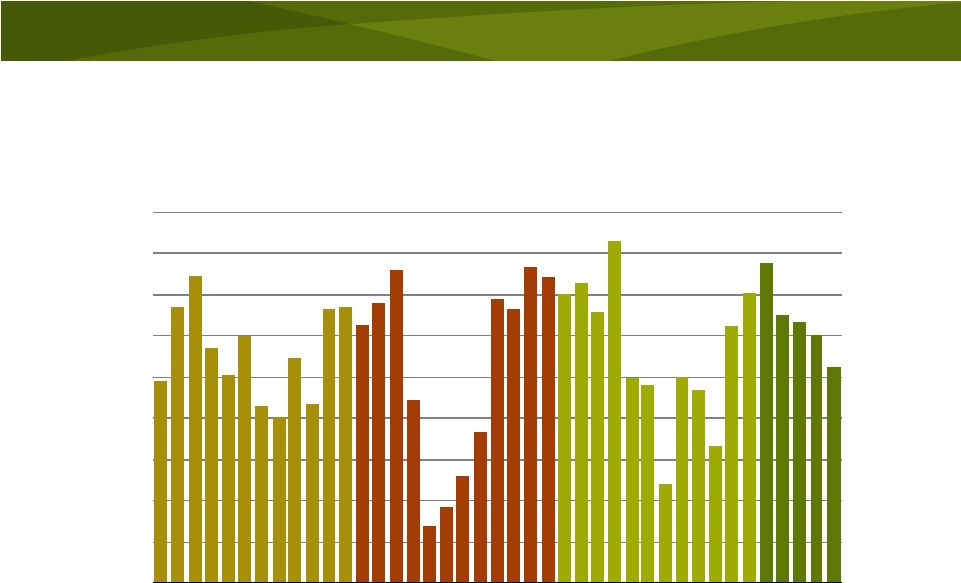
exports up 74% FY 2010/11 YTD 37
0.0
0.2
0.4
0.6
0.8
1.0
1.2
1.4
Jul
07/08
Oct
Jan
Apr
Jul
08/09
Oct
Jan
Apr
Jul
09/10
Oct
Jan
Apr
Jul
10/11
Oct
Mil Tons
KCL
North American MOP Exports
Source: IPNI |
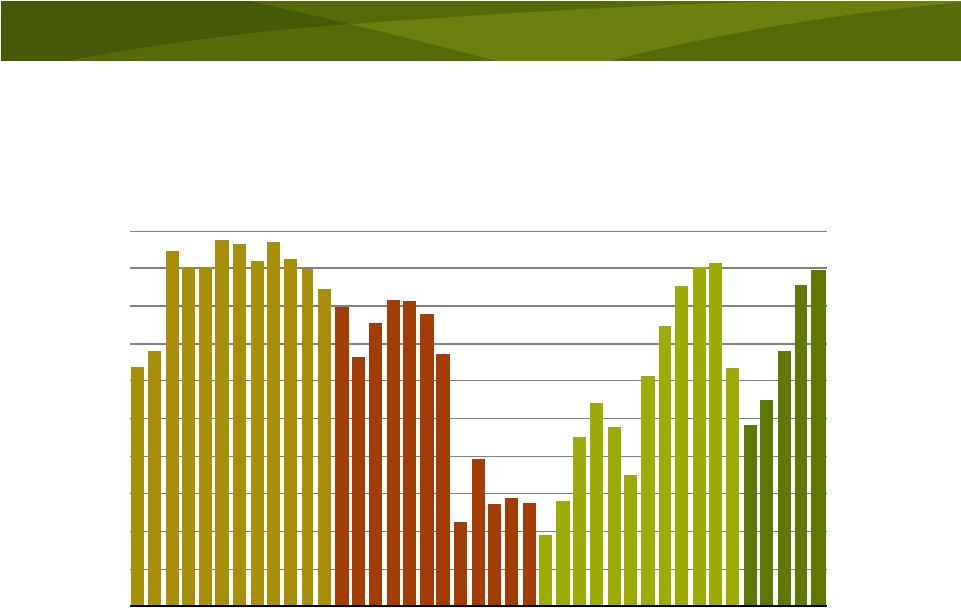
 38
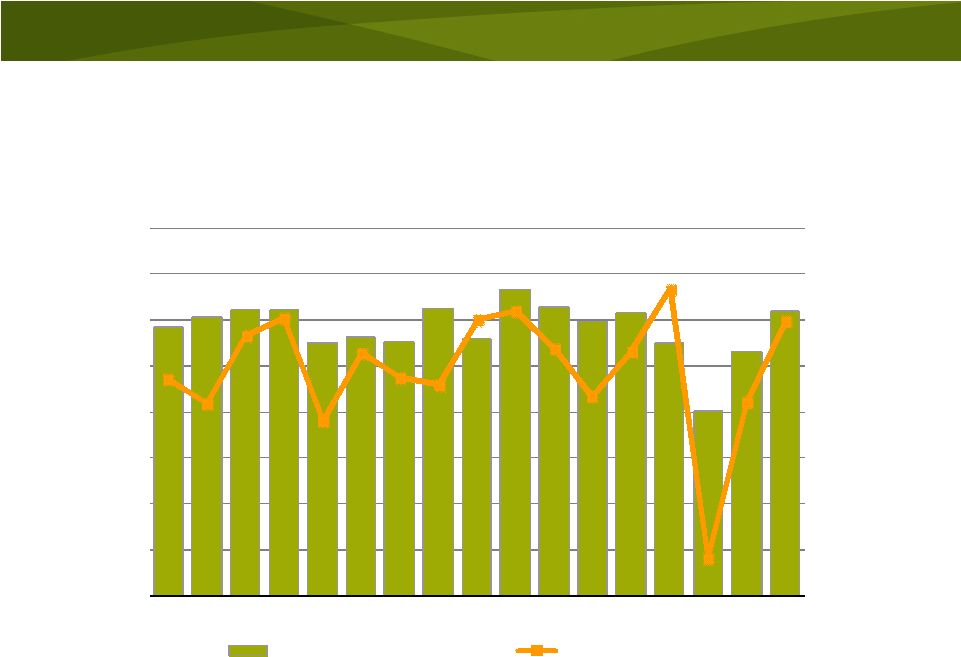
NA shipments forecast to climb another 28%
5
6
7
8
9
10
11
12
13
0.0
1.0
2.0
3.0
4.0
5.0
6.0
7.0
8.0
95
96
97
98
99
00
01
02
03
04
05
06
07
08
09
10
11F
Mil Tons
KCL
Mil Tons
K O
North
American
Potash
Use
and
MOP
Shipments
Ag Use
Total Shipments
Source: IPNI and Mosaic
Fertilizer Year Ending June 30
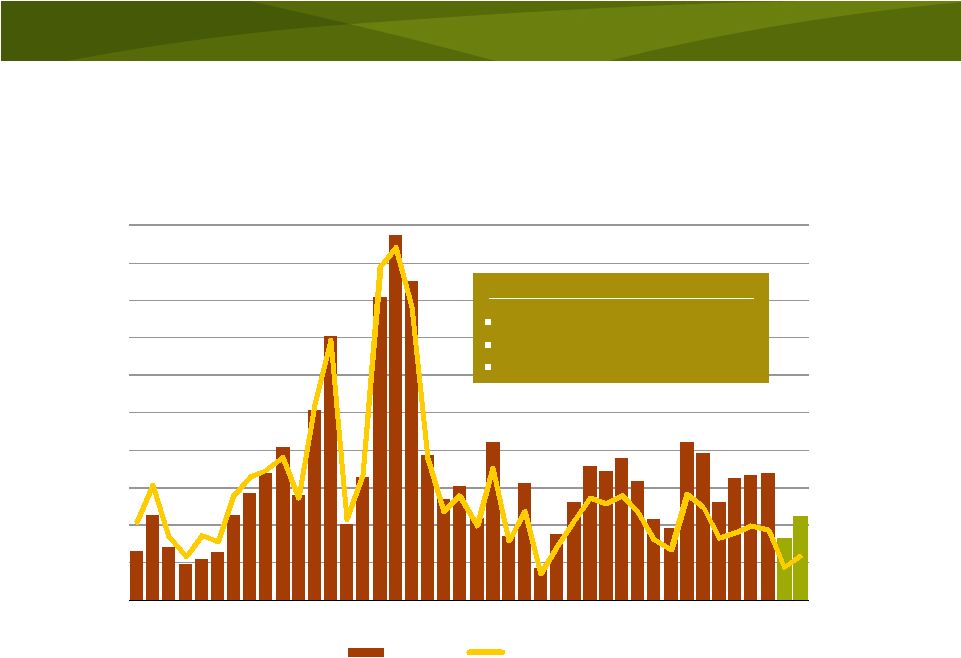
2 |
 “Perfect storm”
fall application season in NA
39
Source: IPNI, US Department of Commerce and Mosaic
0.0
1.0
2.0
3.0
4.0
5.0
6.0
7.0
8.0
Jun
-Nov
Dec-May
Mil Tons
KCl
Implied North American MOP Shipments
5-Yr Min-Max Range
2010/11
5-Yr Average
|
 NA
production up 79% FY 2010/11 YTD 40
0.0
0.2
0.4
0.6
0.8
1.0
1.2
1.4
1.6
1.8
2.0
Jul
07/08
Oct
Jan
Apr
Jul
08/09
Oct
Jan
Apr
Jul
09/10
Oct
Jan
Apr
Jul
10/11
Oct
Mil Tons
KCL
North American MOP Production
Source: IPNI |
 Record NA imports expected in 2010/11
41
0.0
0.2
0.4
0.6
0.8
1.0
1.2
95
96
97
98
99
00
01
02
03
04
05
06
07
08
09
10
11F
Mil Tons
KCL
North American MOP Imports
Source: IPNI, USDOC, and Mosaic
Fertilizer Year Ending June 30 |
 Demand pulls down NA producer inventories
42
0.0
0.5
1.0
1.5
2.0
2.5
3.0
3.5
4.0
4.5
Jul
07/08
Oct
Jan
Apr
Jul
08/09
Oct
Jan
Apr
Jul
09/10
Oct
Jan
Apr
Jul
10/11
Oct
Mil Tons
KCL
North American MOP Producer Stocks
Source: IPNI |
 Bottom Line
Potash shipments are back on track
–
Global shipments forecast to increase to 49.7 MMT in
2010 and to 53-56 MMT in 2011
–
Broad-based demand recovery
–
NA shipments forecast to climb to more than 10.3 MST in
2010/11 based on higher acreage and application rates
–
“Perfect
Storm”
fall
season
in
NA
but
more
than
half
of
projected demand still ahead this spring
Producers struggled to keep up with peak
shipments this fall
Market is expected to remain tight until new
capacity comes online
43 |
 Factors to Watch
Agricultural commodity prices
–
Macroeconomic developments and value of the dollar
–
Weather developments during the next 60 to 120 days
•
Southern Hemisphere: La Nina effect (hot and dry Dec-Feb in
southern Brazil and northern Argentina)
•
Northern Hemisphere: 2011 spring planting conditions
–
A Chinese surprise (i.e. significant corn imports)
–
Grain and oilseed demand destruction
–
Speculative positions (and what might spook the herd)
Phosphate market uncertainties
–
Raw materials costs and availability
–
Indian DAP subsidy for fiscal 2011/12
–
Chinese export supplies
–
Start-up of the Ma’aden facility
–
Resolution of the South Fort Meade mine permit issue
Intangibles
–
Buyer sentiment and price expectations
–
Changes in distribution pipeline inventories
–
P&K demand destruction
44 |
 Phosphate
and
Potash
Market
Volatility
Déjà
Vu All Over Again?
Ohio AgriBusiness
Association and OSU Extension
2011 Crop Production Conference
Columbus, OH
January 6, 2011
Dr. Michael R. Rahm
Vice President, Market and Strategic Analysis
The Mosaic Company
Thank You! |