Attached files
Table of Contents
UNITED STATES
SECURITIES AND EXCHANGE COMMISSION
Washington, D.C. 20549
FORM 10-K
Annual Report Pursuant to Section 13 or 15(d) of the
Securities Exchange Act of 1934
For the Fiscal Year Ended September 30, 2010
Commission File No. 000-16674
IMPERIAL SUGAR COMPANY
(Exact name of registrant as specified in its charter)
| Texas | 74-0704500 | |
| (State or other jurisdiction of incorporation or organization) |
(I.R.S. Employer Identification No.) |
8016 Highway 90-A, P.O. Box 9, Sugar Land, Texas 77487-0009
(Address of principal executive offices) (Zip Code)
Registrant’s telephone number, including area code: (281) 491-9181
Securities registered pursuant to Section 12(b) of the Act:
| Title of each class |
Name of each exchange on which registered | |
| Common Stock, without par value | The NASDAQ Stock Market LLC | |
| Rights to Purchase Preferred Stock | The NASDAQ Stock Market LLC |
Securities registered pursuant to Section 12(g) of the Act:
(Title of class)
None
Indicate by check mark if the registrant is a well-known seasoned issuer, as defined in Rule 405 of the Securities Act. Yes ¨ No x
Indicate by check mark if the registrant is not required to file reports pursuant to Section 13 or Section 15(d) of the Act. Yes ¨ No x
Indicate by check mark whether the registrant (1) has filed all reports required to be filed by Section 13 or 15(d) of the Securities Exchange Act of 1934 during the preceding 12 months (or for such shorter period that the registrant was required to file such reports), and (2) has been subject to such filing requirements for the past 90 days. Yes x No ¨
Indicate by check mark if disclosure of delinquent filers pursuant to Item 405 of Regulation S-K is not contained herein, and will not be contained, to the best of the registrant’s knowledge, in definitive proxy or information statements incorporated by reference in Part III of this Form 10-K or any amendment to this Form 10-K ¨
Indicate by check mark whether the registrant has submitted electronically and posted on its corporate Web site, if any, every Interactive Data File required to be submitted and posted pursuant to Rule 405 of Regulation S-T during the preceding 12 months (or for such shorter period that the registrant was required to submit and post such files). Yes ¨ No ¨
Indicate by check mark whether the registrant is a large accelerated filer, an accelerated filer, a non-accelerated filer, or a smaller reporting company. See the definitions of “large accelerated filer”, “accelerated filer” and “smaller reporting company” in Rule 12b-2 of the Exchange Act.
Large Accelerated Filer ¨ Accelerated Filer x Non-Accelerated Filer ¨ Smaller Reporting Company ¨
Indicate by check mark whether the registrant is a shell company (as defined in Rule 12b-2 of the Act). Yes ¨ No x
The aggregate market value of the voting and non-voting common equity held by non-affiliates of the registrant on March 31, 2010, the last business day of registrant’s most recently completed second fiscal quarter, based on the last reported trading price of the registrant’s common stock on the NASDAQ Stock Market LLC on that date, was approximately $181 million.
There were 12,125,214 shares of the registrant’s common stock outstanding on December 15, 2010.
DOCUMENTS INCORPORATED BY REFERENCE
Portions of the registrant’s definitive proxy statement for registrant’s 2011 Annual Shareholders Meeting are incorporated by reference into Part III of this report.
Table of Contents
| PART I | ||||||
| ITEM 1. |
2 | |||||
| ITEM 1A. |
11 | |||||
| ITEM 1B. |
15 | |||||
| ITEM 2. |
16 | |||||
| ITEM 3. |
16 | |||||
| 18 | ||||||
| PART II | ||||||
| ITEM 5. |
19 | |||||
| ITEM 6. |
20 | |||||
| ITEM 7. |
Management’s Discussion and Analysis of Financial Condition and Results of Operations |
21 | ||||
| ITEM 7A. |
33 | |||||
| ITEM 8. |
34 | |||||
| ITEM 9. |
Changes in and Disagreements with Accountants on Accounting and Financial Disclosure |
35 | ||||
| ITEM 9A. |
35 | |||||
| ITEM 9B. |
36 | |||||
| PART III | ||||||
| ITEM 10. |
37 | |||||
| ITEM 11. |
37 | |||||
| ITEM 12. |
Security Ownership of Certain Beneficial Owners and Management and Related Shareholder Matters |
37 | ||||
| ITEM 13. |
Certain Relationships and Related Transactions, and Director Independence |
37 | ||||
| ITEM 14. |
37 | |||||
| PART IV | ||||||
| ITEM 15. |
37 | |||||
Forward-Looking Statements
Statements regarding future market prices and margins, future expenses and liabilities arising from the Port Wentworth refinery incident, refinery construction costs, timelines and operational dates, future costs and liabilities arising from the Louisiana Sugar Refining LLC venture, future import and export levels, future government and legislative action, future environmental regulatory and compliance costs, future operating results, future availability and cost of raw sugar, our liquidity and ability to finance our operations and capital investment programs, operating efficiencies, results of future investments and initiatives, future cost savings, future product innovations, future energy costs, future pension plan contributions and other statements that are not historical facts contained in this report on Form 10-K are forward-looking statements that involve certain risks, uncertainties and assumptions. These risks, uncertainties and assumptions include, but are not limited to, market factors, farm and trade policy, unforeseen engineering and equipment delays, our ability to obtain financing and the terms of any such financing, our ability to realize planned cost savings and other improvements, the available supply of sugar, energy costs, the effect of weather and economic conditions, results of actuarial assumptions, actual or threatened acts of terrorism or armed hostilities, legislative, administrative and judicial actions and other factors detailed elsewhere in this report and in our other filings with the SEC. Should one or more of these risks or uncertainties materialize, or should underlying assumptions prove incorrect, actual outcomes may vary materially from those indicated. We identify forward-looking statements in this report by using the following words and similar expressions:
| • expect |
• project |
• estimate | ||
| • believe |
• anticipate |
• likely | ||
| • plan |
• intend |
• could | ||
| • should |
• may |
• predict | ||
| • budget |
• possible |
Management cautions against placing undue reliance on forward-looking statements or projecting any future results based on such statements or present or future earnings levels. All forward-looking statements in this report on Form 10-K are qualified in their entirety by the cautionary statements contained in this section and elsewhere in this report.
1
Table of Contents
PART I
| ITEM 1. | Business |
Overview
Imperial Sugar Company was incorporated in 1924 and is the successor to a cane sugar plantation and milling operation founded in Sugar Land, Texas in the early 1800s that began producing granulated sugar in 1843. Imperial Sugar Company (which together with its subsidiaries is referred to herein as the “Company”, “we”, “us”, “our” and “ours”) is one of the largest processors and marketers of refined sugar in the NAFTA region. We refine, package and distribute cane sugar at refineries located in Georgia and Louisiana. For the year ended September 30, 2010, we sold approximately 23 million hundredweight, or cwt, of refined sugar. Additionally, through joint venture operations, we market sugar and other sweeteners in Mexico and Canada.
We offer a broad product line and sell to a wide range of customers directly and indirectly through wholesalers and distributors. Our customers include retailers, restaurant chains, distributors and industrial customers, principally food manufacturers. Our products include granulated, powdered, liquid and brown sugars marketed in a variety of packaging options (6 oz shakers to 50-pound bags and in bulk) under various brands (Dixie Crystals®, Imperial® and Holly® ) or private labels. In addition, we market organic and fair trade sweeteners and a sugar/stevia sweetener blend through joint ventures.
The Company experienced an industrial accident on February 7, 2008, at its sugar refinery in Port Wentworth, Georgia, which is located near Savannah, Georgia. Production at the refinery, which comprises approximately 60% of our capacity, was suspended after the accident until we commenced limited bulk sugar production in the summer of 2009 and initiated packaging production in the fall of 2009.
In November 2009, we entered into a joint venture agreement that will result in the vertical integration of our Gramercy, Louisiana refining operation with our Louisiana raw sugar supplier. Under the terms of the agreement, in January 2011 we will contribute our Louisiana refinery to the joint venture, which is constructing a new cane sugar refinery adjacent to the existing refinery. Please read “—Joint Venture Operations”.
Overview of the Domestic Sugar Industry
Refined sugar can be produced by either processing sugar beets or refining raw sugar produced from sugar cane. The profitability of cane and beet sugar operations is affected by government programs designed to support the price of domestic crops of sugar cane and sugar beets. Approximately 75% of domestic sugar demand is supplied by domestic crops, with the balance provided by Mexican imports under the North American Free Trade Agreement, or NAFTA, and foreign imports under a U.S. quota program.
Cane Sugar Production Process
Sugar cane is grown in tropical and semitropical climates throughout the world as well as domestically in Florida, Louisiana, Texas and Hawaii. Sugar cane is processed into raw sugar by raw cane mills promptly after harvest. Raw sugar is approximately 98% sucrose and may be stored for long periods and transported over long distances without affecting its quality. Raw sugar imports are limited by United States government programs.
Cane sugar refineries like those we operate purify raw sugar to produce refined sugar. Operating results of cane sugar refineries are driven primarily by the spread between raw sugar and refined sugar prices and by the conversion and other costs of the refining process.
Government Regulation
Federal government programs have existed to support the price of domestic crops of sugar beets and sugar cane almost continually since 1934. The regulatory framework that affects the domestic sugar industry includes
2
Table of Contents
the Food Conservation and Energy Act of 2008, known as the 2008 Farm Bill. The 2008 Farm Bill provides for loans on sugar inventories to first processors (i.e., raw cane sugar mills and beet processors), implements a tariff rate quota that limits the amount of raw and refined sugar that can be imported into the United States, and imposes marketing allotments on sugar beet processors and domestic raw cane sugar producers except under certain circumstances. NAFTA provides that sugar can be imported from or exported to Mexico duty free after January 1, 2008. Please read “—Sugar Legislation and Other Market Factors.”
Domestic Supply and Demand
Domestic demand for refined sugar has increased at a compound annual growth rate of 1.7% during the past five years. Demand for refined sugar has historically been consistent with population growth and is influenced by consumer preferences for sugar versus alternative sweeteners and dietary trends. In recent periods, a declining domestic consumption of high fructose corn syrup, or HFCS, has resulted in increased demand for refined sugar.
Domestic sugar supplies are most significantly influenced by the size of the domestic sugar beet crop, USDA import quotas and, in recent years, the availability of Mexican surpluses for import under NAFTA. Based on data published by the U.S. Department of Agriculture, or USDA, beet sugar production for the past five years has ranged from 39.7% to 49.4% of domestic demand, and is forecasted for crop year 2010/2011 to be 43.4%. Mexican imports during the same five-year period have ranged from 1.5% to 13.2% of U.S. demand, and are estimated by the USDA to be 11.3% in crop year 2010/2011. Current USDA supply and demand estimates forecast a relatively tight U.S. sugar supply in crop year 2010/2011 with ending stocks-to-use ratio of 13.4% at September 30, 2011 compared to 13.3% at September 30, 2010.
Domestic Refined Sugar Prices
Large sugar beet crops have historically led to relatively low refined sugar prices and small crops have led to relatively high refined sugar prices. Recently, the availability of Mexican sugar for import under NAFTA has also influenced supplies and prices in the U.S. A tightening U.S. supply/demand balance as reflected in USDA projections, as well as higher domestic raw sugar costs attributable to domestic as well as world market factors, have resulted in rising domestic prices during fiscal 2010. We cannot predict the duration of any pricing trend or the effect a sustained trend may have on the sugar industry. Please read “Management’s Discussion and Analysis of Financial Condition and Results of Operations”.
Raw Sugar Availability and Prices
Raw sugar is produced domestically or imported under limitations imposed in the 2008 Farm Bill, subject to minimum levels established in trade treaties. The price and availability of raw sugar to U.S. refiners is dependent on the size of the domestic sugar cane crop and the level of imports. Domestic raw sugar prices increased during the past 18 months to their highest levels in 30 years in part the result of a shortage in the world raw sugar market. We cannot predict the duration of any pricing trend or the effect a sustained trend may have on the sugar industry.
Our Products and Customers
Sugar Products
Imperial Sugar is one of the largest processors and marketers of refined sugar in the United States. Refined sugar is our principal product line and accounted for approximately 98% of our consolidated net sales for the year ended September 30, 2010. We produce refined sugar from raw cane sugar and market our sugar products to retailers, distributors and industrial food manufacturers directly through our sales force and indirectly through wholesalers and independent brokers. No customer accounted for more than 10% of our net sales in fiscal 2010.
We maintain sales offices at our headquarters in Sugar Land, Texas, in Port Wentworth, Georgia and at regional locations across the United States. Sales are accomplished through a variety of methods, including direct negotiation, publishing price lists, competitive bidding processes and trade promotions. We consider our marketing and promotional activities important to our overall sales effort and we advertise our brand names in
3
Table of Contents
print media, radio, internet websites and social media. We also distribute various promotional materials, including discount coupons and recipes.
We developed new, innovative products to our customers and consumers. Sugar packaging has not experienced as much innovation as some other consumer categories, and we believe that we can increase our share of retail sales and margins by offering consumers value-added products that provide easier usage and storage. We have introduced a number of new products in the past few years, including a stand-up pouch line, shaker lines for both consumer and foodservice distribution and a package of pre-measured, one-quarter cup envelopes of brown sugar.
Retail Sales—We produce and sell granulated white, brown and powdered sugar to retailers and distributors in packages ranging from 6 oz shakers to 50-pound bags. Retail packages are marketed under the trade names:
| • | Dixie Crystals® |
| • | Imperial® |
| • | Holly® |
Retail packages are also sold under retailers’ private labels, generally at prices lower than those for branded sugar. Core geographies for our branded sugar and private label products include the Southeast and Southwest United States. Our primary business strategy is to capitalize on our well-known brands and expand brand penetration through product and packaging innovation. Sales of refined sugar products to retail customers accounted for approximately 28% of our refined sugar sales revenue in fiscal 2010. Sales made to retail customers in the year ended September 30, 2010, were approximately 35% branded and 65% private label.
Industrial Sales—We produce and sell refined sugar, molasses and other ingredients to industrial customers, principally food manufacturers, in bulk, packaged or liquid form. Food manufacturers purchase sugar for use in the preparation of confections, baked products, frozen desserts, cereal, dairy products, canned goods, beverages and various other food products. Historically, we have made the majority of our sales to industrial customers under fixed price, forward sales contracts with terms of up to one year. Industrial sales generally provide lower margins than retail and distributor sales. For the year ended September 30, 2010, our sales of refined sugar products to industrial customers accounted for approximately 52% of our refined sugar sales revenue.
Distributor Sales—We sell a variety of sugar products (including granulated, powdered and brown sugar) in package sizes ranging from one-pound packages to 50-pound bags to foodservice and industrial distributors who in turn sell those products to manufacturers, restaurants and institutional foodservice establishments. For the year ended September 30, 2010, our sales of refined sugar products to distributors accounted for approximately 20% of our refined sugar sales revenue. Under the terms of a non-compete agreement negotiated in connection with the sale of a business, we agreed not to sell individual servings of sugar and certain non-sugar products for a period of time ending in 2012, in exchange for an agreed upon volume purchase requirement of the Company’s refined sugar from the other party. The agreement allows the Company to begin selling individual servings of sugar and certain non-sugar products upon certain notice requirements and an agreed reduction in the customer’s purchase obligation.
Joint Venture Operations
Wholesome Sweeteners—We have a 50% percent equity interest in Wholesome Sweeteners, Inc., a company with approximately $100 million of sales in the most recent fiscal year of organic, fair trade and other natural sweeteners in the U.S. and Canada. Wholesome’s product portfolio includes organic cane sugar, agave syrup, honey and other specialty sweeteners. Sustained growth has been achieved through the regular introduction of new products and the expanded interest in organic and natural food by North American consumers. Wholesome’s management believes that it has the largest share of the organic sugar business in the U.S. and Canada. We report our share of Wholesome’s earnings on the equity method of accounting. Additionally, we have an option until May 2011 to purchase the remaining 50% of Wholesome’s equity at a fixed multiple of earnings.
4
Table of Contents
Commercializadora Santos Imperial—In November 2007, we formed a 50/50 joint venture with Ingenios Santos, S.A. de C.V., or Santos, that markets sugar products in Mexico and the U.S. under the name Comercializadora Santos Imperial S. de R.L. de C.V., or CSI. With the elimination of certain NAFTA tariffs on sugar imported from and exported to Mexico in January 2008, the U.S. and Mexico effectively became a single sales region. Santos owns and operates five sugar mills that produce refined sugar and estandar, a less refined sugar traditionally sold in Mexico. The agreement provides that Santos and Imperial will market all their respective sugar products sold in Mexico through the joint venture. The joint venture entity also exports Santos’ sugar products to the U.S., which are marketed by the Company or may be used as a raw material in our U.S. refineries. We report our share of CSI’s earnings on the equity method of accounting.
Louisiana Sugar Refining—In November 2009, we completed the formation and funding of a three-party joint venture with Sugar Growers and Refiners, Inc., or SUGAR, and Cargill, Incorporated or Cargill to construct and operate a new 3,100 ton per day cane sugar refinery in Gramercy, Louisiana adjacent to our existing sugar refinery.
The venture, Louisiana Sugar Refining, LLC, or LSR, is owned one-third by each member, each of which agreed to contribute $30 million in cash or assets as equity to capitalize the venture. SUGAR’s contribution was $30 million cash; Cargill contributed $23.5 million cash and certain equipment and intellectual property valued at $6.5 million. Our contribution, which will occur in three stages, consists of the existing refinery assets with a book value of approximately $27.9 million at September 30, 2010, including approximately 207 acres of land.
We will operate the existing refinery with sales and earnings for our own account until December 31, 2010, during which time we were required to complete certain improvements. The equipment and personal property in the existing refinery (other than the small bag packaging assets) will be contributed to LSR on January 1, 2011. After January 1, 2011, we will continue to operate the small bag packaging facility in Gramercy, with 3.5 million cwt of refined bulk sugar purchased from LSR under a long term, supply agreement with market-based pricing provisions.
We contributed the footprint parcel of approximately 7 acres of land for the new refinery at LSR’s formation. Terms of the operative agreements require that LSR and Imperial jointly enroll the entire site (including the footprint parcel) in the Voluntary Remediation Program, or VRP, of the Louisiana Department of Environmental Quality, or LDEQ, to conduct an environmental assessment of the site and complete remediation of any identified contamination. We are required to pay for the cost of remediation, if the VRP uncovers contamination above the applicable industrial standard. We will convey the remainder of the land to LSR upon completion of the VRP and be released of future environmental liabilities to state and federal authorities. The VRP site assessment is underway to determine the extent of required remediation.
LSR has entered into financing agreements aggregating $145 million to provide construction and working capital financing for the project. The financing is non-recourse to LSR’s members. The members have agreed to proportionately contribute additional capital to LSR if necessary to cover certain construction cost overruns and certain costs relating to the VRP that LSR agreed to assume. Construction costs of the new refinery, which is expected to commence operations in the summer of 2011, are estimated at $120 million. The existing Gramercy refinery will operate during the construction and start-up phase of the new refinery. LSR’s raw cane sugar will be supplied by SUGAR through an evergreen raw sugar supply agreement. Cargill will serve as marketer of the refined sugar produced by LSR, other than refined sugar sold to Imperial.
Natural Sweet Ventures—In February 2010, we formed Natural Sweet Ventures, or NSV, a 50/50 joint venture with Pure Circle Limited to develop and commercialize sugar/stevia sweetener blends for sale in the NAFTA region. Stevia is an all natural, zero calorie, high intensity sweetener extracted from the leaf of the stevia plant. NSV has produced products at various blend levels and provided samples to a number of food manufacturers for testing by their product development groups. Additionally, we initiated a retail trial of Steviacane tm in November 2010. We can give no assurance as to the ultimate market acceptance of these products or the results of NSV.
5
Table of Contents
Operational Facilities
We own and operate two cane sugar refineries. Each facility has packaging and distribution capabilities, is served by adequate transportation and maintained in good operating condition. The Company experienced an industrial accident on February 7, 2008, at its sugar refinery in Port Wentworth, Georgia, which is located near Savannah, Georgia. Production at the refinery, which comprises approximately 60% of our capacity, was suspended after the accident until we commenced sustained liquid bulk sugar production in late June 2009. Granulated bulk sugar production was initiated in late July 2009 and granulated packaged production on certain lines began in September 2009.
The following table shows the location, current capacity and production of our cane sugar refineries:
| Cane Sugar Refineries |
Approximate Daily Raw Sugar Melt Capacity (cwt) |
Fiscal 2010 Production (cwt) |
Fiscal 2009 Production (cwt) |
Fiscal 2008 Production (cwt) |
Fiscal 2007 Production (cwt) |
|||||||||||||||
| Port Wentworth, Georgia |
63,000 | 12,494,000 | 1,146,000 | 4,930,000 | 14,510,000 | |||||||||||||||
| Gramercy, Louisiana |
45,000 | 10,646,000 | 11,707,000 | 11,802,000 | 11,075,000 | |||||||||||||||
| Total |
108,000 | 23,140,000 | 12,853,000 | 16,732,000 | 25,585,000 | |||||||||||||||
We also operate a distribution facility in Ludlow, Kentucky and we contract for throughput and storage at a number of warehouses and distribution stations. Co-packers are used under contract for small volume specialty products.
Raw Materials and Processing Requirements
Raw Cane Sugar
We currently purchase raw cane sugar from domestic sources of supply located in Louisiana, as well as from various foreign countries. The availability of foreign raw cane sugar for domestic consumption is determined by the import quota level designated by applicable regulation, as well as the provisions of NAFTA and other treaties. In fiscal 2010, we purchased substantially all of our raw sugar needs for our Port Wentworth, Georgia refinery from foreign sources under annual or spot contracts with traders. We expect to purchase substantially all of our requirements for our Port Wentworth facility from foreign sources in the foreseeable future.
Historically, substantially all of our purchases of domestic raw sugar and raw sugar quota imports were priced based upon the Intercontinental Exchange (ICE) Sugar No. 16 futures contract or its predecessor, the Sugar No. 14 futures contract. Non-quota imports under the re-export program, which constitute less than 10% of our raw sugar purchases, are priced based on the ICE Sugar No. 11 futures contract. The terms of raw cane sugar purchase contracts vary. Raw cane sugar purchase contracts can provide for the delivery of a single cargo or for multiple cargoes over a specified period or a specified quantity over one or more crop years. Contract terms may provide for fixed prices but generally provide for prices based on the futures market during a specified period of time. Contracts require delivery to the Company’s facility and provide for a premium if the quality of the raw cane sugar is above a specified grade or a discount if the quality is below a specified grade. Contracts based on the No. 16 contract provide that the seller pays freight, duties, insurance charges and other costs of shipping. Substantially all of the raw sugar requirements for our Gramercy, Louisiana refinery in fiscal 2010 were supplied by SUGAR, the cane sugar growing and milling cooperative which is our partner in LSR. The supply contract expires concurrent with our contribution of the Gramercy refinery to LSR on December 31, 2010 and provides for pricing of the majority of the raw sugar based on a margin on sales prices of refined sugar, rather than the raw sugar futures market prices.
The majority of our industrial sales and a portion of our distributor sales are made under fixed price, forward sales contracts. In order to mitigate price risk in raw and refined sugar commitments, we manage the volume of refined sugar sales contracted for future delivery in relation to the volume of raw cane sugar purchased
6
Table of Contents
for future delivery by entering into forward purchase contracts to buy raw cane sugar at fixed prices and by using raw sugar futures contracts.
We have access to approximately 226,000 short tons of aggregate raw sugar storage capacity: 80,000 short tons of storage at our Gramercy, Louisiana refinery and 146,000 short tons of storage capacity at our Port Wentworth, Georgia refinery. At Port Wentworth, we have the capability to segregate our raw sugar inventory, which allows us to store bonded sugar. Bonded sugar is sugar that is not entered as an import at the time of arrival, but stored in a bonded warehouse under U.S. federal customs service regulations for entry at a later time.
Energy
Sugar refining is an energy intensive process. We use natural gas at our Gramercy, Louisiana refinery and coal and natural gas in the Port Wentworth refinery. Fiscal 2010 energy usage, which was impacted by the startup of the Port Wentworth refinery, consisted of 4.2 million mmbtu of natural gas and 0.6 million mmbtu of coal.
In December 2007, we entered into a five-year, fixed price coal contract (subject to escalation factors based on mining costs and quality adjustments). The supplier is currently not performing under the contract, which has resulted in the Company filing a lawsuit against the supplier and necessitating the purchase of coal at higher current prices. Rail freight for coal supplies is generally contracted annually. Natural gas is contracted on a monthly basis. Pricing of natural gas generally is indexed to a spot market index, and we use financial tools such as futures, options, swaps and caps in an effort to stabilize the price for gas purchases under indexed contracts. Energy prices have been volatile in recent years and we cannot predict future energy prices or the effect that rising energy prices may have on our business in the future.
Seasonality
Sales of refined sugar are somewhat seasonal, normally increasing during the first and fourth fiscal quarters because of increased demand of various food manufacturers and consumer retail demand. Shipments of brown and powdered sugar increase in the first fiscal quarter due to holiday baking needs. Our second fiscal quarter ending March 31 historically experiences lower revenues and earnings than our other fiscal quarters as a result of reduced demand for refined sugar, margin reduction from product mix changes and lower absorption of fixed costs of our cane refineries.
Sugar Legislation and Other Market Factors
Our business and results of operations are substantially affected by market factors, principally the domestic prices for refined sugar and raw cane sugar. These factors are influenced by a variety of forces, including domestic supply, prices of competing crops, weather conditions and U.S. farm and trade policies.
The principal legislation supporting the price of domestic crops of sugar cane and sugar beets is the Food Conservation and Energy Act of 2008, otherwise known as the 2008 Farm Bill, which became effective October 1, 2008 and expires September 30, 2013. Imports of raw and refined sugars are controlled via a Tariff Rate Quota (“TRQ”), which is implemented under Additional U.S. Note 5 of Chapter 17 of the Harmonized Tariff Schedule of the United States and does not expire.
The TRQ limits the amount of raw and refined sugar that can be imported into the United States, subject to a minimum amount mandated under the General Agreement on Tariffs and Trade, by imposing a tariff, currently $15.36 per cwt, on over-quota sugar, which historically made its import uneconomical. The USDA reports that 210,000 tons of non-TRQ imports were made during 2010, as the spread between the domestic and world raw sugar prices widened significantly. The government administers the sugar program by adjusting duties and quotas for imported sugar to maintain domestic sugar prices at a level that discourages loan defaults under the
7
Table of Contents
non-recourse loan program. To the extent a processor sells refined sugar for export from the United States, it is entitled to import an equivalent quantity of non-quota eligible foreign raw sugar that would not be subject to the tariff.
Domestic sugar regulations have a number of important provisions:
| • | Non-recourse Loan Program. The 2008 Farm Bill provides for a loan program covering sugar cane and sugar beet crops. The program authorizes the Commodity Credit Corporation, or CCC, a federally owned and operated corporation within the USDA, to extend loans to first-processors of domestically grown sugar cane and sugar beet crops (i.e., raw sugar mills and sugar beet processors) secured by sugar inventories from current-year crop production. The Company is not eligible to participate in this loan program. During the term of the 2008 Farm Bill, national average loan rates are to increase from 18 cents per pound for raw cane sugar in 2008 to 18.75 per pound in 2011, while loan rates for refined beet sugar are established at 128.5% of the raw cane sugar rate. CCC loans are non-recourse in most circumstances and mature the earlier of nine months after the date of the loan or September 30th each year. The program provides price support to the first-processor by effectively enabling the sale of raw cane sugar and refined beet sugar by forfeiture of the collateral at the respective loan rates in the event that market prices drop below that level. |
| • | Marketing Allotments. The 2008 Farm Bill provided that marketing allotments on sugar beet processors and domestic raw cane sugar producers who supply raw sugar may be imposed by the USDA, but that allocation under these allotments may not initially be less than 85% of domestic consumption. Marketing allotments can have the effect of reducing the amount of domestic sugar that is available for marketing and are intended to strengthen sugar prices. Marketing allotments were in force in fiscal 2010 and continue to be in force for fiscal 2011. The USDA can adjust allotments for changes in domestic production or consumption projections. |
| • | TRQ Administration. Provisions of the 2008 Farm Bill require that the TRQ be established at the beginning of any crop year at World Trade Organization minimum of 1.25 million tons and maintain that level until March 31, unless a supply emergency is declared by the USDA. Additions to the TRQ (above the minimum levels) are required to be allocated to raw cane sugar imports until such point that domestic cane sugar refiners are operating at full capacity. |
The 2008 Farm Bill requires that the USDA operate its non-recourse sugar loan program so as to avoid forfeiture of sugar to the CCC to the maximum extent possible. This is normally done by restriction on the amount of sugar imported under the TRQ and if that is not sufficient, by restrictions on the amount of sugar that may be marketed by domestic producers. In a more rarely used option, if the USDA has taken sugar in default under price support loans, it also has the authority to accept bids from sugar cane and sugar beet processors to obtain raw cane sugar or refined beet sugar in CCC inventory in exchange for reduced production of raw cane sugar or refined beet sugar. This payment-in-kind authority, if employed by the USDA, effectively moves inventories of CCC-owned sugar back into commerce without increasing overall supply. Another provision of the 2008 Farm Bill requires the USDA to divert surplus sugar from the marketplace to the production of ethanol.
Free Trade Initiatives
NAFTA provided for the termination of sugar duties and quotas, so that sugar began to be freely traded without duty between the United States and Mexico in January 2008. Notwithstanding the existing import restrictions under the 2008 Farm Bill, the USDA has the right to re-allocate import levels among foreign countries if it deems the demand/supply situation within the United States warrants such action.
In addition to NAFTA, a number of other trade initiatives and negotiations involving the Americas and other quota holding countries are evolving. In 2005, the United States enacted the Central American-Dominican Republic Free Trade Agreement, or CAFTA-DR. Duty-free access to sugar from CAFTA-DR countries increased 109,000 metric tons over the previous amount during the first year, growing to a 151,000 metric ton increase over the first 15 years and 2,640 metric ton increases each year thereafter.
8
Table of Contents
There are additional agreements signed with Panama and Colombia which await Congressional approval. It is not known at this time when and if that approval will be granted. Additionally, a World Trade Organization round of negotiations continues. The impact of these negotiations is unknown at this time, but they could provide for additional raw sugar and/or refined sugar access into the United States. Generally, to the extent that additional sugar imports are in the form of raw sugar, such additional access would have a beneficial effect on our access to raw sugar. To the extent that such additional access is in the form of refined sugar, such product will be competitive with our product offerings.
Environmental Regulation
Our operations are governed by various federal, state and local environmental regulations and these regulations impose effluent and emission limitations, and requirements regarding management of water resources, air resources, toxic substances, solid waste and emergency planning. We make application for environmental permits required under federal, state and local regulations and we have obtained or have filed for environmental permits as required in Georgia and Louisiana. Additional expenditures may be required to comply with future environmental protection standards for current operating facilities, although the amount of any further expenditure cannot be fully estimated.
In conjunction with the contribution of our Gramercy, Louisiana refinery to LSR, we have enrolled the site in the VRP with the LDEQ. As part of the VRP, we have undertaken an environmental assessment to determine if the site contains contamination above the applicable industrial standard. If such contamination is detected, we are required to pay for the cost of remediation. The VRP site assessment is underway to determine the extent of required remediation. Upon completion of the VRP, the Company and LSR would be released from federal and state environmental obligations for the site.
Process wastewater from our Port Wentworth refinery is treated and discharged by another industrial company in the port under a contract for such services. The industrial company has given notice of termination of the contract effective August 2013, and we will either need to negotiate a new contract or make other arrangements for treatment and discharge of process wastewater. If a new contract for treatment cannot be negotiated, additional expenditures for treatment and discharge of process wastewater may be required, although the amount and timing of any such expenditures cannot currently be estimated.
The Company has permits that govern its discharge of cooling and storm water at the Port Wentworth refinery. The State of Georgia Department of Natural Resources Environmental Protection Division, or EPD, issued a notice of violation and a proposed fine of $45,000 in connection with discharges of excess sugar by the Company under its permits. The Company is in negotiations regarding the proposed fine and a comprehensive plan to assure full compliance with these permits and future environmental standards applicable to cooling and storm water. Additional expenditures may be required to comply with current and future permits and environmental standards associated with cooling and storm water, although the amount and timing of any further expenditure cannot currently be estimated.
In December 2010, LDEQ issued a Consolidated Compliance Order and Notice of Potential Penalty to the Company alleging violations of state environmental regulations and the terms of the wastewater discharge permit for the Company’s Gramercy, Louisiana refinery. The alleged violations relate to the release of foam into waters of the state and exceedances of applicable criteria for dissolved oxygen and pH. Issuance of a penalty assessment is being considered by LDEQ for the alleged violations. The Company is investigating the alleged violations, has taken measures to cease and contain the foam discharge, and is coordinating with the LDEQ to develop and implement a plan to remove and dispose of the foamy material and achieve and maintain compliance with the terms of its discharge permit and applicable regulations.
Health and Safety Regulation
Our operations are subject to a number of federal, state and local health, safety and food safety regulations that are designed to protect workers, customers and consumers of our products. In order to comply with these
9
Table of Contents
regulations, we have developed specific operating and maintenance procedures and are required to maintain records and report data on a timely basis. Additionally, we have made capital investment in the past and may be required to make additional investments in the future to comply with such regulations. Health, safety and food safety regulations are subject to change in the future and may require modifications of procedures or additional capital expenditures to comply with new requirements. Current regulatory efforts include OSHA’s development of a comprehensive combustible dust standard and pending federal legislation to address food safety matters. We are unable to predict the impact which these or other changes may have on our operating result, cash flow or financial position.
In July 2010, we settled OSHA citations arising from investigations of our refineries following the 2008 Port Wentworth industrial accident. While making no admission of liability, the Company agreed to pay penalties aggregating $6.05 million in four quarterly installments commencing in August 2010. Pursuant to the settlement, we agreed to abate the citations by December 31, 2010. In addition, we agreed to implement certain other measures related to worker and facility safety.
Research
We operate research and development centers in Sugar Land, Texas and Port Wentworth, Georgia where we conduct research relating to:
| • | manufacturing process technology; |
| • | factory operations; and |
| • | new product development. |
Intellectual Property
The Company engages in research and development activities for proprietary processes and products, including product purification and new sweetener products. The Company has filed patents on several of these technologies, including patents directed toward the manufacture of high-purity sugar products. Additionally, the Company has filed patents for processes used for the generation of reduced calorie natural sweeteners, as well as the products resulting from these processes including stevia extract/sugar blends. Such patents related to stevia extract/sugar blends have been exclusively licensed to NSV.
Competition
We compete with other cane sugar refiners and with beet sugar processors and, in certain product applications, with producers of other nutritive and non-nutritive sweeteners, such as HFCS, polyols, aspartame, saccharin, sucralose, acesulfame-k and stevia. We also compete with resellers and packaging operations in distributing bag sugar products. Our principal business is highly competitive, where the selling price and our ability to supply a customer’s needs in a timely fashion are important competitive considerations. Freight costs to transport products can affect our sales. Some of our competitors have an advantage of owning all or part of the agricultural production supplying their refined sugar requirements. We believe our key sugar competitors are Domino® Foods, Inc. and United Sugars Corporation. The principal suppliers of HFCS in North America are Cargill, Inc., Archer Daniels Midland Company and Corn Products, Inc.
Employees
On November 30, 2010, we employed 694 employees. Our Port Wentworth, Georgia refinery employs non-union labor while substantially all of the refinery employees at our Gramercy, Louisiana refinery are covered by a collective bargaining agreement which expires in February 2012.
In December 2010, the union which represents certain of the Company’s hourly employees at its Gramercy refinery, filed an unfair labor practices charge against LSR alleging that LSR is required and has failed to recognize and bargain with the Union in connection with its operation of the Gramercy refinery commencing
10
Table of Contents
January 1, 2011. The charge also alleges that LSR has discriminated against members of the union in job retention and employment for its Gramercy operations due to their membership in the union. The Company is not named in the complaint.
Available Information
Our annual report on Form 10-K, quarterly reports on Form 10-Q, current reports on Form 8-K and amendments to these reports are available free of charge on our web site located at www.imperialsugar.com as soon as reasonably practicable after we file or furnish these reports electronically with the SEC. The information on our website is not incorporated by reference into this Form 10-K.
| ITEM 1A. | Risk Factors |
In addition to the other information set forth in this report, you should consider the following factors that could materially affect our business, financial condition or operating results. These risks are not the only risks facing our Company. Additional risks and uncertainties not currently known to us or that we currently deem to be immaterial also may materially adversely affect our business, financial condition or operating results.
The domestic sugar industry is affected by a number of external forces that we are unable to predict or control that could cause fluctuations in prices, which may negatively affect our results of operations.
Our business and results of operations are closely tied to conditions in the domestic sugar industry, principally the prices of both refined sugar and raw cane sugar. The sugar industry is affected by a number of external forces that we are unable to predict or control and that historically have been subject to considerable volatility.
A variety of external forces that we are unable to predict influence the domestic sugar industry and could adversely affect our business and results of operations, including:
| • | the U.S. farm and trade policies; |
| • | the number of domestic acres contracted to grow sugar cane and sugar beets; |
| • | prices of competing crops; |
| • | HFCS substitution rate; |
| • | energy costs; |
| • | supply and price of raw cane sugar in the world market; |
| • | Mexican peso to U.S. dollar exchange rate; |
| • | levels of domestic sugar refining capacity; and |
| • | weather conditions affecting the sugar cane and sugar beet crops and the operations of facilities operated by us and our competitors. |
The domestic sugar business has traditionally been subject to periods of high prices and margins, followed by periods of lower prices and margins. In the past, during periods of high prices, growers have tended to increase their production, which has generally caused a drop in sugar prices until the supply and demand return into balance. Our business consists exclusively of the processing and marketing of refined cane sugar. Consequently, we are unable to counteract the fluctuations to which our business may be subject with revenues or income from businesses that are more predictable or that are subject to different business cycles. As discussed below, partially as a result of the volatile nature of the sugar industry, we have at times in the past experienced operating losses and net losses.
Our Port Wentworth refinery is supplied almost exclusively by imported raw sugar. Supplies and pricing of imported raw sugar can be influenced by increased world raw sugar prices. Raw sugar imports into the
11
Table of Contents
United States compete for surplus production in exporting counties with alternative sales on the world raw sugar market. Recent events affecting the supply of raw sugar in the world market have increased prices to 30 year high levels, causing domestic raw sugar prices to increase substantially. We compete with domestic beet processors and other cane sugar refiners who own some or all of their source of supply and may not be impacted to the degree we are by these factors. We purchase raw sugar of varying quality from many different countries. Lower quality raw sugar can have an adverse effect on our operating performance. If we have an inadequate supply of raw sugar or unacceptable quality, we may be unable to efficiently operate our refineries or meet domestic demand for refined sugar. We may not be able to increase refined sugar prices to our customers to offset such higher raw sugar costs, which could adversely affect our refined sugar margins, financial condition, results of operations and cash flows.
Our liquidity and capital resources have been reduced and we are exploring alternative sources of capital.
We have used a significant portion of our liquidity since the February 2008 industrial accident in Port Wentworth to fund operating losses and capital expenditures in excess of the applicable insurance recoveries. Operating results have not returned to profitable levels, and we have ongoing capital expenditure and pension contribution requirements. Volatility in raw sugar prices may place additional demands on our liquidity as we maintain our raw sugar purchasing and hedging program. Our revolving credit agreement becomes subject to a minimum EBITDA covenant if our average total liquidity falls below $20 million.
While we believe that our available liquidity and capital resources are sufficient to meet our operating and capital needs, we are exploring alternative sources of capital to provide additional liquidity and capital resources. In conjunction with this initiative, we are seeking to renew or replace the revolving credit agreement, which is currently scheduled to expire December 31, 2011. There can be no assurance that financing will be available to us or that the terms of such financing would be attractive.
Our future financial condition and future operating results could be adversely impacted by the outcome of claims, litigation and regulatory proceedings.
The Company is party to a number of claims, including twenty lawsuits for injuries and losses suffered as a result of the Port Wentworth accident. If damages in these matters exceed insurance policy limits, we could be subject to liabilities, which could be material.
The Company’s workers compensation insurance contract provides that it reimburse the carrier for assessments if and when the assessments are levied based on workers compensation claims paid during a calendar year. Such assessments, if levied, could be significant.
Our business could be adversely affected by the effects of existing and future United States and Mexican farm and trade policies.
Legislative and regulatory actions substantially influence the domestic raw sugar industry. The principal current legislation supporting the price of domestic crops of sugar cane and sugar beets is the 2008 Farm Bill, which extends the sugar price support program for sugar cane and sugar beets until September 30, 2013. The USDA operates a tariff-rate quota that effectively limits the amount of raw and refined sugar that can be imported into the United States by imposing a tariff on over-quota sugar that makes its import uneconomical. This tariff-rate quota could adversely affect the supply and price of raw sugar available to our sugar refineries if there is a shortfall in domestic production. In addition, marketing allotments under the 2008 Farm Bill may reduce the amount and affect the cost of domestic raw sugar that is available to us for refining. United States farm and trade policy also influences domestic sugar grower acreage dedicated to alternate crops. Mexican farm and trade policies influence sugar production in Mexico and non-NAFTA imports, affecting the supply of sugar available for export to the United States. Any of these factors could adversely affect our results of operations.
12
Table of Contents
If demand for sugar decreases in the future, lower sales volumes and lower prices could result, which could affect us adversely.
We cannot predict the demand for sugar in the future and this demand could be affected adversely by numerous factors, including:
| • | imports of sugar containing products and sugar blends; |
| • | the impact of changes in the availability, development or potential use of various types of alternative sweeteners; |
| • | future changes in consumer sweetener preferences, including impact of dietary trend; |
| • | government nutritional guidelines and labeling laws; |
| • | changes in population; and |
| • | the impact of a weaker domestic and global economy |
Operations at the re-built Port Wentworth refinery have yet to return to prior volumes and efficiencies.
The reconstructed Port Wentworth refinery, which commenced operations in the summer of 2009, has yet to achieve sustained production volumes and efficiencies demonstrated prior to the 2008 accident. Future operating results and cash flows may be adversely affected if prior operating levels are not achieved on a sustained basis.
Construction of a new refinery by the LSR joint venture involves construction and other risks.
Under the terms of our LSR agreements, we will contribute our Gramercy, Louisiana refinery to the newly formed joint venture which will undertake to construct a new 3,100 ton per day cane sugar refinery. Cost overruns or construction delays could require that we contribute additional capital beyond our initial commitments to contribute our Gramercy assets. Additionally, we have contractual obligations to complete certain improvements in the existing refinery, and complete the VRP with the State of Louisiana. Unforeseen costs or liabilities arising from these matters could adversely impact our results of operations and cash flow. Additionally, after December 31, 2010, we will no longer have access to the cash flows generated by the existing Gramercy refinery, and distribution of cash flows generated by LSR are limited under LSR’s relevant financing agreements.
Costs and availability of energy may result in increased operating expenses and reduced results of operations.
Processing raw sugar into refined sugar requires a high level of energy use. We use natural gas and coal to fulfill our energy requirements and fuel prices also affect our transportation costs. Domestic energy prices, particularly natural gas and diesel prices, have been volatile in recent years and we are unable to predict the trend in future prices. Future high energy prices or disruptions of supply could adversely impact our production costs and operating efficiencies.
We sell commodity products in highly competitive channels of distribution and face significant price pressure.
We sell our products in highly competitive channels of distribution. We compete with other cane sugar refiners and beet sugar processors and, in certain product applications, with producers of other nutritive and non-nutritive sweeteners. We also compete with distributors and resellers in distributing bag sugar products. Our branded retail share of sales is under increasing pressure from private labels, requiring increased expenditures on innovation and trade promotion.
Competition in these channels is based primarily on price and the ability to meet timely customer quality and quantity requirements. As a result, we may be unable to protect our sales position by product differentiation and may be unable to raise prices. Our ability to service customer requirements has been disrupted since the 2008 industrial accident at our Port Wentworth refinery. Some of our customers have had to seek supply from alternate sources during that period, and our ability to return to normal supply levels with our customers has not been fully demonstrated.
13
Table of Contents
Historically, we have made the majority of our sales to industrial customers under fixed price, forward sales contracts which extend for up to one year. As a result, changes in our realized sales prices tend to lag behind market price changes.
Some competitors may be able to further reduce their product prices because their costs are less than ours or because they have greater financial, technological and other resources than we have. In addition, most of our competitors own or control a substantial portion of their supply of raw materials. This vertical integration may provide these producers a competitive advantage because they are better able to secure a stable supply of raw materials at more favorable costs than we can. Finally, our competitors may be able to respond more quickly to new or emerging technologies and changes in customer requirements than we can. Increased competition and price pressure could adversely affect our financial condition, results of operations and cash flows.
Damage to either of our refineries that results in prolonged interruption of operations could materially adversely affect our results.
The Company conducts its operations at two refineries and is dependent upon these facilities for production. Because these facilities are located in coastal areas, they are subject to severe weather conditions, including hurricanes, tornados and flooding, as well as to normal hazards that could result in material damage. Damage to either of these refineries, or prolonged interruption in the operation of the facilities due to our dependence on ocean-going raw sugar deliveries, or for repairs or other reasons, would have a material effect on the Company’s business, financial condition, results of operations and cash flows. After December 31, 2010, we will no longer operate the Gramercy, Louisiana refinery reducing the Company’s refinery capacity to a single site.
We have had losses in the recent past and may be unable to maintain profitable operations.
We have at times in the past experienced operating losses and net losses. Losses in future years could be incurred and could be attributable to a number of factors, including:
| • | low refined sugar prices; |
| • | low margins between raw sugar and refined sugar prices; |
| • | disruption of refinery operations; |
| • | reduced production and efficiencies of refinery operations; and |
| • | high energy costs. |
We compete in highly competitive labor markets.
We operate facilities in competitive labor markets. In the event we are unable to attract and retain qualified personnel, our production efficiencies and labor costs could be adversely affected.
The Company incurs substantial costs with respect to pension benefits and providing healthcare for its employees.
The Company’s estimates of liabilities and expenses for pensions and post-retirement healthcare benefits require the use of assumptions related to the rate used to discount future liability, the rate of return on plan assets, and the retirement age and mortality of current and retired employees. Future results may differ from these assumptions. In addition, rising healthcare costs and the costs of other employee benefits may affect the Company’s future benefit costs. Such future events may have a material effect on the Company’s financial condition, results of operations and cash flows. Declines in the stock market have reduced assets available to pay retirement benefits and may result in increased costs and funding requirements.
Our pursuit of acquisitions and other similar initiatives involves risk.
We may in the future acquire or invest in new lines of business or offer our products in new markets. We have an option until May 2011 to purchase the remaining 50% of Wholesome’s equity. While no decision on a
14
Table of Contents
course of action with regard to the Wholesome option has been made, acquisitions and similar investments involve numerous risks, including:
| • | assimilation of operations and personnel; |
| • | demands on existing management and other resources; |
| • | opportunity costs of employing capital in such investments; |
| • | potential loss of the capital invested; |
| • | consequences of incurring leverage to finance any investment; |
| • | loss of key employees or key customers of the acquired business; and |
| • | potential for unrecorded liabilities that are not discovered during due diligence. |
We may not realize the expected benefits from future acquisitions or similar investments, and the costs of unsuccessful investment efforts could adversely affect our business and results of operations.
We are exposed to costs arising from environmental compliance, and cleanup, health and safety regulation, and litigation, which may adversely affect our business, financial condition, operating results or cash flows.
Our operations are governed by various federal, state and local environmental laws and regulations. These regulations impose limitations on releases of effluents and emissions from our facilities. They also impose requirements on our management of:
| • | worker safety; |
| • | food quality, safety and integrity; |
| • | water resources; |
| • | air resources; |
| • | combustible dust risk mitigation; |
| • | toxic substances; |
| • | solid waste; and |
| • | emergency planning. |
We received a notice of termination of the contract to process our wastewater at the Port Wentworth refinery effective August 2013. If the Company cannot negotiate a new contract, we must make other arrangements for treatment and discharge of process wastewater, which may require future capital expenditures by the Company or result in increased operating costs.
The Company is negotiating with EPD regarding a comprehensive plan to assure full compliance with our discharge permits and future environmental standards applicable to cooling and storm water at the Port Wentworth refinery. The results of these negotiations may require future capital expenditures by the Company. Further, implementation of any plan negotiated with EPD may result in increased operating costs.
We cannot predict with certainty the extent of our future liabilities and costs under such laws and regulations, or how such regulations could impact our operations, and these impacts could be material.
| ITEM 1B. | Unresolved Staff Comments |
None.
15
Table of Contents
| ITEM 2. | Properties |
We own our Port Wentworth cane sugar refinery and our corporate headquarters in Sugar Land, Texas. We lease the land and own the property improvements and equipment at a distribution facility in Kentucky, and contract for production, throughput and storage at a number of co-packers, warehouses and distribution stations. Certain of these properties are subject to liens securing our credit facility.
We owned our Gramercy, Louisiana refinery at September 30, 2010. Under the terms of our LSR agreements, we contributed seven acres of vacant land adjacent to the refinery in November 2009 and are obligated to contribute the refinery and remaining property to the newly formed joint venture in January 2011. Please read “Business—Joint Venture Operations.”
| ITEM 3. | Legal Proceedings |
The Company is party to a number of claims, including twenty remaining lawsuits brought on behalf of 13 employees or their families and 7 third parties or their families, for injuries and losses suffered as a result of the Port Wentworth industrial refinery accident. None of the lawsuits demand a specific dollar amount of damages sought by the plaintiffs. During fiscal 2010, the Company settled twenty-eight lawsuits seeking recovery of injuries and losses from the Port Wentworth accident, with the settlement payments made to these claimants being funded by the Company’s insurers.
The Company has workers compensation insurance which provides for coverage equal to the statutory benefits provided to workers under state law. Additionally, the Company’s general liability policy provides for coverage for damages to third parties up to a policy limit of $100 million. While the Company believes, based on the facts of these cases, that claims by employees and certain contractors are limited to benefits provided under Georgia workers compensation law, the ultimate resolution of these matters could result in liability in excess of the amount accrued. The Company believes the likelihood of the aggregate liability, including the amounts paid in the settlements discussed above, exceeding the $100 million policy limit is remote.
In August 2010, the Company filed suit in the District Court of Fort Bend County, Texas, against one of its general liability excess insurers, XL Insurance Company America, Inc. (“XL”). XL issued a $25 million policy of insurance (a portion of the $100 million coverage described above) that provides coverage for lawsuits filed as a result of the Port Wentworth industrial refinery accident. XL, which has not denied coverage for payments for settlements or judgments, asserts that its policy does not include coverage of defense costs in litigation. The Company’s lawsuit seeks a declaration that pursuant to the insurance policy it issued to the Company, XL is required to pay the Company’s costs of defense in lawsuits filed by employees and third parties and their families for injuries and losses suffered as a result of the Port Wentworth refinery accident. XL subsequently had the lawsuit removed to the United States District Court for the Southern District of Texas.
Following the Port Wentworth accident, OSHA conducted investigations at the Company’s Port Wentworth and Gramercy refineries. OSHA concluded its Port Wentworth and Gramercy investigations on July 25, 2008, and issued numerous citations with total proposed penalties of $5.1 million in Port Wentworth and $3.7 million in Gramercy. Additionally, OSHA issued requirements for certain abatement actions to be undertaken by the Company at the Port Wentworth and Gramercy facilities. In July 2010, the Company settled the Port Wentworth and Gramercy citations and agreed to pay aggregate penalties of $6.05 million in four quarterly installments commencing in August 2010. The Company made no admission of liability in the settlements. The Company also agreed to abate the citations and to implement certain other measures related to worker and facility safety. The penalties, which had been provided for in prior fiscal years, are not covered by insurance and are not deductible for federal income tax purposes.
In January 2009, a shareholder filed a derivative lawsuit in the District Court of Harris County, Texas against twelve current and former directors and officers of the Company and named the Company as a nominal defendant, alleging mismanagement and breaches of fiduciary duty by the Company’s officers, directors and employees relating to the February 7, 2008 explosion at the Company’s refinery in Port Wentworth, Georgia. In
16
Table of Contents
October 2010, a settlement of the litigation and of the derivative claim of another shareholder was approved by the court. The terms of the settlement provide for implementation by the Company of certain management and governance measures and for the payment of attorneys’ fees of the derivative plaintiffs, which payment was made by the Company’s insurer. The defendants made no admission of liability in the settlement.
The Company’s workers compensation insurance contract requires the reimbursement of the carrier for certain loss-based assessments the carrier receives from the state of Georgia’s Subsequent Injury Trust Fund which are based on losses paid during a calendar year. The Company recorded a $3.7 million charge in fiscal 2010 attributable to losses paid in calendar 2008 and 2009.
In December 2010, AdvancePierre Foods, Inc. filed suit against the Company and its distributor, Evergeen Sweeteners, Inc. in the United States District Court for the Western District of North Carolina seeking damages in connection with sugar that had been voluntarily recalled by the Company in July 2010. The claims asserted against the Company seek recovery of losses allegedly incurred by the plaintiff due to its incorporation of recalled sugar in food products. Although the complaint does not specify alleged damages, the plaintiff previously indicated that its damages were approximately $3.2 million. The Company believes that its general liability insurance policy provides coverage for the damages asserted in connection with these claims, and that it may have additional coverage for these claims through another insurance policy. The insurer who provides the primary layer of coverage up to $1 million of limits has assumed the defense of this lawsuit. An insurer that provides excess coverage above $1 million of damages as part of the Company’s general liability program has denied coverage for these property damage claims. The Company believes that this excess insurance coverage is enforceable to respond to these claims.
In September 2010, EPD issued a notice of violation to the Company in connection with discharges of excess quantities of sugar under the Company’s discharge permits for storm water and cooling water at its Port Wentworth, Georgia refinery. EPD is seeking a penalty of $45,000 for these violations. The Company is in negotiations with EPD regarding the proposed penalties and a comprehensive plan to assure full compliance with these permits and future environmental standards applicable to storm water and cooling water. Additional expenditures may be required to comply with current and future permits and environmental standards associated with storm water and cooling water, although the amount and timing of any further expenditure cannot currently be estimated.
In December 2010, LDEQ issued a Consolidated Compliance Order and Notice of Potential Penalty to the Company alleging violations of state environmental regulations and the terms of the wastewater discharge permit for the Company’s Gramercy, Louisiana refinery. The alleged violations relate to the release of foam into waters of the state and exceedances of applicable criteria for dissolved oxygen and pH. Issuance of a penalty assessment is being considered by LDEQ for the alleged violations. The Company is investigating the alleged violations, has taken measures to cease and contain the foam discharge, and is coordinating with the LDEQ to develop and implement a plan to remove and dispose of the foamy material and achieve and maintain compliance with the terms of its discharge permit and applicable regulations.
In November 2010, the Company filed suit in the Fort Bend County, Texas District Court against Hills Fuel Company, its supplier of coal, for breach of contract. The supplier failed to make deliveries due under the contract and the Company has been sourcing its supply of coal at prices higher than stipulated under the contract.
The Company is party to other litigation and claims which are normal in the course of its operations. While the results of such litigation and claims cannot be predicted with certainty, the Company believes the final outcome of such matters will not have a materially adverse effect on its consolidated results of operations, financial position or cash flows. In connection with the sales of certain businesses, the Company made customary representations and warranties, and undertook indemnification obligations with regard to certain of these representations and warranties including financial statements, environmental and tax matters, and the conduct of the businesses prior to the sale. These indemnification obligations are subject to certain deductibles, caps and expiration dates.
17
Table of Contents
EXECUTIVE OFFICERS OF THE REGISTRANT
The table below sets forth the name, age and position of our executive officers as of December 8, 2010. Our by-laws provide that each officer shall hold office until the officer’s successor is elected or appointed and qualified or until the earlier of the officer’s death, resignation or removal by the Board of Directors.
| Name |
Age | Positions | ||||
| John C. Sheptor |
52 | President and Chief Executive Officer | ||||
| Louis T. Bolognini |
54 | Senior Vice President and General Counsel | ||||
| Patrick D. Henneberry |
56 | Senior Vice President—Commodities and Sales | ||||
| H.P. Mechler |
57 | Senior Vice President and Chief Financial Officer | ||||
| George Muller |
56 | Vice President—Sales Planning, Supply Chain & Information Technology | ||||
| J. Eric Story |
47 | Vice President and Treasurer | ||||
Mr. Sheptor became President and Chief Executive Officer of the Company in January 2008, after serving as Executive Vice President and Chief Operating Officer since joining the Company in February 2007. Prior to joining Imperial, Mr. Sheptor was Executive Vice President of Merisant Worldwide, Inc., the distributor of Equal®, from 2001 to 2004. Prior to that position, he held supply chain and manufacturing positions for Monsanto Company. From 2005 to 2007, he was Project Deputy Director for the Partnership for Supply Chain Management, a non-governmental organization funded by the President’s Emergency Plan for Aids Relief.
Mr. Bolognini joined the Company as Senior Vice President, General Counsel and Secretary in June 2008. Prior to joining the Company, he was Vice President and General Counsel of BioLab, Inc., a pool and spa manufacturing and marketing company from 1999 to 2008. Mr. Bolognini served as Assistant General Counsel to BioLab’s parent company, Great Lakes Chemical Corporation, from 1990 to 1999. Mr. Bolognini served as an executive officer of BioLab, Inc within a two year period prior to the March 18, 2009 Chapter 11 bankruptcy petition filed by BioLab’s parent company, Chemtura Corporation, on behalf of itself and 26 U.S. affiliates, including BioLab.
Mr. Henneberry joined Imperial as Senior Vice President in July 2002. Prior to joining Imperial, he was employed by Louis Dreyfus Corporation from 1984 to 2002. His more recent positions with Louis Dreyfus were: Vice President, Alcohol Division September 2001 to July 2002, Vice President, Louis Dreyfus eBusiness Ventures from May 2000 to March 2002 and Executive Vice President, Louis Dreyfus Sugar Company from April 1996 to April 2000.
Mr. Mechler became Senior Vice President and Chief Financial Officer in March 2005. He had served as Vice President—Accounting and Finance since February 2003 and was Vice President—Accounting from April 1997 to February 2003. Mr. Mechler had been Controller since joining Imperial in 1988. Mr. Mechler served as an executive officer of the Company when it filed a Chapter 11 bankruptcy petition on January 16, 2001.
Mr. Muller became Vice President—Sales Planning, Supply Chain & Information Technology in September 2010. He served as Vice President and Chief Information Officer from November 2002 to October 2008 and Vice President—Administration from October 2008 to September 2010. Mr. Muller joined the Company in March 1997 as Director of Management Information Systems.
Mr. Story became Vice President and Treasurer in September 2004 and previously served as Treasurer of Imperial since February 2003. He joined Savannah Foods & Industries, Inc. in 1987, which we acquired in 1997, and has held a number of finance and accounting positions within both Savannah Foods & Industries and Imperial. He became Corporate Controller for Savannah in 1994 and Director of Planning and Analysis for Imperial in 2002.
18
Table of Contents
PART II
| ITEM 5. | Market for Registrant’s Common Equity, Related Shareholder Matters and Issuer Purchases of Equity Securities |
Market Price of Common Equity and Related Shareholder Matters
Our common stock currently is listed on The NASDAQ Stock Market LLC (NASDAQ) under the symbol “IPSU”. As of December 21, 2010, there were approximately 1,506 shareholders of record of our common stock.
The following table contains information about the high and low sales price per share of our common stock for fiscal years 2009 and 2010 as reported by NASDAQ.
| Three months ended | Sales Price | Dividends Paid |
||||||||||
| High | Low | |||||||||||
| Fiscal 2009 |
||||||||||||
| December 31, 2008 |
$ | 16.74 | $ | 9.69 | $ | 0.07 | ||||||
| March 31, 2009 |
14.66 | 5.10 | 0.07 | |||||||||
| June 30, 2009 |
12.95 | 6.32 | 0.02 | |||||||||
| September 30, 2009 |
16.00 | 10.87 | 0.02 | |||||||||
| Fiscal 2010 |
||||||||||||
| December 31, 2009 |
$ | 17.80 | $ | 11.97 | $ | 0.02 | ||||||
| March 31, 2010 |
18.52 | 13.50 | 0.02 | |||||||||
| June 30, 2010 |
17.28 | 9.50 | 0.02 | |||||||||
| September 30, 2010 |
14.74 | 9.66 | 0.02 | |||||||||
Dividend Policy
Our current credit agreement limits the payment of dividends, other than dividends payable solely in our capital stock, if our average total liquidity (defined as the average of the borrowing base less average actual borrowings and letters of credit), after adjustment on a pro forma basis for such payment, is less than $20 million. The Company has paid a regular quarterly dividend since December 2004. From January 2007 through February 2009, the quarterly dividend rate was $0.07 per share. In May 2009, the regular quarterly dividend rate was reduced to $0.02 per share. The determination to declare or pay future dividends out of funds legally available for that purpose will be at the discretion of our Board of Directors and will depend on our future earnings, results of operations, financial condition, capital requirements, any future contractual restrictions and other factors our Board of Directors deems relevant.
Shareholder Return Performance Graph
The following graph compares the cumulative total stockholder return on the Company’s common stock to the cumulative total return of the Standard & Poor’s 500 Stock Index and the American Stock Exchange Consumer Staple Index (IXR) for the period from September 30, 2005 to September 30, 2010. The graph assumes that the value of the investment in the common stock and each index was $1.00 at September 30, 2005 and that all dividends were reinvested on a quarterly basis.
19
Table of Contents
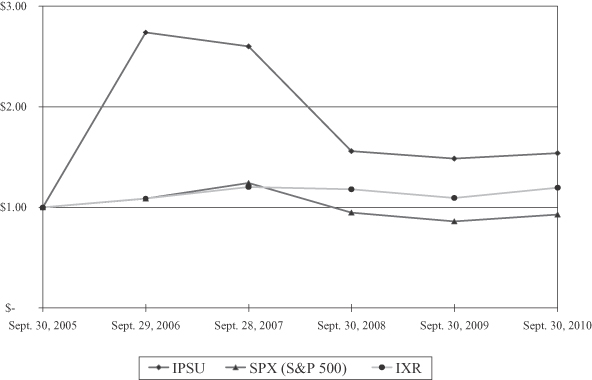
| ITEM 6. | Selected Financial Data |
The following selected consolidated financial information is derived from our audited consolidated financial statements. This consolidated financial data should be read in conjunction with our consolidated financial statements including the related notes thereto, and “Item 7 Management’s Discussion and Analysis of Financial Condition and Results of Operations” included in this report.
Selected financial data for the last five years is as follows (in thousands of dollars, except per share data):
| Year Ended September 30, | ||||||||||||||||||||
| 2010(1) | 2009(2) | 2008(3) | 2007 | 2006 | ||||||||||||||||
| For the Period: |
||||||||||||||||||||
| Net Sales |
$ | 908,033 | $ | 522,563 | $ | 592,423 | $ | 875,527 | $ | 946,823 | ||||||||||
| Operating Income (Loss) |
$ | 209,170 | $ | (41,948 | ) | $ | (66,153 | ) | $ | 53,742 | $ | 71,688 | ||||||||
| Income (Loss) from Continuing Operations |
$ | 136,860 | $ | (23,827 | ) | $ | (21,181 | ) | $ | 43,555 | $ | 48,412 | ||||||||
| Per Share Data: |
||||||||||||||||||||
| Income (Loss) from Continuing Operations: |
||||||||||||||||||||
| Basic |
$ | 11.59 | $ | (2.03 | ) | $ | (1.81 | ) | $ | 3.81 | $ | 4.44 | ||||||||
| Diluted |
$ | 11.33 | $ | (2.03 | ) | $ | (1.81 | ) | $ | 3.71 | $ | 4.31 | ||||||||
| Cash Dividends Declared per Share |
$ | 0.08 | $ | 0.18 | $ | 2.78 | $ | 3.27 | $ | 2.73 | ||||||||||
| At Period End: |
||||||||||||||||||||
| Total Assets |
$ | 541,566 | $ | 615,940 | $ | 358,765 | $ | 360,065 | $ | 371,143 | ||||||||||
| Long-term Debt-Net of Current Maturities |
$ | — | $ | — | $ | — | $ | 1,500 | $ | 1,500 | ||||||||||
| Total Shareholders’ Equity |
$ | 218,732 | $ | 86,434 | $ | 144,070 | $ | 200,091 | $ | 185,885 | ||||||||||
| (1) | Fiscal 2010 includes $278.5 million of insurance recoveries and $33.2 million of gains on derivative contracts intended to hedge raw sugar costs in later periods. |
| (2) | Fiscal 2009 includes $27.9 million of gains on derivative contracts intended to hedge raw sugar costs in later periods and $23.4 million of refinery explosion-related charges. |
| (3) | Fiscal 2008 includes $27.2 million of refinery explosion-related charges. |
20
Table of Contents
| ITEM 7. | Management’s Discussion and Analysis of Financial Condition and Results of Operations |
This discussion is intended to provide the reader with information that will assist in understanding our consolidated financial statements, the changes in certain key items in those consolidated financial statements from year to year, and the primary factors that accounted for those changes. This discussion should be read in conjunction with information contained in the consolidated financial statements and the related notes thereto.
Overview
We operate in a single domestic business segment, the production and sale of refined sugar and related products. Our results of operations substantially depend on market factors, including the demand for and price of refined sugar, the price of raw cane sugar and the availability and price of energy and other resources. These factors are influenced by a variety of external forces that we are unable to predict, including the number of domestic acres contracted to grow sugar cane and sugar beets, prices of competing crops, supply and price of raw cane sugar, dietary trends, competing sweeteners, weather conditions, production outages at key industry facilities and the United States and Mexican farm and trade policies. The domestic sugar industry is subject to substantial influence by legislative and regulatory actions. The 2008 Farm Bill limits the importation of raw cane sugar and the marketing of domestically produced refined beet and raw cane sugar, potentially affecting refined sugar sales prices and volumes as well as the supply and cost of raw material available to our cane refineries.
The Company experienced an industrial accident in February 2008 at its sugar refinery in Port Wentworth, Georgia, which is located near Savannah, Georgia. Production at the refinery, which comprises approximately 60% of our capacity, was suspended after the accident until we commenced limited bulk sugar production in the summer of 2009 and initiated packaged production in the fall of 2009.
On January 1, 2011, the Company will contribute the equipment and personal property of its existing Gramercy refinery (other than its small packaging assets) to LSR in accordance with the terms of our joint venture agreement. The Company will continue to operate the small bag packaging facility in Gramercy and has agreed to purchase 3.5 million cwt of refined bulk sugar from LSR under a long term supply agreement with market-based pricing provisions. Sales derived from the existing Gramercy refinery will be lower in future periods as a result of this contribution, as all but the small bag packaging operations will no longer be consolidated in our results. Fiscal 2010 sales of sugar in bulk and large bags produced at the Gramercy refinery totaled 7.3 million cwt or $253.6 million. These sales contributed gross margin, with derivative activity adjusted to reflect hedge accounting, of approximately $2.2 million.
Results of Operations
Fiscal Year Ended September 30, 2010 compared to Fiscal Year Ended September 30, 2009
Continuing Operations
Our income from continuing operations was $136.9 million or $11.33 per diluted share in fiscal 2010, compared to a loss from continuing operations of $23.8 million or $2.03 per diluted share in fiscal 2009. The recognition of insurance and derivative gains had a significant impact on our reported earnings. In December 2009 the Company settled the property insurance claim relating to the Port Wentworth accident and recorded pretax gains totaling $278.5 million ($178.9 million after tax).
The domestic raw sugar market has been extremely volatile and continues to trade at levels well above historical norms. Since mid-summer 2009 the domestic raw sugar futures market has risen dramatically from $22 per cwt, peaking above $42 per cwt in late January 2010, before retreating to $31 per cwt in March 2010. Since March 2010, domestic raw sugar futures prices have risen to $40 per cwt. This volatility has generated significant gains and losses on derivative contracts entered into to hedge raw sugar purchases relating to future periods. These gains and losses did not qualify for hedge accounting treatment and accordingly, are included in current operating results.
21
Table of Contents
The Port Wentworth refinery’s production ramped up during fiscal 2010 following the restart of the refinery which occurred in the summer of 2009. Daily production rates continue below normal levels, necessitating additional production days, which, along with increased depreciation and spending in a number of areas, added costs to achieve these volumes.
We discuss these and other factors in more detail below.
| Fiscal Year Ended September 30, |
||||||||
| 2010 | 2009 | |||||||
| (in Millions of Dollars) | ||||||||
| Net Sales: |
||||||||
| Sugar Sales |
$ | 889 | $ | 510 | ||||
| By-product Sales |
16 | 10 | ||||||
| Other |
3 | 3 | ||||||
| Net Sales |
$ | 908 | $ | 523 | ||||
Sugar sales comprised approximately 98% of our net sales in fiscal 2010 and fiscal 2009. Sugar sales volumes and prices were:
| Fiscal Year Ended September 30, | ||||||||||||||||
| 2010 | 2009 | |||||||||||||||
| Volume | Price | Volume | Price | |||||||||||||
| (000 cwt) | (per cwt) | (000 cwt) | (per cwt) | |||||||||||||
| Sugar Sales: |
||||||||||||||||
| Industrial |
12,220 | $ | 35.10 | 7,071 | $ | 30.90 | ||||||||||
| Consumer |
5,467 | 45.24 | 4,651 | 38.02 | ||||||||||||
| Distributor |
4,277 | 41.37 | 2,886 | 34.75 | ||||||||||||
| Domestic Sales |
21,964 | 38.84 | 14,608 | 33.93 | ||||||||||||
| World |
1,065 | 33.47 | 555 | 25.13 | ||||||||||||
| Sugar Sales |
23,029 | $ | 38.59 | 15,163 | $ | 33.61 | ||||||||||
Net sales increased 73.8% in fiscal 2010 driven by increased sugar sales volume and higher prices. Sales volumes increased 51.9% primarily due to the ramp up in production volume from the Port Wentworth refinery, partially offset by decreased sugar purchased from other producers. Domestic prices increased 14.5% due to domestic supply conditions and higher raw sugar prices. Domestic beet sugar production was 41.2% of domestic demand which, while higher than the prior year, was significantly below recent historical levels. Additionally, imports from Mexico in fiscal 2010 were 7.3% of U.S. annual demand as compared to 13.2% in the prior year. The combination of these factors, as well as the influence of higher raw cane sugar prices, as discussed below, led to higher refined prices. The majority of industrial channel sales and a portion of distributor channel sales are made under fixed price contracts which generally extend up to a year, many of which are on a calendar year basis. As a result, realized sales prices tend to lag market trends.
22
Table of Contents
Raw sugar production shortfalls in India and poor crop conditions in Brazil have created very tight supply in the world raw sugar market, which has driven up world raw sugar prices. Rising world raw sugar prices together with restrictions on imports imposed by the 2008 Farm Bill pushed domestic raw sugar prices to 30 year highs in early calendar 2010. Prices eased in the spring and summer of 2010 then rose significantly in our fourth fiscal quarter ended September 30, 2010. Domestic raw sugar futures prices for the nearby futures contract as quoted on the Intercontinental Exchange at recent quarter ends were as follows:
| Closing Price (per cwt) |
||||
| September 30, 2008 |
$ | 22.58 | ||
| December 31, 2008 |
$ | 20.03 | ||
| March 31, 2009 |
$ | 20.98 | ||
| June 30, 2009 |
$ | 22.70 | ||
| September 30, 2009 |
$ | 30.50 | ||
| December 31, 2009 |
$ | 35.03 | ||
| March 31, 2010 |
$ | 31.29 | ||
| June 30, 2010 |
$ | 33.83 | ||
| September 30, 2010 |
$ | 39.80 | ||
The Company has attempted to offset the increase in raw sugar cost by adjusting its sales prices, however there can be no assurance that we will be successful in achieving sales price increases sufficient to offset these higher raw sugar costs.
Gross margin as a percentage of sales was negative (2.1%) for fiscal 2010 as compared to 2.1% for fiscal 2009, as higher refined sugar prices were more than offset by higher raw sugar and refining costs.
Raw sugar derivative gains and losses recognized in fiscal 2009 and fiscal 2010 (aggregating $27.9 million and $35.4 million, respectively), which were entered into to hedge future sugar purchases were as follows:
Raw Sugar Futures Derivative Gains (Losses)
(In Millions)
| Recognized In |
Futures Contract Delivery Period | |||||||||||||||||||||||||||||||||||
| Fiscal 2010 | Fiscal 2010 | Fiscal 2011 and 2012 |
||||||||||||||||||||||||||||||||||
| Fiscal 2009 |
Q1 | Q2 | Q3 | Q4 | Q1 | Q2 | Q3 | Q4 | ||||||||||||||||||||||||||||
| $ 27.9 |
$ | 8.8 | $ | 10.0 | $ | 5.7 | $ | 2.9 | $ | 0.5 | ||||||||||||||||||||||||||
| $ | 18.9 | 7.0 | 7.9 | 3.4 | 0.6 | |||||||||||||||||||||||||||||||
| $ | (24.8 | ) | (16.1 | ) | (5.7 | ) | (3.0 | ) | ||||||||||||||||||||||||||||
| $ | 10.7 | 5.7 | 5.0 | |||||||||||||||||||||||||||||||||
| $ | 30.6 | 30.6 | ||||||||||||||||||||||||||||||||||
| $ | 8.8 | $ | 17.0 | $ | (2.5 | ) | $ | 6.3 | $ | 33.7 | ||||||||||||||||||||||||||
The effect of recognizing derivative gains results in higher raw sugar cost in subsequent periods while the recognition of losses results in lower raw sugar costs in future periods.
Our cost of domestic raw cane sugar purchased, excluding the effect of derivative gains and losses and LIFO liquidation, was $28.50 per cwt on a raw market basis in fiscal 2010, compared to $22.00 in fiscal 2009. The higher current period raw sugar cost reflects the higher raw sugar market prices. As a result of these higher domestic raw cane sugar purchases, our gross margin percentage declined by 16.9% compared to last year. Sugar inventory quantities at September 30, 2010 declined below the September 30, 2009 level, resulting in the liquidation of a LIFO inventory layer with a cost approximately $3.4 million below the cost of current purchases.
23
Table of Contents
Cost of sales in 2010 includes $33.2 million of gains on raw sugar futures contracts recognized this year on derivatives entered into to hedge raw sugar purchases in future periods, while cost of sales for the year ended September 30, 2009 included $27.9 million of gains on raw sugar futures contracts entered into to hedge raw sugar purchases in fiscal 2010 and beyond.
Manufacturing costs per cwt were relatively flat in fiscal 2010 as compared to the prior year. Fiscal 2009 included high costs related to the restart of the Port Wentworth refinery in summer 2009 as well as fixed costs incurred in Port Wentworth prior to start up. The Port Wentworth refinery ramped up production volume throughout fiscal 2010, however daily throughput rates continue to lag historical rates, necessitating added production days and increased operating costs. Average daily melt rates and production days since the restart of the refinery in fiscal 2009, and for the two fiscal years prior to the accident were as follows:
| Quarterly Period |
Average Daily Melt (millions of pounds) |
Number of Production Days in Quarter |
||||||
| Average quarter fiscal 2006 |
5.9 | 73 | ||||||
| Average quarter fiscal 2007 |
5.9 | 65 | ||||||
| Third quarter fiscal 2009 |
0.5 | 14 | ||||||
| Fourth quarter fiscal 2009 |
1.4 | 85 | ||||||
| First quarter fiscal 2010 |
3.2 | 81 | ||||||
| Second quarter fiscal 2010 |
3.9 | 82 | ||||||
| Third quarter fiscal 2010 |
4.7 | 82 | ||||||
| Fourth quarter fiscal 2010 |
4.4 | 86 | ||||||
Average daily melt during the period from October 1 to November 30, 2010 improved to 5.1 million pounds. Final inspections of the newly constructed bulk sugar silos at the Port Wentworth refinery revealed construction deficiencies by the contractor which required taking the silos offline for repairs at the end of November 2010. Production rates at the refinery were reduced to 3.9 million pounds per day in December and are expected to continue at reduced rates until the silos are back in service in January.
The lower total production volumes and the additional production days during fiscal 2010 generated higher unit cost while refining efficiency adversely impacted yields. Additionally, higher maintenance, safety, insurance, property taxes, depreciation and consulting cost impacted manufacturing costs.
Compared to fiscal 2007, the last comparable period before the Port Wentworth accident, higher manufacturing costs negatively impacted the gross margin percentage by 6.4%. Depreciation increased $10.8 million primarily as a result of commencing depreciation of the reconstructed Port Wentworth facilities. Insurance, property taxes and safety costs increased $14.0 million, compared to 2007, with approximately 57% of the increases related to Port Wentworth. Higher property taxes and insurance costs are primarily the result of the rebuilt Port Wentworth refinery. The OSHA settlement agreement includes requirements to abate the citations and to implement or continue certain safety measures regarding safety and health of our employees. While the costs associated with the Gramercy refinery will be reduced after the LSR contribution, the Port Wentworth costs described above are not expected to decline from their current levels in the near future.
We incurred $8.2 million of costs related to supply disruptions in fulfilling existing industrial sales contracts caused by the production challenges at the Port Wentworth refinery, which reduced the gross margin percentage by 0.9% for the year.
24
Table of Contents
Energy costs per cwt for fiscal 2010 were lower than the prior year due to lower natural gas prices and the resumption of coal usage in Port Wentworth. Lower energy costs increased gross margin as a percent of sales by 1.3%. The Port Wentworth refinery has the ability to utilize traditionally lower priced coal as its primary energy source, while the Gramercy refinery exclusively uses natural gas. Natural gas usage was 87% of our energy usage in fiscal 2010, compared to 100% in the prior year. Our average NYMEX basis cost of natural gas after applying gains and losses from hedging activity decreased to $5.04 per mmbtu in the current year as compared to $7.43 per mmbtu for last year.
| Fiscal Year Ended September 30, | ||||||||||||||||
| 2010 | 2009 | |||||||||||||||
| Volume | Price | Volume | Price | |||||||||||||
| (000 MMBTU) | (per MMBTU) | (000 MMBTU) | (per MMBTU) | |||||||||||||
| Natural Gas |
4,221 | $ | 5.04 | 2,749 | $ | 7.43 | ||||||||||
| Coal |
635 | 4.62 | — | — | ||||||||||||
| Total |
4,855 | $ | 4.98 | 2,749 | $ | 7.43 | ||||||||||
Transportation costs were lower in fiscal 2010 as customer shipments were optimized between Gramercy and Port Wentworth as compared to the longer distances required last year without the benefit of Port Wentworth production. Gross margin improved 1.6% as a result of these lower transportation costs.
Selling, general and administrative expense for fiscal 2010 decreased $4.3 million from fiscal 2009 primarily due to lower compensation costs of $2.1 million, lower legal costs of $1.5 million and lower depreciation expense of $0.7 million.
The Company settled the Port Wentworth property and business interruption insurance claim in the first fiscal quarter of 2010 for $345.0 million, resulting in pretax gains of $278.5 million. We incurred $4.9 million of continuing legal and consulting costs related to the refinery explosion during the current year as compared to $23.4 million of net charges in the prior year. Details of the settlement of the insurance claim are provided in Note 2 to the Consolidated Financial Statements.
The Company recorded a $3.7 million charge in refinery explosion related charges during fiscal 2010, related to certain loss-based assessments from the state of Georgia’s Subsequent Injury Trust Fund which are levied based on workers compensation claims paid during a calendar year.
The Company along with other sugar industry participants was party to a lawsuit with McNeil Nutritional, which was settled in November 2008. The Company received $16.1 million in connection with the settlement, which was recorded as a gain on litigation settlement in fiscal 2009.
Interest expense increased $0.2 million over fiscal 2009 as higher borrowing balances more than offset lower interest rates. Interest income decreased by $0.4 million as compared to fiscal 2009 due to lower interest rates and lower invested balances.
25
Table of Contents
Other income included the following (in thousands of dollars):
| Fiscal Year Ended September 30, |
||||||||
| 2010 | 2009 | |||||||
| Equity earnings in investment in: |
||||||||
| Comercializadora Santos Imperial S. de R.L. de C.V. |
$ | 1,609 | $ | 1,775 | ||||
| Wholesome Sweeteners, Inc. |
2,895 | 706 | ||||||
| Other |
(69 | ) | — | |||||
| Distributions from cost-basis limited partnership |
— | 147 | ||||||
| Gain on securities |
— | 388 | ||||||
| Settlement on natural gas pricing litigation |
857 | 107 | ||||||
| Other |
250 | (75 | ) | |||||
| Total |
$ | 5,542 | $ | 3,048 | ||||
Wholesome’s results are reported net of amortization of identified intangibles of $0.7 million in fiscal 2010 and fiscal 2009.
Detail of our provision for income taxes, including reconciliation to the statutory federal rates, is provided in Note 8 to the Consolidated Financial Statements.
Discontinued Operations
Income from discontinued operations in fiscal 2009 is a result of the resolution of pre-disposal contingencies.
Fiscal Year Ended September 30, 2009 compared to Fiscal Year Ended September 30, 2008
Continuing Operations
Our loss from continuing operations was $23.8 million in fiscal 2009 as compared to a loss from continuing operations of $21.2 million in fiscal 2008. Lower sales volumes along with higher manufacturing and freight costs due to the loss of the Port Wentworth production capacity had a significant negative impact on earnings. Increases in refined sales prices in excess of domestic raw sugar cost increases partially offset the manufacturing and freight costs. Refinery explosion related charges (as described in Note 2 to the Consolidated Financial Statements) resulted in net pre-tax charges of $23.4 million in fiscal 2009 and $27.2 million in fiscal 2008. As a result of the rapid increase in raw sugar prices during the 4th quarter of fiscal 2009, we recognized $27.9 million of pre-tax gains on domestic raw sugar derivatives intended to hedge raw sugar purchases in fiscal 2010, which do not qualify for hedge accounting treatment. We discuss these and other factors in more detail below. These results do not include any recoveries for lost income under the business interruption portion of the Company’s property insurance policy.
| Fiscal Year
Ended September 30, |
||||||||
| 2009 | 2008 | |||||||
| (in Millions of Dollars) | ||||||||
| Net Sales: |
||||||||
| Sugar Sales |
$ | 510 | $ | 574 | ||||
| By-product Sales |
10 | 15 | ||||||
| Other |
3 | 3 | ||||||
| Net Sales |
$ | 523 | $ | 592 | ||||
26
Table of Contents
Sugar sales comprised approximately 98% of our net sales in fiscal 2009 and 97% in fiscal 2008. Sugar sales volumes and prices were:
| Fiscal Year Ended September 30, | ||||||||||||||||
| 2009 | 2008 | |||||||||||||||
| Volume | Price | Volume | Price | |||||||||||||
| (000 cwt) | (per cwt) | (000 cwt) | (per cwt) | |||||||||||||
| Sugar Sales: |
||||||||||||||||
| Industrial |
7,071 | $ | 30.90 | 8,004 | $ | 29.42 | ||||||||||
| Consumer |
4,651 | 38.02 | 5,670 | 35.36 | ||||||||||||
| Distributor |
2,886 | 34.75 | 3,463 | 31.45 | ||||||||||||
| Domestic Sales |
14,608 | 33.93 | 17,137 | 31.80 | ||||||||||||
| World |
555 | 25.13 | 1,364 | 21.45 | ||||||||||||
| Sugar Sales |
15,163 | $ | 33.61 | 18,501 | $ | 31.04 | ||||||||||
Net sales decreased 11.8% in fiscal 2009 driven by an overall sugar volume decrease of 18.0% primarily due to the lost production volume from the Port Wentworth refinery, partially offset by increased sugar purchased from other producers. Domestic prices increased 6.7% and gross margin as a percentage of sales was 2.1% for fiscal 2009 as compared to 1.1% for fiscal 2008. Domestic sugar supply conditions, driven by an 11.8% reduction in beet sugar production in the fall of 2008, led to the higher refined sugar prices in fiscal 2009.
The majority of industrial channel sales and a portion of distributor channel sales are made under fixed price contracts which generally extend up to a year, many of which are on a calendar year basis. As a result, realized sales prices tend to lag market trends. The Company continued to fulfill lower-priced contracts which existed at the time of the Port Wentworth explosion in February 2008, dampening the effect of higher prices in fiscal 2009. These contracts amounted to 35% of the combined sales in the industrial and distributor channels in fiscal 2009. Refined prices rose to historically higher levels during fiscal 2009 due to supply conditions, as well as the effect of high raw sugar prices discussed below.
Raw sugar costs rose in fiscal 2009 compared to the prior year and partially offset the margin impact of higher refined prices. Our cost of domestic raw cane sugar increased from $20.82 per cwt (on a raw market basis) for fiscal 2008 to $22.00 per cwt for fiscal 2009. The higher domestic raw cane sugar cost decreased our gross margin percentage by 2.7%. Raw sugar production shortfalls in India and poor crop conditions in Brazil have created very tight supply in the world raw sugar market, which in turn drove up U.S. domestic raw sugar prices.
The Company recognized $27.9 million of gains on domestic raw sugar futures contracts intended to hedge fiscal 2010 raw sugar purchases as a result of the rapid increase in raw sugar prices during the 4th quarter of fiscal 2009. Because of the Company’s inability to forecast raw sugar purchases as a result of delays in the Port Wentworth start-up during fiscal 2009, gains on our raw sugar futures contracts did not qualify for deferral treatment under applicable derivative hedge accounting standards. These gains resulted in a 5.2% improvement in gross margin percentage in fiscal 2009, compared to fiscal 2008.
27
Table of Contents
Energy costs per cwt for fiscal 2009 were lower than the prior year due to lower natural gas prices, partially offset by a negative mix of energy sources caused by the curtailment of sugar production in Port Wentworth. Lower energy costs increased gross margin as a percent of sales by 0.2%. The Port Wentworth refinery has the ability to utilize lower priced coal as its primary energy source, while the Gramercy refinery exclusively uses natural gas. Natural gas usage was 100% of our energy usage in fiscal 2009, compared to 76% in the prior year. Our average NYMEX basis cost of natural gas after applying gains and losses from hedging activity decreased to $7.43 per mmbtu in fiscal 2009 as compared to $9.13 per mmbtu for fiscal 2008.
| Fiscal Year Ended September 30, | ||||||||||||||||
| 2009 | 2008 | |||||||||||||||
| Volume | Price | Volume | Price | |||||||||||||
| (000 MMBTU) | (per MMBTU) | (000 MMBTU) | (per MMBTU) | |||||||||||||
| Natural Gas |
2,749 | $ | 7.43 | 2,244 | $ | 7.43 | ||||||||||
| Coal |
— | — | 705 | 3.66 | ||||||||||||
| Fuel Oil |
— | — | 1 | 7.40 | ||||||||||||
| Total |
2,749 | $ | 7.43 | 2,950 | $ | 7.82 | ||||||||||
Gross margin was negatively impacted by higher transportation costs since the Port Wentworth accident, resulting in a decrease in gross margin percentage of 1.8% in fiscal 2009 as compared to the prior year. Increased distances to serve Port Wentworth customers from the Gramercy refinery as well as a shift in the delivery mix accounted for 0.9% of the gross margin reduction while higher freight rates drove the remaining 0.9% gross margin change.
Manufacturing costs increased over fiscal 2008 primarily due to high start-up and operating costs at the Port Wentworth refinery as the facility ramped up production in the last quarter of fiscal 2009. Lower daily production rates caused significantly higher fixed unit costs due to absorption as the refinery ran at approximately 25% of its normal daily production rate in the 4th fiscal quarter. Higher safety, cleaning and repair costs at both Gramercy and Port Wentworth also contributed to the increase in manufacturing costs over the prior year As a result of the foregoing, higher manufacturing costs reduced gross margin percentage by 6.1%.
Selling, general and administrative expense for fiscal 2009 increased $0.3 million from fiscal 2008 primarily due to higher legal costs of $2.9 million, offset in part by $1.9 million of lower compensation costs and lower depreciation expense of $0.9 million.
The Company along with other sugar industry participants was party to a lawsuit with McNeil Nutritional, which was settled in November 2008. The Company received $16.1 million in connection with the settlement which was recorded as a gain on litigation settlement in fiscal 2009.
In fiscal 2009 we incurred $53.8 million of costs related to the refinery accident and have accrued insurance recoveries totaling $30.4 million, resulting in a net charge of $23.4 million to operations. Details of the costs incurred and the status of insurance recoveries is provided in Note 2 to the Consolidated Financial Statements.
As a result of the foregoing, our operating loss was $41.9 million in fiscal 2009 compared to an operating loss of $66.2 million in fiscal 2008.
All of the $0.8 million of interest expense incurred as a result of borrowings under the revolving credit facility was capitalized as part of the cost of constructing assets. The remaining interest expense decreased by $0.2 million in fiscal 2009 primarily as a result of lower accruals on tax liabilities.
Interest income decreased by $2.2 million in fiscal 2009 primarily due to lower interest rates on invested balances.
28
Table of Contents
Other income included the following (in thousands of dollars):
| Fiscal Year
Ended September 30, |
||||||||
| 2009 | 2008 | |||||||
| Equity earnings in investment in: |
||||||||
| Comercializadora Santos Imperial S. de R.L. de C.V. |
$ | 1,775 | $ | 665 | ||||
| Wholesome Sweeteners, Inc. |
706 | 1,089 | ||||||
| Distributions from cost-basis limited partnership |
147 | 11,422 | ||||||
| Gain on securities |
388 | 51 | ||||||
| Settlement on Natural Gas Pricing Litigation |
107 | — | ||||||
| Other |
(75 | ) | 128 | |||||
| Total |
$ | 3,048 | $ | 13,355 | ||||
In fiscal 2008 the Company received an $11.2 million cash distribution from its long-term, cost-basis investment. Wholesome’s results are reported net of amortization of identified intangibles of $0.7 million in fiscal 2009 and $0.1 million in fiscal 2008.
Detail of our provision for income taxes, including reconciliation to the statutory federal rates, is provided in Note 8 to the Consolidated Financial Statements.
Discontinued Operations
Income from discontinued operations in fiscal 2009 is a result of the resolution of pre-disposal contingencies. Income from discontinued operations in fiscal 2008 was a gain resulting from the settlement of certain escrow arrangements for a previously sold business.
Liquidity and Capital Resources
At September 30, 2010, the Company had cash and cash equivalents of $22.8 million and $22.0 million of outstanding borrowings under our $100 million revolving credit agreement with Bank of America, N.A. (the “Revolver”). At September 30, 2010, we had the capacity under the borrowing base formula to borrow $72.1 million against inventory and receivables, after deducting outstanding letters of credit totaling $5.9 million.
The Company has used a significant portion of its liquidity since the February 2008 industrial accident in Port Wentworth to fund operating losses and capital expenditures in excess of the applicable insurance recoveries. Operating results have not returned to profitable levels, and we have ongoing capital expenditure and pension contribution requirements. Volatility in raw sugar prices may place additional demands on our liquidity as we maintain our raw sugar purchasing and hedging program. In connection with purchases of sugar futures contracts, we are required to settle in cash each day gains and losses based on the change in the price of the futures contract, which can require us to make significant cash payments. As described below, the Revolver becomes subject to a minimum EBITDA covenant if our average total liquidity falls below $20 million.
While we believe that our available liquidity and capital resources, including cash from operations and the Revolver, are sufficient to meet our operating and capital needs, we are exploring alternative sources of capital to provide additional liquidity and capital resources. In conjunction with this initiative, we are seeking to renew or replace the Revolver, which is currently scheduled to expire December 31, 2011. There can be no assurance that financing will be available to us or that the terms of such financing would be attractive.
The Revolver, which expires December 31, 2011, is secured by substantially all of our current assets, certain investments and certain property, plant and equipment. Each of our subsidiaries is either a borrower or a
29
Table of Contents
guarantor under the facility. Interest on borrowings under the Revolver is at LIBOR plus a margin that varies (with liquidity, as defined) from 1.00% to 1.75%, or the base rate (Bank of America prime rate) plus a margin of negative 0.25% to positive 0.25%.
The agreement contains covenants limiting our ability to, among other things:
| • | incur other indebtedness; |
| • | incur other liens; |
| • | undergo any fundamental changes; |
| • | engage in transactions with affiliates; |
| • | enter into sale and leaseback transactions; |
| • | change our fiscal periods; |
| • | enter into mergers or consolidations; |
| • | sell assets; and |
| • | prepay other debt. |
In addition, in the event that our average total liquidity (defined as the average of the borrowing base, less average actual borrowings and letters of credit) falls below $20 million, the Revolver requires that we comply with a quarterly covenant which establishes a minimum level of earnings before interest, taxes, depreciation and amortization, as defined (EBITDA). The Revolver limits our ability to pay dividends or repurchase stock if our average total liquidity, after adjustment on a pro forma basis for such transaction, is less than $20 million. Average total liquidity for fiscal 2010 was $110 million.
The Revolver also includes customary events of default, including a change of control. Borrowings will generally be available subject to a borrowing base and to the accuracy of all representations and warranties, including the absence of a material adverse change and the absence of any default or event of default. Although the facility has a final maturity date of December 31, 2011, we classify debt under the Revolver as current, as the agreement contains a subjective acceleration clause if in the opinion of the lenders there is a material adverse effect, and provides the lenders direct access to our cash receipts.
We have rebuilt the portions of the Port Wentworth refinery and packaging operations that were damaged or destroyed in the industrial accident in February 2008 at a cost of $225 million. Our capital expenditures for fiscal 2010 were $72.3 million, including spending related to the Port Wentworth rebuild. Capital expenditures for fiscal 2011 are expected to total between $20 million and $25 million, related primarily to the completion of safety related improvements and normal equipment replacement, and includes the improvements we are required to complete in connection with the LSR joint venture agreements.
Pension liabilities of $97.3 million, along with a $11.7 million liability for postretirement and post employment medical benefits and deferred compensation liabilities of $7.7 million, comprised the substantial portion of the non-current deferred employee benefits and other liabilities at September 30, 2010.
Our contributions to company-sponsored pension plans totaled $13.6 million in fiscal 2010 and are expected to total approximately $15.5 million in fiscal 2011. Based on the fair value of plan assets and interest rates as of September 30, 2010, assuming no change in future interest rates and assuming the plans’ assets grow at 7.0% per year, we estimate that our required contributions in future fiscal years will approximate $15.3 million in 2012, $14.8 million in 2013, $14.3 million in 2014 and $10.2 million in 2015.
In fiscal 2010, we paid dividends totaling $0.08 per share.
30
Table of Contents
Contractual Obligations and Off-Balance Sheet Arrangements
We have no off-balance sheet arrangements.
The following table provides a summary of contractual commitments as of September 30, 2010, for the periods indicated:
| Contractual Obligations |
Payments Due by Period | |||||||||||||||||||
| Total | Less than 1 Year |
1-3 Years |
4-5 Years |
More than 5 Years |
||||||||||||||||
| (In Millions of Dollars) | ||||||||||||||||||||
| Long-term Debt Payments |
$ | — | $ | — | $ | — | $ | — | $ | — | ||||||||||
| Operating Leases |
9.2 | 6.1 | 3.1 | — | — | |||||||||||||||
| Revolving Credit Line Payments |
22.0 | 22.0 | — | — | — | |||||||||||||||
| Purchase Obligations: |
||||||||||||||||||||
| Sugar(1) |
1,200.6 | 273.2 | 207.8 | 205.6 | 514.0 | |||||||||||||||
| Other(2) |
38.9 | 33.2 | 5.7 | — | — | |||||||||||||||
| Total Purchase Obligations |
1,270.7 | 334.5 | 216.6 | 205.6 | 514.0 | |||||||||||||||
| Other Long-term Liabilities Reflected on Balance Sheet Under GAAP(3) |
7.7 | 0.9 | 1.6 | 1.3 | 3.9 | |||||||||||||||
| Total |
$ | 1,278.4 | $ | 335.4 | $ | 218.2 | $ | 206.9 | $ | 517.9 | ||||||||||
| (1) | Includes an estimated price for variably priced raw and refined sugar purchase contracts; actual price paid in the future will vary and such variance may be significant. Does not include raw sugar futures contracts which are not expected to result in actual delivery. |
| (2) | Includes open purchase orders for the purchase of goods and services issued in the ordinary course of business. |
| (3) | Includes projected future benefit payments for deferred compensation programs for certain current and former employees. Does not include pension and postretirement benefit costs. See Note 10 to the Consolidated Financial Statements. |
Critical Accounting Policies and Estimates
The preparation of financial statements requires us to make estimates and judgments that affect the reported amounts of assets, liabilities, revenues and expenses. We base our estimates on historical experience and on various other assumptions that we believe are reasonable under the circumstances. Actual results may materially differ from these estimates and our estimates may change materially if our assumptions or conditions change and as additional information becomes available in future periods. Management has discussed the selection of critical accounting policies and estimates with the Audit Committee of the Board of Directors and the Audit Committee has reviewed our disclosure relating to critical accounting policies and estimates in this Form 10-K. Management considers an accounting estimate to be critical if it involves significant estimates or judgments and if the results of the estimation process could materially affect the financial statements.
Our significant accounting policies are more fully described in Note 1 to our Consolidated Financial Statements for fiscal 2010. The following is a summary of the more significant judgments and estimates used in the preparation of the consolidated financial statements.
Contingent Liabilities: The Company is party to a number of claims as a result of the Port Wentworth industrial accident. The Company believes that its workers compensation and liability insurance coverage is adequate to provide for damages arising from such claims and has included a liability and an offsetting insurance recovery on the balance sheet representing the estimated claims to be reimbursed by its workers compensation and liability insurance coverage. The final outcome of these matters may be materially different than the estimated liabilities provided for in these financial statements.
31
Table of Contents
Allowance for Credit Losses: We extend trade credit to customers on substantially all of our sales and are subject to credit risk in the event of non-payment. We provide an allowance for estimated credit losses based on a review of prior loss history, a review of the trend in credit quality statistics about the receivable portfolio such as past due percentages, a review of individual credit extensions and other factors. As of September 30, 2010, the allowance for estimated credit losses, which is reported as a reduction of accounts receivable in the consolidated balance sheet, was $0.6 million. Actual credit losses in the future may vary from this estimate.
Allowance for Trade Promotions and Coupon Redemptions: Trade promotions are an important component of the sales and marketing of our products, and are critical to the support of our business. Trade promotion costs include amounts paid to encourage retailers to offer temporary price reduction for the sale of our products to consumers, reimbursement of customer paid advertising and amounts paid to obtain favorable display positions in retailers’ stores. Accruals for trade promotions are recorded at the time of sale of product to the customer based on expected levels of performance. Settlement of these liabilities typically occurs in subsequent periods primarily through an authorized process for deductions taken by a customer from amounts otherwise due to us or by direct payment to customers. From time to time, we distribute coupons to consumers for our branded retail products, and accrue a liability for the estimated redemption costs based on historical rates. As a result, the ultimate cost of a trade promotion program is dependent on the relative success of the events and the actions and level of deductions taken by our customers and the actual cost of coupon programs is dependent on actual consumer redemption rates. Allowances for trade promotions and coupon redemptions recorded in the balance sheet at September 30, 2010 totaled $7.7 million. Final determination of trade promotion allowances and coupon redemption may result in adjustments in future periods.
Defined Benefit and Medical Retirement Plans: The plan obligations and related assets of defined benefit and medical retirement plans are presented in Note 10 to the Consolidated Financial Statements. Pension plan assets, which consist primarily of marketable equity and debt instruments, are valued using market quotations. Plan obligations and the annual pension expense are determined based on consultation with actuaries and are based in part on a number of assumptions we provide. Key assumptions in measuring the plan obligations include the discount rate, retirement rates, the long-term healthcare cost trend rate, mortality rates and the estimated future return on plan assets. In determining the discount rate, we use a yield based on market bond issues with maturities corresponding to the anticipated timing of the benefit payments. Asset returns are based upon the anticipated average rate of earnings expected on the invested funds of the plans based on the results of historical statistical studies performed by our advisors. At September 30, 2010, the actuarial assumptions for our plans were: discount rate of 4.82%; long-term rate of return on plan assets of 7.00%; and healthcare cost trend rate ranging from 5.00% to 8.50%. A 1% change in the discount rate would change our recorded pension obligations by approximately $23 million, while a 1% change in the assumed rate of return on assets would change annual costs by $1.5 million. The impact of changes in healthcare trend rates is described in Note 10 to the Consolidated Financial Statements.
Interim LIFO Accruals: Our raw sugar inventories, which are accounted for on the LIFO basis of accounting, are periodically reduced at interim dates to levels below that of the beginning of the fiscal year. When such interim LIFO liquidations are expected to be restored prior to fiscal year end, the estimated replacement cost of the liquidated layers is utilized as the basis of cost of sugar sold from beginning of the year inventory. Changes in the estimated replacement cost are recognized in subsequent interim fiscal periods as they arise. These changes in estimates have no effect on results for the full fiscal year.
Accounting for Income Taxes: Accounting for income taxes requires significant judgment in estimating the probability of the future tax benefit expected to be realized from future tax deductions attributable to temporary differences and loss carryforwards. We concluded that future tax benefits of all tax deductions from temporary book/tax differences and loss carryforwards will be realized in future years. The ultimate realization of these tax benefits is dependent on our operations generating sufficient taxable income during the future periods to offset the deductions and carryforwards. Additionally, the final resolution of certain tax positions we have taken or expect to take in filed tax returns is sometimes uncertain, and may be subject to adjustment in future periods. We
32
Table of Contents
evaluate the likelihood that a filed position will ultimately be sustained, and have recorded a liability of $6.4 million for such uncertainties. The ultimate resolution of these uncertainties may require an adjustment to this recorded amount.
New Accounting Pronouncements
In June 2009, the FASB issued authoritative guidance which requires additional information regarding transfers of financial assets, including securitization transactions, and where companies have continuing exposure to the risks related to transferred financial assets. The guidance eliminates the concept of a “qualifying special-purpose entity,” changes the requirements for derecognizing financial assets, and requires additional disclosures. It is effective for fiscal years beginning after November 15, 2009. The Company is currently evaluating the impact that the adoption of this guidance will have on its consolidated financial statements and disclosures.
| ITEM 7A. | Quantitative and Qualitative Disclosures About Market Risk |
We use raw sugar futures and options in our raw sugar purchasing programs and natural gas futures and options to hedge natural gas purchases used in our manufacturing operations. Our derivatives hedging activity is supervised by a senior risk management committee which monitors and reports compliance with our risk management policy to the Audit Committee of the Board of Directors.
The information in the table below presents our domestic and world raw sugar futures positions outstanding as of September 30, 2010.
| Expected Maturity Fiscal 2011 |
Expected Maturity Fiscal 2012 |
|||||||
| Domestic Futures Contracts (net long positions): |
||||||||
| Contract Volumes (cwt) |
3,270,000 | 375,000 | ||||||
| Weighted Average Contract Price (per cwt) |
$ | 29.11 | $ | 29.03 | ||||
| Contract Amount |
$ | 95,186,000 | $ | 10,890,000 | ||||
| Weighted Average Fair Value (per cwt) |
$ | 35.84 | $ | 28.36 | ||||
| Fair Value |
$ | 117,213,000 | $ | 10,640,000 | ||||
| Expected Maturity Fiscal 2011 |
||||
| World Futures Contracts (net long positions): |
||||
| Contract Volumes (cwt) |
647,000 | |||
| Weighted Average Contract Price (per cwt) |
$ | 23.26 | ||
| Contract Amount |
$ | 15,060,000 | ||
| Weighted Average Fair Value (per cwt) |
$ | 23.48 | ||
| Fair Value |
$ | 15,200,000 | ||
The above information does not include either our physical inventory or our fixed price purchase commitments for raw sugar. At September 30, 2009, our domestic futures position was a net long position of 4,335,000 cwt at an average contract price of $25.17 and an average fair value price of $29.35. Our world futures position at September 30, 2009 was a net long position of 934,000 cwt at an average contract price of $21.72 and an average fair value price of $25.39.
33
Table of Contents
The information in the table below presents our natural gas futures positions outstanding as of September 30, 2010.
| Expected Maturity Fiscal 2011 |
||||
| Futures Contracts (long positions): |
||||
| Contract Volumes (mmbtu) |
490,000 | |||
| Weighted Average Contract Price (per mmbtu) |
$ | 4.82 | ||
| Contract Amount |
$ | 2,363,000 | ||
| Weighted Average Fair Value (per mmbtu) |
$ | 4.14 | ||
| Fair Value |
$ | 2,030,000 | ||
At September 30, 2009, our natural gas futures position was a long position of 1,420,000 mmbtu with an average contract price of $5.99 and an average fair value price of $5.90.
At September 30, 2010 and 2009, we had no financial instruments which were sensitive to interest rate changes.
| ITEM 8. | Financial Statements and Supplementary Data |
See the index of financial statements and financial statement schedules under “Item 15. Exhibits, Financial Statement Schedules.”
Unaudited quarterly financial data for the last eight fiscal quarters is as follows (in thousands of dollars, except per share amounts):
| Fiscal Year 2010 | ||||||||||||||||
| Quarter Ended | ||||||||||||||||
| December 31, 2009(1)(2) |
March 31, 2010(2) |
June 30, 2010(2) |
September 30, 2010(2) |
|||||||||||||
| Net Sales |
$ | 173,779 | $ | 208,863 | $ | 260,978 | $ | 264,413 | ||||||||
| Gross Margin |
12,400 | (40,847 | ) | 1,910 | 7,268 | |||||||||||
| Income (Loss) from Continuing Operations |
178,116 | (33,264 | ) | (5,687 | ) | (2,305 | ) | |||||||||
| Income from Discontinued Operations |
— | — | — | — | ||||||||||||
| Net Income (Loss) |
178,116 | (33,264 | ) | (5,687 | ) | (2,305 | ) | |||||||||
| Earnings Per Share: |
||||||||||||||||
| Income (Loss) from Continuing Operations: |
||||||||||||||||
| Basic |
$ | 15.11 | $ | (2.82 | ) | $ | (0.48 | ) | $ | (0.19 | ) | |||||
| Diluted |
$ | 14.84 | (2.82 | ) | $ | (0.48 | ) | $ | (0.19 | ) | ||||||
| Net Income (Loss): |
||||||||||||||||
| Basic |
$ | 15.11 | $ | (2.82 | ) | $ | (0.48 | ) | $ | (0.19 | ) | |||||
| Diluted |
$ | 14.84 | $ | (2.82 | ) | $ | (0.48 | ) | $ | (0.19 | ) | |||||
| Cash Dividends Paid |
$ | 0.02 | $ | 0.02 | $ | 0.02 | $ | 0.02 | ||||||||
34
Table of Contents
| Fiscal Year 2009 | ||||||||||||||||
| Quarter Ended | ||||||||||||||||
| December 31, 2008 |
March 31, 2009 |
June 30, 2009 |
September 30, 2009(3) |
|||||||||||||
| Net Sales |
$ | 108,648 | $ | 124,302 | $ | 142,291 | $ | 147,322 | ||||||||
| Gross Margin |
(2,970 | ) | (5,822 | ) | 304 | 19,541 | ||||||||||
| Income from Continuing Operations |
(580 | ) | (12,578 | ) | (10,481 | ) | (188 | ) | ||||||||
| Income from Discontinued Operations |
644 | — | — | — | ||||||||||||
| Net Income |
64 | (12,578 | ) | (10,481 | ) | (188 | ) | |||||||||
| Earnings Per Share: |
||||||||||||||||
| Income (Loss) from Continuing Operations: |
||||||||||||||||
| Basic |
$ | (0.05 | ) | $ | (1.07 | ) | $ | (0.89 | ) | $ | (0.02 | ) | ||||
| Diluted |
(0.05 | ) | (1.07 | ) | (0.89 | ) | (0.02 | ) | ||||||||
| Income from Discontinued Operations: |
||||||||||||||||
| Basic |
$ | 0.06 | $ | — | $ | — | $ | — | ||||||||
| Diluted |
0.06 | — | — | — | ||||||||||||
| Net Income (Loss): |
||||||||||||||||
| Basic |
$ | 0.01 | $ | (1.07 | ) | $ | (0.89 | ) | $ | (0.02 | ) | |||||
| Diluted |
0.01 | (1.07 | ) | (0.89 | ) | (0.02 | ) | |||||||||
| Cash Dividends Paid |
$ | 0.07 | $ | 0.07 | $ | 0.02 | $ | 0.02 | ||||||||
| (1) | Includes $278.5 million of gains recognized on settlement on insurance claims. |
| (2) | Includes gains (losses) on derivative contracts intended to hedge future raw sugar costs of $18.9 million in the first quarter, ($24.8) million in the second quarter, $10.7 million in the third quarter and $30.6 million in the fourth quarter of fiscal 2010. |
| (3) | Includes $27.9 million of gains on derivative contracts intended to hedge fiscal 2010 raw sugar costs. |
| ITEM 9. | Changes in and Disagreements with Accountants on Accounting and Financial Disclosure |
None.
| ITEM 9A. | Controls and Procedures |
Management’s Evaluation of Disclosure Controls and Procedures
In accordance with Exchange Act Rules 13a-15 and 15d-15, we carried out an evaluation, under the supervision and with the participation of management, including our President and Chief Executive Officer and our Senior Vice President and Chief Financial Officer, of the effectiveness of our disclosure controls and procedures as of the end of the period covered by this report. Based on that evaluation, our President and Chief Executive Officer and our Senior Vice President and Chief Financial Officer concluded that our disclosure controls and procedures were effective as of September 30, 2010 to ensure that information required to be disclosed in our reports filed or submitted under the Exchange Act is recorded, processed, summarized and reported within the time periods specified in the Securities and Exchange Commission’s rules and forms and that such information is accumulated and communicated to our management, including our Chief Executive Officer and Chief Financial Officer, as appropriate, to allow timely decisions regarding required disclosures.
Management’s Report on Internal Control over Financial Reporting
Management’s report on internal control over financial reporting as of September 30, 2010 can be found under “Item 15. Exhibits, Financial Statements Schedules.”
35
Table of Contents
Changes in Internal Control over Financial Reporting
There has been no change in our internal control over financial reporting that occurred during the three months ended September 30, 2010 that has materially affected, or is reasonably likely to materially affect, our internal control over financial reporting.
| ITEM 9B. | Other Information |
None
36
Table of Contents
PART III
| ITEM 10. | Directors, Executive Officers and Corporate Governance |
| ITEM 11. | Executive Compensation |
| ITEM 12. | Security Ownership of Certain Beneficial Owners and Management and Related Shareholder Matters |
| ITEM 13. | Certain Relationships and Related Transactions, and Director Independence |
| ITEM 14. | Principal Accountant Fees and Services |
Information regarding our executive officers is included in Part I of this report. The other information required by Items 10, 11, 12, 13 and 14 will be included in our definitive proxy statement for the 2011 Annual Meeting of Shareholders, which will be filed with the Securities and Exchange Commission within 120 days after September 30, 2010, and is incorporated in this report by reference.
PART IV
| ITEM 15. | Exhibits, Financial Statement Schedules |
(a)(1) Financial Statements.
| Item |
Page | |||
| Management’s Report on Internal Control Over Financial Reporting |
41 | |||
| Reports of Independent Registered Public Accounting Firm |
42 | |||
| Consolidated Financial Statements: |
||||
| Consolidated Balance Sheets at September 30, 2010 and 2009 |
44 | |||
| Consolidated Statements of Operations for the years ended September 30, 2010, 2009 and 2008 |
45 | |||
| Consolidated Statements of Changes in Shareholders’ Equity for the years ended September 30, 2010, 2009 and 2008 |
46 | |||
| Consolidated Statements of Cash Flows for the years ended September 30, 2010, 2009 and 2008 |
47 | |||
| Notes to Consolidated Financial Statements |
48 | |||
(a)(2) Financial Statement Schedules.
All schedules and other statements for which provision is made in the applicable regulations of the SEC have been omitted because they are not required under the relevant instructions or are inapplicable.
(a)(3) Exhibits.
| Exhibit No. |
Document | |
| *3(a)(1) | Amended and Restated Articles of Incorporation of Reorganized Imperial Sugar (previously filed as Exhibit 3.1 to the Form 8-K dated September 12, 2001 and incorporated herein by reference). | |
| *3(a)(2) | Articles of Amendment dated February 28, 2002, to the Amended and Restated Articles of Incorporation (previously filed as Exhibit 3(a)(2) to the 2002 Form 10-K and incorporated herein by reference). | |
| *3(b) | Amended and Restated By-Laws of Reorganized Imperial Sugar (previously filed as an Exhibit to the Form 8-K dated September 12, 2001 and incorporated herein by reference). | |
37
Table of Contents
| Exhibit No. |
Document | |
| The Company is a party to several long-term debt instruments under which the total amount of securities authorized does not exceed 10% of the total assets of the Company and its subsidiaries on a consolidated basis. Pursuant to paragraph 4 (iii)(A) of Item 601 (b) of Regulation S-K, the Company agrees to furnish a copy of such instruments to the Securities and Exchange Commission upon request. | ||
| *4(a) | Rights Agreement dated as of December 31, 2002 between the Company and The Bank of New York (previously filed as Exhibit 4(a) to the 2002 Form 10-K and incorporated herein by reference). | |
| *4(b) | Amendment, dated October 10, 2008, to Rights Agreement between Imperial Sugar Company and The Bank of New York (previously filed as Exhibit 4.1 to the Form 8-K dated October 10, 2008 and incorporated herein by reference). | |
| *†10(a)(1) | Executive Employment Agreement with John C. Sheptor (previously filed as Exhibit 10.1 to the Form 8-K dated August 10, 2009 and incorporated herein by reference). | |
| *†10(a)(2) | Severance and Change of Control Agreement for Louis T. Bolognini (previously filed as Exhibit 10.2 to the Form 8-K dated August 10, 2009 and incorporated herein by reference). | |
| *†10(a)(3) | Severance and Change of Control Agreement for Patrick D. Henneberry (previously filed as Exhibit 10.3 to the Form 8-K dated August 10, 2009 and incorporated herein by reference). | |
| * †10(a)(4) | Specimen of Change in Control Agreement for certain of Imperial Sugar’s officers (previously filed as Exhibit 10(a)(6) to the 2008 Form 10-K and incorporated herein by reference). | |
| †10(a)(5) | Schedule of Change in Control Agreements. | |
38
Table of Contents
| Exhibit No. |
Document | |
| *†10(b) | Imperial Holly Corporation Retirement Plan For Non-employee Directors (previously filed as Exhibit 10(j) to the 1994 Form 10-K and incorporated herein by reference). | |
| *†10(c)(1) | Long-Term Incentive Plan of Reorganized Imperial Sugar Company (previously filed as Exhibit 10(f) to the 2001 Form 10-K and incorporated herein by reference). | |
| *†10(c)(2) | Second Amendment to Long Term Incentive Plan (previously filed as Exhibit 10.1 to the Form 8-K dated January 16, 2008 and incorporated herein by reference). | |
| *†10(c)(3) | Specimen of Imperial Sugar Company Long Term Incentive Plan Non Qualified Stock Option Award Agreement (previously filed as Exhibit 10(e)(2) to the 2005 Form 10-K and incorporated herein by reference). | |
| *10(d)(1) | Amended and Restated Credit Agreement dated as of December 1, 2004 among the financial institutions named therein, as lenders, Bank of America, N.A., as administrative agent, and Imperial Sugar Company (previously filed as an Exhibit to the Form 8-K dated December 1, 2004 and incorporated by reference herein). | |
| *10(d)(2) | Omnibus Amendment to Amended and Restated Credit Agreement dated January 1, 2006 by and among Bank of America, N.A., as administrative agent, and Imperial Sugar Company and the other borrowers and obligated parties thereto (previously filed as Exhibit 4(b)(1) to the March 2006 Form 10-Q and incorporated herein by reference). | |
| *10(d)(3) | Second Amendment to Amended and Restated Credit Agreement dated March 15, 2006 by and among Bank of America, N.A., as administrative agent, and Imperial Sugar Company and the other borrowers and obligated parties thereto (previously filed as Exhibit 4(b)(2) to the March 2006 Form 10-Q and incorporated herein by reference). | |
| *10(d)(4) | Third Amendment to Amended and Restated Credit Agreement dated July 30, 2007 by and among Bank of America, N.A., as administrative agent, and Imperial Sugar Company and the other borrowers and obligated parties thereto (previously filed as Exhibit 4 to the June 2007 Form 10-Q and incorporated herein by reference). | |
| †10(e) | Summary of Imperial Sugar Company Management Incentive Plan for fiscal 2010 and 2011. | |
| *10(f) | Member Contribution Agreement dated as of November 19, 2009 by and among Louisiana Sugar Refining, LLC, Imperial-Savannah LP, Sugar Growers and Refiners, Inc., and Cargill, Incorporated (previously filed as Exhibit 2.1 to the Form 8-K dated November 19, 2009 and incorporated herein by reference). | |
| *10(g) | Third Amended and Restated Limited Liability Company Agreement of Louisiana Sugar Refining, LLC dated as of November 19, 2009 (previously filed as Exhibit 10.1 to the Form 8-K dated November 19, 2009 and incorporated herein by reference). | |
| 14 | Code of ethics | |
| *21 | Subsidiaries of Imperial Sugar Company (previously filed as Exhibit 21 to the 2009 Form 10-K and incorporated by reference). | |
| 23 | Consent of Independent Registered Public Accounting Firm. | |
| 31.1 | Certification required by Rule 13a-14(a) or Rule 15d-14(a) under the Securities Exchange Act of 1934. | |
| 31.2 | Certification required by Rule 13a-14(a) or Rule 15d-14(a) under the Securities Exchange Act of 1934. | |
| 32 | Certifications required by Rule 13a-14(b) or Rule 15d-14(b) under the Securities Exchange Act of 1934 and 18 U.S.C. Section 1350. | |
| * | Indicates we have previously filed the exhibit with the SEC as indicted in the document description. We incorporate those previously filed exhibits in this report by reference. |
| † | Identifies management contracts or compensatory plans or arrangements required to be filed as an exhibit hereto. |
39
Table of Contents
SIGNATURES
Pursuant to the requirements of Section 13 or 15(d) the Securities Exchange Act of 1934, the registrant has duly caused this report to be signed on its behalf by the undersigned, thereunto duly authorized, on December 28, 2010.
| IMPERIAL SUGAR COMPANY | ||
| By: | /S/ JOHN C. SHEPTOR | |
| John C. Sheptor | ||
| President and Chief Executive Officer | ||
Pursuant to the requirements of the Securities Exchange Act of 1934, this report has been signed below by the following persons on behalf of the registrant and in the capacities indicated on December 28, 2010
| Signature |
Title | |
| /S/ JOHN C. SHEPTOR John C. Sheptor |
Director, President and Chief Executive Officer (Principal Executive Officer) | |
| /S/ H.P. MECHLER H. P. Mechler |
Senior Vice President and Chief Financial Officer (Principal Financial Officer and Principal | |
| /S/ JAMES J. GAFFNEY James J. Gaffney |
Chairman of the Board of Directors | |
| /S/ GAYLORD O. COAN Gaylord O. Coan |
Director | |
| /S/ YVES-ANDRE ISTEL Yves-Andre Istel |
Director | |
| /S/ RONALD C. KESSELMAN Ronald C. Kesselman |
Director | |
| /S/ DAVID C. MORAN David C. Moran |
Director | |
| /S/ JOHN E. STOKELY John E. Stokely |
Director | |
| /S/ JOHN K. SWEENEY John K. Sweeney |
Director | |
40
Table of Contents
MANAGEMENT’S REPORT ON INTERNAL CONTROL OVER FINANCIAL REPORTING
Management, including Imperial Sugar Company’s principal executive officer and principal financial and accounting officer, is responsible for establishing and maintaining adequate internal control over Imperial Sugar Company’s financial reporting. Management conducted an evaluation of the effectiveness of internal control over financial reporting based on the Internal Control—Integrated Framework issued by the Committee of Sponsoring Organizations of the Treadway Commission. Based on this evaluation, management concluded that Imperial Sugar Company’s internal control over financial reporting was effective as of September 30, 2010.
The effectiveness of our internal control over financial reporting as of September 30, 2010, was audited by Deloitte & Touche LLP, an independent registered public accounting firm, as stated in their report which is included herein.
| /s/ John C. Sheptor |
/s/ H.P. Mechler | |
| John C. Sheptor |
H.P. Mechler | |
| President and Chief Executive Officer |
Senior Vice President and Chief Financial Officer | |
| (Principal Executive Officer) |
(Principal Financial Officer and Principal Accounting Officer) |
41
Table of Contents
REPORT OF INDEPENDENT REGISTERED PUBLIC ACCOUNTING FIRM
To the Board of Directors and Shareholders of
Imperial Sugar Company
Sugar Land, Texas
We have audited the internal control over financial reporting of Imperial Sugar Company and subsidiaries (the “Company”) as of September 30, 2010, based on criteria established in Internal Control—Integrated Framework issued by the Committee of Sponsoring Organizations of the Treadway Commission. The Company’s management is responsible for maintaining effective internal control over financial reporting and for its assessment of the effectiveness of internal control over financial reporting, included in the accompanying Management’s Report on Internal Control over Financial Reporting. Our responsibility is to express an opinion on the Company’s internal control over financial reporting based on our audit.
We conducted our audit in accordance with the standards of the Public Company Accounting Oversight Board (United States). Those standards require that we plan and perform the audit to obtain reasonable assurance about whether effective internal control over financial reporting was maintained in all material respects. Our audit included obtaining an understanding of internal control over financial reporting, assessing the risk that a material weakness exists, testing and evaluating the design and operating effectiveness of internal control based on the assessed risk, and performing such other procedures as we considered necessary in the circumstances. We believe that our audit provides a reasonable basis for our opinion.
A company’s internal control over financial reporting is a process designed by, or under the supervision of, the company’s principal executive and principal financial officers, or persons performing similar functions, and effected by the company’s board of directors, management, and other personnel to provide reasonable assurance regarding the reliability of financial reporting and the preparation of financial statements for external purposes in accordance with generally accepted accounting principles. A company’s internal control over financial reporting includes those policies and procedures that (1) pertain to the maintenance of records that, in reasonable detail, accurately and fairly reflect the transactions and dispositions of the assets of the company; (2) provide reasonable assurance that transactions are recorded as necessary to permit preparation of financial statements in accordance with generally accepted accounting principles, and that receipts and expenditures of the company are being made only in accordance with authorizations of management and directors of the company; and (3) provide reasonable assurance regarding prevention or timely detection of unauthorized acquisition, use, or disposition of the company’s assets that could have a material effect on the financial statements.
Because of the inherent limitations of internal control over financial reporting, including the possibility of collusion or improper management override of controls, material misstatements due to error or fraud may not be prevented or detected on a timely basis. Also, projections of any evaluation of the effectiveness of the internal control over financial reporting to future periods are subject to the risk that the controls may become inadequate because of changes in conditions, or that the degree of compliance with the policies or procedures may deteriorate.
In our opinion, the Company maintained, in all material respects, effective internal control over financial reporting as of September 30, 2010, based on the criteria established in Internal Control—Integrated Framework issued by the Committee of Sponsoring Organizations of the Treadway Commission.
We have also audited, in accordance with the standards of the Public Company Accounting Oversight Board (United States), the consolidated financial statements as of and for the year ended September 30, 2010 of the Company and our report dated December 28, 2010 expressed an unqualified opinion on those financial statements and included an explanatory paragraph relating to the explosion and fire on February 7, 2008 at the Company’s sugar refinery in Port Wentworth, Georgia.
/s/ DELOITTE & TOUCHE LLP
Houston, Texas
December 28, 2010
42
Table of Contents
REPORT OF INDEPENDENT REGISTERED PUBLIC ACCOUNTING FIRM
To the Board of Directors and Shareholders of
Imperial Sugar Company
Sugar Land, Texas
We have audited the accompanying consolidated balance sheets of Imperial Sugar Company and subsidiaries (the “Company”) as of September 30, 2010 and 2009, and the related consolidated statements of operations, changes in shareholders’ equity, and cash flows for each of the three years in the period ended September 30, 2010. These financial statements are the responsibility of the Company’s management. Our responsibility is to express an opinion on the financial statements based on our audits.
We conducted our audits in accordance with the standards of the Public Company Accounting Oversight Board (United States). Those standards require that we plan and perform the audit to obtain reasonable assurance about whether the financial statements are free of material misstatement. An audit includes examining, on a test basis, evidence supporting the amounts and disclosures in the financial statements. An audit also includes assessing the accounting principles used and significant estimates made by management, as well as evaluating the overall financial statement presentation. We believe that our audits provide a reasonable basis for our opinion.
In our opinion, such consolidated financial statements present fairly, in all material respects, the financial position of Imperial Sugar Company and subsidiaries at September 30, 2010 and 2009 and the results of their operations and their cash flows for each of the three years in the period ended September 30, 2010, in conformity with accounting principles generally accepted in the United States of America.
As discussed in Note 2 to the consolidated financial statements, the Company experienced an explosion and fire on February 7, 2008 at its sugar refinery in Port Wentworth, Georgia, in which the refinery’s bulk storage silos and virtually its entire packaging capabilities were destroyed.
We have also audited, in accordance with the standards of the Public Company Accounting Oversight Board (United States), the Company’s internal control over financial reporting as of September 30, 2010, based on the criteria established in Internal Control—Integrated Framework issued by the Committee of Sponsoring Organizations of the Treadway Commission and our report dated December 28, 2010 expressed an unqualified opinion on the Company’s internal control over financial reporting.
/s/ DELOITTE & TOUCHE LLP
Houston, Texas
December 28, 2010
43
Table of Contents
IMPERIAL SUGAR COMPANY AND SUBSIDIARIES
CONSOLIDATED BALANCE SHEETS
| September 30, | ||||||||
| 2010 | 2009 | |||||||
| (In Thousands of Dollars) | ||||||||
| ASSETS | ||||||||
| Current Assets: |
||||||||
| Cash and Cash Equivalents |
$ | 22,750 | $ | 115,584 | ||||
| Marketable Securities |
198 | 56 | ||||||
| Accounts Receivable—Net |
55,093 | 34,601 | ||||||
| Inventories: |
||||||||
| Finished Products |
30,526 | 18,434 | ||||||
| Raw and In-Process Materials |
67,133 | 83,215 | ||||||
| Supplies |
15,716 | 10,626 | ||||||
| Total Inventory |
113,375 | 112,275 | ||||||
| Deferred Income Taxes—Net |
— | 16,215 | ||||||
| Prepaid Expenses and Other Current Assets |
40,949 | 14,873 | ||||||
| Total Current Assets |
232,365 | 293,604 | ||||||
| Other Investments |
15,952 | 10,930 | ||||||
| Property, Plant and Equipment—Net |
280,211 | 252,913 | ||||||
| Deferred Income Taxes—Net |
10,624 | 55,940 | ||||||
| Other Assets |
2,414 | 2,553 | ||||||
| Total |
$ | 541,566 | $ | 615,940 | ||||
| LIABILITIES AND SHAREHOLDERS’ EQUITY | ||||||||
| Current Liabilities: |
||||||||
| Accounts Payable—Trade |
$ | 109,999 | $ | 87,141 | ||||
| Borrowing under Revolving Credit Line |
22,000 | 60,000 | ||||||
| Deferred Income Taxes—Net |
11,427 | — | ||||||
| Other Current Liabilities |
54,189 | 28,390 | ||||||
| Insurance Advances, Net |
— | 227,475 | ||||||
| Total Current Liabilities |
197,615 | 403,006 | ||||||
| Deferred Employee Benefits and Other Liabilities |
125,219 | 126,500 | ||||||
| Commitments and Contingencies |
||||||||
| Shareholders’ Equity: |
||||||||
| Preferred Stock, Without Par Value, Issuable in Series; 5,000,000 Shares Authorized, None Issued |
— | — | ||||||
| Common Stock, Without Par Value; 50,000,000 Shares Authorized; 12,145,098 and 12,026,354 Shares Issued at September 30, 2010 and 2009 |
130,168 | 128,421 | ||||||
| Retained Earnings |
163,834 | 27,922 | ||||||
| Accumulated Other Comprehensive Loss |
(75,270 | ) | (69,909 | ) | ||||
| Total Shareholders’ Equity |
218,732 | 86,434 | ||||||
| Total |
$ | 541,566 | $ | 615,940 | ||||
See notes to consolidated financial statements.
44
Table of Contents
IMPERIAL SUGAR COMPANY AND SUBSIDIARIES
CONSOLIDATED STATEMENTS OF OPERATIONS
| Year Ended September 30, | ||||||||||||
| 2010 | 2009 | 2008 | ||||||||||
| (In Thousands of Dollars, Except Share and Per Share Amounts) |
||||||||||||
| Net Sales |
$ | 908,033 | $ | 522,563 | $ | 592,423 | ||||||
| Business Interruption Insurance Recovery |
84,677 | |||||||||||
| Cost of Sales (includes depreciation of $21,776,000, $12,356,000 and $11,059,000 for the years ended September 30, 2010, 2009 and 2008, respectively) |
(927,302 | ) | (511,510 | ) | (585,919 | ) | ||||||
| Selling, General and Administrative Expense (includes depreciation of $1,261,000, $1,923,000 and $2,871,000 for the years ended September 30, 2010, 2009 and 2008, respectively) |
(41,434 | ) | (45,760 | ) | (45,430 | ) | ||||||
| Refinery Explosion Related Charges, Net |
(8,600 | ) | (53,793 | ) | (63,348 | ) | ||||||
| Insurance Recoveries Recognized |
193,796 | 30,404 | 36,121 | |||||||||
| Gain on Litigation Settlement |
— | 16,148 | — | |||||||||
| Operating Income (Loss) |
209,170 | (41,948 | ) | (66,153 | ) | |||||||
| Interest Expense |
(1,721 | ) | (1,474 | ) | (1,667 | ) | ||||||
| Interest Income |
52 | 489 | 2,662 | |||||||||
| Other Income—Net |
5,542 | 3,048 | 13,355 | |||||||||
| Income (Loss) from Continuing Operations Before Income Taxes |
213,043 | (39,885 | ) | (51,803 | ) | |||||||
| Benefit (Provision) for Income Taxes |
(76,183 | ) | 16,058 | 30,622 | ||||||||
| Income (Loss) from Continuing Operations |
136,860 | (23,827 | ) | (21,181 | ) | |||||||
| Income (Loss) from Discontinued Operations |
— | 644 | 260 | |||||||||
| Net Income (Loss) |
$ | 136,860 | $ | (23,183 | ) | $ | (20,921 | ) | ||||
| Basic Earnings (Loss) per Share of Common Stock: |
||||||||||||
| Income (Loss) from Continuing Operations |
$ | 11.59 | $ | (2.03 | ) | $ | (1.81 | ) | ||||
| Income (Loss) from Discontinued Operations |
— | 0.05 | 0.02 | |||||||||
| Net Income (Loss) |
$ | 11.59 | $ | (1.98 | ) | $ | (1.79 | ) | ||||
| Diluted Earnings (Loss) per Share of Common Stock: |
||||||||||||
| Income (Loss) from Continuing Operations |
$ | 11.33 | $ | (2.03 | ) | $ | (1.81 | ) | ||||
| Income (Loss) from Discontinued Operations |
— | 0.05 | 0.02 | |||||||||
| Net Income (Loss) |
$ | 11.33 | $ | (1.98 | ) | $ | (1.79 | ) | ||||
| Weighted Average Shares Outstanding: |
||||||||||||
| Basic |
11,805,587 | 11,721,357 | 11,657,622 | |||||||||
| Diluted |
12,082,000 | 11,721,357 | 11,657,622 | |||||||||
See notes to consolidated financial statements.
45
Table of Contents
IMPERIAL SUGAR COMPANY AND SUBSIDIARIES
CONSOLIDATED STATEMENTS OF CHANGES IN SHAREHOLDERS’ EQUITY
| Shares of Common Stock |
Common Stock |
Retained Earnings |
Accumulated Other Comprehensive |
Total | ||||||||||||||||
| (In Thousands of Dollars) | ||||||||||||||||||||
| BALANCE September 30, 2007 |
11,808,743 | $ | 123,665 | $ | 104,586 | $ | (28,160 | ) | $ | 200,091 | ||||||||||
| Comprehensive Loss: |
||||||||||||||||||||
| Net Loss |
(20,921 | ) | (20,921 | ) | ||||||||||||||||
| Change in Unrealized Securities Gains and Losses (Net of Tax of $18,000) |
(31 | ) | (31 | ) | ||||||||||||||||
| Change in Derivative Fair Value (Net of Tax of $1,454,000) |
(2,575 | ) | (2,575 | ) | ||||||||||||||||
| Reclassification from Accumulated Other Comprehensive Income to Net Income (Net of Tax of $983,000) |
1,741 | 1,741 | ||||||||||||||||||
| Foreign Currency Translation Adjustment (Net of Tax of $10,000) |
(18 | ) | (18 | ) | ||||||||||||||||
| Change in Pension and Other Postretirement Benefits Liability (Net of Tax of $3,694,000) |
(6,702 | ) | (6,702 | ) | ||||||||||||||||
| Total Comprehensive Loss |
(28,506 | ) | ||||||||||||||||||
| Cumulative Effect of a Change in Accounting Principle |
2,864 | 2,864 | ||||||||||||||||||
| Dividends ($2.78 per share) |
(32,706 | ) | (32,706 | ) | ||||||||||||||||
| Stock Options and Warrants Exercised and Restricted Stock Grants, Net |
156,184 | 2,327 | 2,327 | |||||||||||||||||
| BALANCE September 30, 2008 |
11,964,927 | 125,992 | 53,823 | (35,745 | ) | 144,070 | ||||||||||||||
| Comprehensive Loss: |
||||||||||||||||||||
| Net Loss |
(23,183 | ) | (23,183 | ) | ||||||||||||||||
| Change in Derivative Fair Value (Net of Tax of $1,845,000) |
(3,262 | ) | (3,262 | ) | ||||||||||||||||
| Reclassification from Accumulated Other Comprehensive Income to Net Income (Net of Tax of $2,691,000) |
4,757 | 4,757 | ||||||||||||||||||
| Foreign Currency Translation Adjustment (Net of Tax of $54,000) |
(96 | ) | (96 | ) | ||||||||||||||||
| Change in Pension and Other Postretirement Benefits Liability (Net of Tax of $20,247,000) |
(35,796 | ) | (35,796 | ) | ||||||||||||||||
| Total Comprehensive Loss |
(57,580 | ) | ||||||||||||||||||
| Adjustments to Apply FAS 158 Measurement Date Change for Pension and Other Postretirement Benefits (Net of Tax of $126,000) |
(629 | ) | 233 | (396 | ) | |||||||||||||||
| Dividends ($0.18 per share) |
(2,089 | ) | (2,089 | ) | ||||||||||||||||
| Stock Options Exercised and Restricted Stock Grants, Net |
61,427 | 2,429 | 2,429 | |||||||||||||||||
| BALANCE September 30, 2009 |
12,026,354 | 128,421 | 27,922 | (69,909 | ) | 86,434 | ||||||||||||||
| Comprehensive Income: |
||||||||||||||||||||
| Net Income |
136,860 | 136,860 | ||||||||||||||||||
| Change in Derivative Fair Value (Net of Tax of $688,000) |
(1,233 | ) | (1,233 | ) | ||||||||||||||||
| Reclassification from Accumulated Other Comprehensive Income to Net Income (Net of Tax of $540,000) |
967 | 967 | ||||||||||||||||||
| Foreign Currency Translation Adjustment (Net of Tax of $89,000) |
160 | 160 | ||||||||||||||||||
| Change in Pension and Other Postretirement Benefits Liability (Net of Tax of $2,933,000) |
(5,255 | ) | (5,255 | ) | ||||||||||||||||
| Total Comprehensive Income |
131,499 | |||||||||||||||||||
| Dividends ($0.08 per share) |
(948 | ) | (948 | ) | ||||||||||||||||
| Restricted Stock Grants, Net |
118,744 | 1,747 | 1,747 | |||||||||||||||||
| BALANCE September 30, 2010 |
12,145,098 | $ | 130,168 | $ | 163,834 | $ | (75,270 | ) | $ | 218,732 | ||||||||||
See notes to consolidated financial statements.
46
Table of Contents
IMPERIAL SUGAR COMPANY AND SUBSIDIARIES
CONSOLIDATED STATEMENTS OF CASH FLOWS
| Year Ended September 30, | ||||||||||||
| 2010 | 2009 | 2008 | ||||||||||
| (In Thousands of Dollars) | ||||||||||||
| Operating Activities: |
||||||||||||
| Net Income (Loss) |
$ | 136,860 | $ | (23,183 | ) | $ | (20,921 | ) | ||||
| Adjustments to Reconcile Net Income (Loss) to Net Cash Provided by Operating Activities: |
||||||||||||
| Depreciation |
23,037 | 14,279 | 13,930 | |||||||||
| Deferred Income Taxes |
75,970 | (16,032 | ) | (18,647 | ) | |||||||
| Reclassification from Accumulated Other Comprehensive Loss to Net Income |
1,506 | 7,448 | 2,724 | |||||||||
| Cash Received on Change in Fair Value of Derivative Instruments |
(1,922 | ) | (5,108 | ) | (4,029 | ) | ||||||
| Equity Earnings in Unconsolidated Subsidiaries |
(4,435 | ) | (2,481 | ) | (1,754 | ) | ||||||
| Income from Discontinued Operations |
— | (644 | ) | (260 | ) | |||||||
| Stock-Based Compensation Expense |
1,992 | 2,502 | 2,284 | |||||||||
| Excess Tax Benefits from Stock-Based Compensation |
39 | 141 | (456 | ) | ||||||||
| Savannah Event Related Impairment Charges: |
||||||||||||
| Inventory destroyed or damaged |
— | 1,639 | 6,752 | |||||||||
| Property Plant and Equipment |
— | 405 | 13,019 | |||||||||
| Insurance Recoveries Recognized |
(278,473 | ) | (30,404 | ) | (36,121 | ) | ||||||
| Advances from Insurance Carriers |
— | 60,000 | 86,981 | |||||||||
| Other |
254 | (174 | ) | 520 | ||||||||
| Changes in Operating Assets and Liabilities: |
||||||||||||
| Accounts Receivable |
(20,492 | ) | (6,137 | ) | 21,205 | |||||||
| Income Tax Receivable |
— | 12,704 | (12,704 | ) | ||||||||
| Inventories |
(1,100 | ) | (13,966 | ) | (6,580 | ) | ||||||
| Prepaid Expenses and Other Assets |
(2,710 | ) | (5,789 | ) | (2,021 | ) | ||||||
| Accounts Payable—Trade |
44,779 | 10,344 | (20,978 | ) | ||||||||
| Other Liabilities |
(7,242 | ) | (4,829 | ) | 6,727 | |||||||
| Net Cash Provided by (Used in) Continuing Operations |
(31,937 | ) | 715 | 29,671 | ||||||||
| Net Cash Provided by Discontinued Operations |
— | 1,015 | — | |||||||||
| Net Cash Provided by (Used in) Operating Activities |
(31,937 | ) | 1,730 | 29,671 | ||||||||
| Investing Activities: |
||||||||||||
| Capital Expenditures |
(72,337 | ) | (160,762 | ) | (17,714 | ) | ||||||
| Advances from Insurance Carriers |
51,000 | 134,000 | 13,019 | |||||||||
| Investment in Wholesome Sweeteners |
— | — | (4,000 | ) | ||||||||
| Investment in Marketable Securities |
— | — | (193,402 | ) | ||||||||
| Proceeds from Maturity of Marketable Securities |
— | — | 205,852 | |||||||||
| Proceeds from Sale of Marketable Securities |
— | 7,754 | 512 | |||||||||
| Proceeds from Sales of Assets |
— | 538 | — | |||||||||
| Other |
(266 | ) | (7 | ) | 355 | |||||||
| Net Cash Provided by (Used in) Investing Activities |
(21,603 | ) | (18,477 | ) | 4,622 | |||||||
| Financing Activities: |
||||||||||||
| Borrowing (Repayments) under Revolving Credit Line—Net |
(38,000 | ) | 60,000 | — | ||||||||
| Repayment of Long-Term Debt |
— | — | (1,500 | ) | ||||||||
| Cash Dividends |
(1,050 | ) | (2,319 | ) | (32,756 | ) | ||||||
| Stock Option and Warrant Proceeds |
— | 79 | 104 | |||||||||
| Excess Tax Benefits from Stock-Based Compensation |
(39 | ) | (141 | ) | 456 | |||||||
| Other |
(205 | ) | (11 | ) | (103 | ) | ||||||
| Net Cash Provided by (Used in) Financing Activities |
(39,294 | ) | 57,608 | (33,799 | ) | |||||||
| Increase (Decrease) in Cash and Cash Equivalents |
(92,834 | ) | 40,861 | 494 | ||||||||
| Cash and Cash Equivalents, Beginning of Period |
115,584 | 74,723 | 74,229 | |||||||||
| Cash and Cash Equivalents, End of Period |
$ | 22,750 | $ | 115,584 | $ | 74,723 | ||||||
| Supplemental Non-Cash Items: |
||||||||||||
| Tax Effect of Deferred Gains and Losses |
$ | 2,992 | $ | 19,330 | $ | 4,281 | ||||||
| Purchase of Property, Plant and Equipment on Account |
$ | 6,797 | $ | 28,718 | $ | — | ||||||
47
Table of Contents
IMPERIAL SUGAR COMPANY AND SUBSIDIARIES
NOTES TO CONSOLIDATED FINANCIAL STATEMENTS
September 30, 2010, 2009 and 2008
1. ACCOUNTING POLICIES
The Company/Basis of Presentation
The consolidated financial statements include the accounts of Imperial Sugar Company and its wholly owned subsidiaries (the Company). All significant intercompany balances and transactions have been eliminated. The Company operates its business as one domestic segment—the production and sale of refined sugar and related products. The Company has evaluated subsequent events through December 28, 2010, which is the date the financial statements were available to be issued.
Business Risks
The Company is significantly affected by market factors, including demand for and price of refined sugar and raw cane sugar and the price and availability of energy. These factors are influenced by a variety of external forces, including the number of domestic acres contracted to grow sugar cane and sugar beets, prices of competing crops, supply and price of raw cane sugar in the world, health and eating trends, competing sweeteners, weather conditions and United States farm and trade policy. Federal legislation and regulations provide for mechanisms designed to support the price of domestic sugar crops, principally through the limitations on importation of raw cane sugar for domestic consumption and marketing allotments.
A significant portion of the Company’s industrial sales are made under fixed price, forward sales contracts, which generally extend up to one year and occasionally longer. The Company also contracts to purchase raw cane sugar substantially in advance of the time it delivers the refined sugar produced from the purchase. To mitigate its exposure to future price changes, the Company attempts to manage the volume of refined sugar sales contracted for future delivery in relation to the volume of raw cane sugar contracted for future receipt and utilizes traded raw sugar futures, when feasible.
Use of Estimates
The preparation of financial statements in conformity with accounting principles generally accepted in the United States of America requires estimates and assumptions that affect the reported amounts as well as certain disclosures. The Company’s financial statements include amounts that are based on management’s best estimates and judgments. Actual results could differ from those estimates.
Cash and Cash Equivalents
Cash equivalents consist of short-term, highly liquid investments with maturities of 90 days or less at the time of purchase.
Marketable Securities
The Company’s marketable securities which are classified as “available for sale” are reflected in the Consolidated Balance Sheet at fair market value, with the aggregate unrealized gains or losses, net of related deferred taxes, included as a separate component of comprehensive income within shareholders’ equity.
Trade Receivables
The Company accounts for trade receivables balances net of allowances for doubtful accounts. The allowance balance is determined based upon a review of prior loss history, trends in credit quality statistics, individual customer credit extensions and other factors.
48
Table of Contents
IMPERIAL SUGAR COMPANY AND SUBSIDIARIES
NOTES TO CONSOLIDATED FINANCIAL STATEMENTS—(Continued)
September 30, 2010, 2009 and 2008
Advertising and Promotion
Cost of developing and distributing advertisements is expensed as incurred. Coupon redemptions are estimated based on historical redemption rates and accrued for during the coupon distribution period. Advertising expenses are reported in Selling, General and Administrative Expense. Customer advertising reimbursements and other customer promotional activities are accrued as the related sales are made and recorded as reductions of Net Sales.
Inventories
Inventories are stated at the lower of cost or market. Cost of sugar is determined under the last-in, first-out (LIFO) method. All other costs are determined under the first-in, first-out (FIFO) or average method. LIFO inventory at September 30, 2010 and 2009 was $33.1 million and $4.0 million lower than the amount which would be reported on the FIFO inventory valuation method. Sugar inventory quantities at September 30, 2010 declined below the September 30, 2009 balance, resulting in the liquidation of a LIFO inventory layer with a cost approximately $3.4 million below the cost of current purchases. Raw and in-process materials includes $3.1 million and $2.2 million of in-process materials at September 30, 2010 and 2009. Supplies inventory includes operating and packaging supplies as well as maintenance parts utilized in the Company’s manufacturing operations. Obsolescence reserve for supplies inventory was $1.7 million at September 30, 2010 and $1.7 million at September 30, 2009.
Revenue Recognition
The Company recognizes revenues when products are shipped under contract terms or approved purchase orders at stated prices and all significant obligations of the Company have been satisfied. Risk of loss passes at time of shipment. Provisions are made for estimated returns and estimated credit losses.
Insurance Recoveries
Insurance recoveries that are deemed to be probable and reasonably estimable are recognized to the extent of the related loss. Insurance recoveries which result in gains, including recoveries under business interruption coverage, are recognized only when realized by settlement with the insurers. Advances on insurance settlements are recorded as liabilities or offsets to accrued probable recoveries and are categorized in the Statement of Cash Flows based on the nature of the activity underlying the recovery. The evaluation of insurance recoveries requires estimates and judgments about future results which affect reported amounts and certain disclosures. Actual results could differ from those estimates.
Hedge Accounting
The Company uses raw sugar futures and options in its raw sugar purchasing programs and uses natural gas futures, options and basis swaps to hedge natural gas purchases used in its manufacturing operations. The Company applies hedge accounting to these cash flow hedge instruments if the hedge instrument is expected to be effective and if the Company is able to reasonably forecast the amount and timing of the future purchased transaction. Under hedge accounting, eligible gains and losses on raw sugar futures and options are deferred and recognized as part of the cost of inventory purchases and charged or credited to cost of sales as such inventory is sold. Eligible gains and losses on natural gas futures, options and basis swaps are deferred and recognized as part of the cost of the natural gas purchases and charged to cost of sales in the period the forecasted purchase impacts earnings. The Company recognizes gains and losses on derivative instruments in current earnings, if the requirements of hedge accounting are not met.
49
Table of Contents
IMPERIAL SUGAR COMPANY AND SUBSIDIARIES
NOTES TO CONSOLIDATED FINANCIAL STATEMENTS—(Continued)
September 30, 2010, 2009 and 2008
Property and Depreciation
Property is stated at cost and includes expenditures for renewals and improvements and capitalized interest. Maintenance and repairs are charged to current operations. The Company capitalizes certain costs in connection with the development of internal-use computer software. When property is retired or otherwise disposed of, the cost and related accumulated depreciation are removed from the respective accounts, and any gain or loss on disposition is included in income.
Depreciation is provided principally on the straight-line method over the estimated service lives of the assets. In general, buildings are depreciated over 12 to 30 years and machinery and equipment over 10 to 15 years.
Impairment of Long-Lived Assets
Long-lived assets to be held and used are reviewed for impairment whenever events or changes in circumstances indicate that the carrying amount of such assets may not be recoverable. Determination of recoverability is based on an estimate of undiscounted future cash flows resulting from the use of the asset or its disposition. Measurement of an impairment loss for long-lived assets and certain identifiable intangible assets that management expects to hold and use are based on the fair value of the asset. Long-lived assets to be disposed of are reported at the lower of carrying amount or fair value, less cost to sell.
Fair Value of Financial Instruments
The fair value of financial instruments is estimated based upon market trading information, where available. Absent published market values for an instrument, management estimates the fair value of debt based on quotations from broker/dealers or interest rate information for similar instruments. The carrying amount of cash and cash equivalents, accounts receivable, accounts payable and other current liabilities approximates fair value because of the short maturity and/or frequent repricing of those instruments.
Federal Income Taxes
Federal income tax expense includes the current tax obligation or benefit and the change in deferred income tax liability for the period. Deferred income taxes result from temporary differences between financial and tax bases of certain assets and liabilities. The Company evaluates the realizability of deferred tax assets quarterly. When, based on all available evidence, it is more likely than not that a deferred tax asset will not be realized, a valuation allowance is established that is, in management’s judgement, sufficient to reduce the asset to an amount that is more likely than not to be realized.
Stock-Based Compensation
The Company recognizes compensation expense for awards of equity instruments based on the grant date fair value of those awards.
Environmental Matters
The Company provides for environmental remediation costs based on estimates of known environmental remediation exposure when such amounts are probable and estimable. Ongoing environmental compliance costs, including maintenance and monitoring costs, are expensed as incurred. Capital costs incurred to prevent future environmental contamination are capitalized.
50
Table of Contents
IMPERIAL SUGAR COMPANY AND SUBSIDIARIES
NOTES TO CONSOLIDATED FINANCIAL STATEMENTS—(Continued)
September 30, 2010, 2009 and 2008
New Accounting Pronouncements
In June 2009, the FASB issued authoritative guidance which requires additional information regarding transfers of financial assets, including securitization transactions, and where companies have continuing exposure to the risks related to transferred financial assets. The guidance eliminates the concept of a “qualifying special-purpose entity,” changes the requirements for derecognizing financial assets, and requires additional disclosures. It is effective for fiscal years beginning after November 15, 2009. This guidance, will not have a material impact on the Company’s consolidated financial statements.
2. INSURANCE RECOVERIES
The Company experienced an industrial accident on February 7, 2008, at its sugar refinery in Port Wentworth, Georgia, which is located near Savannah, Georgia. Production at the refinery, which comprises approximately 60% of the Company’s capacity, was suspended until the summer of 2009 when limited bulk production was commenced. Packaging production was initiated in the fall of 2009.
The Company settled its property insurance claim related to the Port Wentworth accident in December 2009 for an aggregate of $345 million. Insurance recoveries aggregating $66.5 million which were previously deemed probable and reasonably estimable were recognized to the extent of the related loss in prior periods. The remaining $278.5 million of recoveries were recognized as gains in fiscal 2010, as follows (in millions):
| Total Insurance Recovery |
Recognized in Fiscal Year Ended September 30, 2010 |
Recognized Through the Year Ended September 30, 2009 |
||||||||||
| Business interruption |
$ | 84.7 | $ | 84.7 | $ | — | ||||||
| Property replacement cost |
212.4 | 189.2 | 23.2 | |||||||||
| Payroll and other incurred costs |
47.9 | 4.6 | 43.3 | |||||||||
| Total |
$ | 345.0 | $ | 278.5 | $ | 66.5 | ||||||
Financial reporting gains recognized for replacement cost recoveries are not recognized for tax purposes to the extent the Company made elections under the involuntary conversion rules of the Internal Revenue Code, as the insurance proceeds have been reinvested in replacement property within the required period of time. The replacement cost expenditures establish a new basis in the assets for financial reporting purposes, resulting in higher depreciation charges. The tax basis in the replaced assets will be reduced by the amount of the gain not recognized under the involuntary conversion rules.
3. COMMITMENTS AND CONTINGENCIES
The Company is party to a number of claims, including twenty remaining lawsuits brought on behalf of 13 employees or their families and 7 third parties or their families, for injuries and losses suffered as a result of the Port Wentworth industrial refinery accident. None of the lawsuits demand a specific dollar amount of damages sought by the plaintiffs. During fiscal 2010, the Company settled twenty-eight lawsuits seeking recovery of injuries and losses from the Port Wentworth accident, with the settlement payments made to these claimants being funded by the Company’s insurers.
The Company has workers compensation insurance which provides for coverage equal to the statutory benefits provided to workers under state law. Additionally, the Company’s general liability policy provides for coverage for damages to third parties up to a policy limit of $100 million. While the Company believes, based on
51
Table of Contents
IMPERIAL SUGAR COMPANY AND SUBSIDIARIES
NOTES TO CONSOLIDATED FINANCIAL STATEMENTS—(Continued)
September 30, 2010, 2009 and 2008
the facts of these cases, that claims by employees and certain contractors are limited to benefits provided under Georgia workers compensation law, the ultimate resolution of these matters could result in liability in excess of the amount accrued. The Company believes the likelihood of the aggregate liability, including the amounts paid in the settlements discussed above, exceeding the $100 million policy limit is remote.
In August 2010, the Company filed suit in the District Court of Fort Bend County, Texas, against one of its general liability excess insurers, XL Insurance Company America, Inc. (“XL”). XL issued a $25 million policy of insurance (a portion of the $100 million coverage described above) that provides coverage for lawsuits filed as a result of the Port Wentworth industrial refinery accident. XL, which has not denied coverage for payments for settlements or judgments, asserts that its policy does not include coverage of defense costs in litigation. The Company’s lawsuit seeks a declaration that pursuant to the insurance policy it issued to the Company, XL is required to pay the Company’s costs of defense in lawsuits filed by employees and third parties and their families for injuries and losses suffered as a result of the Port Wentworth refinery accident. XL subsequently had the lawsuit removed to the United States District Court for the Southern District of Texas.
Following the Port Wentworth accident, OSHA conducted investigations at the Company’s Port Wentworth and Gramercy refineries. OSHA concluded its Port Wentworth and Gramercy investigations on July 25, 2008, and issued numerous citations with total proposed penalties of $5.1 million in Port Wentworth and $3.7 million in Gramercy. Additionally, OSHA issued requirements for certain abatement actions to be undertaken by the Company at the Port Wentworth and Gramercy facilities. In July 2010, the Company settled the Port Wentworth and Gramercy citations and agreed to pay aggregate penalties of $6.05 million in four quarterly installments commencing in August 2010. The Company made no admission of liability in the settlements. The Company also agreed to abate the citations and to implement certain other measures related to worker and facility safety. The penalties, which had been provided for in prior fiscal years, are not covered by insurance and are not deductible for federal income tax purposes.
In January 2009, a shareholder filed a derivative lawsuit in the District Court of Harris County, Texas against twelve current and former directors and officers of the Company and named the Company as a nominal defendant, alleging mismanagement and breaches of fiduciary duty by the Company’s officers, directors and employees relating to the February 7, 2008 explosion at the Company’s refinery in Port Wentworth, Georgia. In October 2010, a settlement of the litigation and of the derivative claim of another shareholder was approved by the court. The terms of the settlement provide for implementation by the Company of certain management and governance measures and for the payment of attorneys’ fees of the derivative plaintiffs, which payment was made by the Company’s insurer. The defendants made no admission of liability in the settlement.
The Company’s workers compensation insurance contract requires the reimbursement of the carrier for certain loss-based assessments the carrier receives from the state of Georgia’s Subsequent Injury Trust Fund which are based on losses paid during a calendar year. The Company recorded a $3.7 million charge in fiscal 2010 attributable to losses paid in calendar 2008 and 2009.
In December 2010, AdvancePierre Foods, Inc. filed suit against the Company and its distributor, Evergeen Sweeteners, Inc. in the United States District Court for the Western District of North Carolina seeking damages in connection with sugar that had been voluntarily recalled by the Company in July 2010. The claims asserted against the Company seek recovery of losses allegedly incurred by the plaintiff due to its incorporation of recalled sugar in food products. Although the complaint does not specify alleged damages, the plaintiff previously indicated that its damages were approximately $3.2 million. The Company believes that its general liability insurance policy provides coverage for the damages asserted in connection with these claims, and that it may have additional coverage for these claims through another insurance policy. The insurer who provides the
52
Table of Contents
IMPERIAL SUGAR COMPANY AND SUBSIDIARIES
NOTES TO CONSOLIDATED FINANCIAL STATEMENTS—(Continued)
September 30, 2010, 2009 and 2008
primary layer of coverage up to $1 million of limits has assumed the defense of this lawsuit. An insurer that provides excess coverage above $1 million of damages as part of the Company’s general liability program has denied coverage for these property damage claims. The Company believes that this excess insurance coverage is enforceable to respond to these claims.
In November 2010, the Company filed suit in the Fort Bend County, Texas District Court against Hills Fuel Company, its supplier of coal, for breach of contract. The supplier failed to make deliveries due under the contract and the Company has been sourcing its supply of coal at prices higher than stipulated under the contract.
The Company is party to other litigation and claims which are normal in the course of its operations. While the results of such litigation and claims cannot be predicted with certainty, the Company believes the final outcome of such matters will not have a materially adverse effect on its consolidated results of operations, financial position or cash flows. In connection with the sales of certain businesses, the Company made customary representations and warranties, and undertook indemnification obligations with regard to certain of these representations and warranties including financial statements, environmental and tax matters, and the conduct of the businesses prior to the sale. These indemnification obligations are subject to certain deductibles, caps and expiration dates
In connection with the sale of a subsidiary in 2002, the buyer assumed $18.5 million of industrial revenue bonds, with final maturity in 2025. The Company remains contingently liable for repayment of the bonds under a guaranty arrangement and does not believe that a liability is probable. The Company has recorded a non-current liability for the $2.0 million fair value of the guarantee.
The Company, along with other sugar industry participants, was party to a lawsuit with McNeil Nutritional, which was settled in November 2008. The Company received $16.1 million in connection with the settlement and reported a gain on litigation settlement.
4. LSR VENTURE
In November 2009, the Company completed the formation and funding of a three-party joint venture with Sugar Growers and Refiners, Inc (“SUGAR”) and Cargill, Incorporated (“Cargill”) to construct and operate a new 3,100 ton-per-day cane sugar refinery in Gramercy, Louisiana adjacent to the Company’s existing sugar refinery.
The venture, Louisiana Sugar Refining, LLC (“LSR”), is owned one-third by each member, each of which agreed to contribute $30 million in cash or assets as equity to capitalize the venture. SUGAR’s contribution was $30 million cash; Cargill contributed $23.5 million cash and certain equipment and intellectual property valued at $6.5 million. The Company’s contribution, which will occur in three stages, consists of the existing refinery assets with a book value of approximately $27.9 million at September 30, 2010, including approximately 207 acres of land.
The Company will operate the existing refinery with sales and earnings for its own account until December 31, 2010, during which time the Company was required to complete certain improvements. The equipment and personal property in the existing refinery (other than the small packaging assets) will be contributed to LSR on January 1, 2011. After January 1, 2011, the Company will continue to operate the small bag packing facility in Gramercy, with 3.5 million cwt of refined bulk sugar purchased from LSR under a long term, supply agreement with market-based pricing provisions.
53
Table of Contents
IMPERIAL SUGAR COMPANY AND SUBSIDIARIES
NOTES TO CONSOLIDATED FINANCIAL STATEMENTS—(Continued)
September 30, 2010, 2009 and 2008
The Company contributed the footprint parcel of approximately 7 acres of land for the new refinery at the initial closing. Pursuant to the terms of the operative agreements, LSR and Imperial jointly enrolled the entire site (including the footprint parcel) in the Voluntary Remediation Program (the “VRP”) of the Louisiana Department of Environmental Quality to conduct an environmental assessment of the site and complete remediation of any identified contamination. The Company is required to pay for the cost of remediation if the VRP uncovers contamination above the applicable industrial standard. The Company will convey the remainder of the land to LSR upon completion of the VRP and be released of future environmental liabilities to state and federal authorities. The VRP site assessment is underway to determine the extent of required remediation.
LSR has entered into financing agreements aggregating $145 million to provide construction and working capital financing for the project. The financing is non-recourse to LSR’s members. The members have agreed to proportionately contribute additional capital to LSR if necessary to cover certain construction cost overruns and certain costs relating to the VRP that LSR agreed to assume. Construction costs of the new refinery, which is expected to commence operations in the summer of 2011, are estimated at $120 million. The existing Gramercy refinery will operate during the construction and start-up phase of the new refinery. LSR’s raw cane sugar will be supplied by SUGAR through an evergreen raw sugar supply agreement. Cargill will serve as marketer of the refined sugar produced by LSR, other than refined sugar sold to Imperial.
5. MARKETABLE SECURITIES AND OTHER INVESTMENTS
The Company’s marketable securities at September 30, 2010 and 2009 consisted of (in thousands):
| September 30, | ||||||||
| 2010 | 2009 | |||||||
| U.S. Treasury Securities |
$ | 142 | $ | — | ||||
| Certificate of Deposit |
56 | 56 | ||||||
| Total Marketable Securities |
$ | 198 | $ | 56 | ||||
Other investments at September 30, 2010 and 2009 consisted of (in thousands):
| September 30, | ||||||||
| 2010 | 2009 | |||||||
| Equity Investments: |
||||||||
| Comercializadora Santos Imperial S. de R.L. de C.V. |
$ | 4,432 | $ | 2,573 | ||||
| Wholesome Sweeteners Inc.(1) |
10,869 | 7,974 | ||||||
| Other |
268 | — | ||||||
| Cost Basis Investments: |
||||||||
| Intercontinental Commodity Exchange Stock |
383 | 383 | ||||||
| Total |
$ | 15,952 | $ | 10,930 | ||||
| (1) | Includes intangibles, net of amortization of $2.1 million and $2.8 million at September 30, 2010 and 2009, resulting from the July 2008 purchase of an additional 5% interest in Wholesome Sweeteners Inc. |
54
Table of Contents
IMPERIAL SUGAR COMPANY AND SUBSIDIARIES
NOTES TO CONSOLIDATED FINANCIAL STATEMENTS—(Continued)
September 30, 2010, 2009 and 2008
6. ACCOUNTS RECEIVABLE
Accounts receivable are reported net of an allowance for credit losses of $0.6 million at September 30, 2010 and $0.4 million at September 30, 2009. The provision for credit losses charged to selling, general and administrative expenses was an expense of $0.2 million in fiscal 2010, an expense of $0.2 million in fiscal 2009 and a credit of $0.6 million in fiscal 2008.
7. PROPERTY, PLANT AND EQUIPMENT
Property, plant and equipment consisted of the following (in thousands of dollars):
| September 30, | ||||||||
| 2010 | 2009 | |||||||
| Land |
$ | 3,703 | $ | 3,737 | ||||
| Buildings, Machinery and Equipment |
351,678 | 255,186 | ||||||
| Construction in Progress |
15,890 | 63,478 | ||||||
| Total |
371,271 | 322,401 | ||||||
| Less Accumulated Depreciation |
(91,206 | ) | (69,488 | ) | ||||
| Property, Plant and Equipment—Net |
$ | 280,065 | $ | 252,913 | ||||
8. DEBT
The Company has a senior secured revolving credit facility (“Revolver”) providing for loans of up to $100 million (subject to a borrowing base). This facility is used to finance various ongoing capital needs of the Company as well as for other general corporate purposes. The Revolver matures on December 31, 2011 and will have no financial covenants so long as average total liquidity (defined as the average of the borrowing base, less average actual borrowings and letters of credit) exceeds $20 million; otherwise a minimum EBITDA test would apply. The Revolver limits the Company’s ability to pay dividends if average total liquidity, after adjustment on a pro forma basis for such payment, is less than $20 million. Average total liquidity during fiscal 2010 was $110 million. The facility is secured by the Company’s cash and cash equivalents, accounts receivable, inventory, certain investments and certain plant, property, and equipment. All subsidiaries of the Company are borrowers or guarantors under the facility. At September 30, 2010 the Company had $22 million outstanding under the revolving credit facility with a fair value of $21.7 million.
Interest rates on the Revolver are LIBOR plus a margin that varies (with liquidity as defined) from 1.00% to 1.75%, or the base rate (Bank of America prime rate) plus a margin of negative 0.25% to positive 0.25%.
Although the final maturity of the Revolver is December 31, 2011, the Company classifies debt under the Revolver as current, as the agreement contains a subjective acceleration clause which can be exercised, if, in the opinion of the lender, there is a material adverse effect, and provides the lenders direct access to our cash receipts.
Cash paid for interest on debt and other long-term liabilities was $1.5 million, $1.7 million and $1.0 million for the years ended September 30, 2010, 2009 and 2008, respectively. Interest capitalized as part of the cost of constructing assets was $0.3 million and $0.8 million for the years ended September 30, 2010 and 2009, respectively. No interest was capitalized in fiscal 2008.
55
Table of Contents
IMPERIAL SUGAR COMPANY AND SUBSIDIARIES
NOTES TO CONSOLIDATED FINANCIAL STATEMENTS—(Continued)
September 30, 2010, 2009 and 2008
9. INCOME TAXES
The components of the consolidated income tax provision (benefit) were as follows (in thousands of dollars):
| Year Ended September 30, | ||||||||||||
| 2010 | 2009 | 2008 | ||||||||||
| Federal: |
||||||||||||
| Current |
$ | — | $ | (100 | ) | $ | (12,043 | ) | ||||
| Deferred |
73,924 | (15,926 | ) | (5,985 | ) | |||||||
| State: |
||||||||||||
| Current |
213 | 445 | 68 | |||||||||
| Deferred |
2,046 | (477 | ) | (311 | ) | |||||||
| Total Before Valuation Allowance |
76,183 | (16,058 | ) | (18,271 | ) | |||||||
| Valuation Allowance |
— | — | (12,351 | ) | ||||||||
| Total |
$ | 76,183 | $ | (16,058 | ) | $ | (30,622 | ) | ||||
The consolidated income tax provision from continuing operations is different from the amount which would be provided by applying the statutory federal income tax rate of 35% to the Company’s income before taxes. The reasons for the differences from the statutory rate are as follows (in thousands of dollars):
| Year Ended September 30, | ||||||||||||
| 2010 | 2009 | 2008 | ||||||||||
| Income Taxes Computed at the Statutory Federal Rate |
$ | 74,564 | $ | (13,605 | ) | $ | (18,131 | ) | ||||
| State Income Taxes, Net of Federal Benefit |
2,259 | (32 | ) | (243 | ) | |||||||
| Effect of Amended Prior Year Return Permanent Items |
— | (2,673 | ) | — | ||||||||
| Other |
(640 | ) | 252 | 103 | ||||||||
| Valuation Allowance |
— | — | (12,351 | ) | ||||||||
| Total |
$ | 76,183 | $ | (16,058 | ) | $ | (30,622 | ) | ||||
Income taxes paid were $0.7 million, $0.1 million and $0.5 million in fiscal 2010, 2009 and 2008, respectively.
56
Table of Contents
IMPERIAL SUGAR COMPANY AND SUBSIDIARIES
NOTES TO CONSOLIDATED FINANCIAL STATEMENTS—(Continued)
September 30, 2010, 2009 and 2008
The tax effects of temporary differences which give rise to the Company’s deferred tax assets and liabilities were as follows (in thousands of dollars):
| September 30, 2010 | September 30, 2009 | |||||||||||||||||||||||
| Assets | Liabilities | Total | Assets | Liabilities | Total | |||||||||||||||||||
| Current: |
||||||||||||||||||||||||
| Inventory Valuation Differences |
$ | — | $ | (4,296 | ) | $ | (4,296 | ) | $ | — | $ | (4,006 | ) | $ | (4,006 | ) | ||||||||
| Accruals Not Currently Deductible |
1,282 | — | 1,282 | 1,332 | — | 1,332 | ||||||||||||||||||
| Taxable Insurance Proceeds |
— | — | — | 25,007 | — | 25,007 | ||||||||||||||||||
| Deferred Gains on Sugar Futures |
— | (7,622 | ) | (7,622 | ) | — | (6,342 | ) | (6,342 | ) | ||||||||||||||
| Other |
— | (791 | ) | (791 | ) | 224 | — | 224 | ||||||||||||||||
| Total Current |
1,282 | (12,709 | ) | (11,427 | ) | 26,563 | (10,348 | ) | 16,215 | |||||||||||||||
| Noncurrent: |
||||||||||||||||||||||||
| Depreciable Asset Basis Differences |
— | (62,498 | ) | (62,498 | ) | 1,195 | — | 1,195 | ||||||||||||||||
| Pensions |
40,486 | — | 40,486 | 31,636 | — | 31,636 | ||||||||||||||||||
| Accruals Not Currently Deductible |
1,485 | — | 1,485 | 11,126 | — | 11,126 | ||||||||||||||||||
| Operating Loss Carryforwards |
30,365 | — | 30,365 | 7,722 | — | 7,722 | ||||||||||||||||||
| Credit Carryforwards |
3,713 | — | 3,713 | 3,443 | — | 3,443 | ||||||||||||||||||
| Capital Loss Carryforwards |
— | — | 1,879 | — | 1,879 | |||||||||||||||||||
| Other |
— | (2,927 | ) | (2,927 | ) | 14 | (1,075 | ) | (1,061 | ) | ||||||||||||||
| Total Noncurrent |
76,049 | (65,425 | ) | 10,624 | 57,015 | (1,075 | ) | 55,940 | ||||||||||||||||
| Total |
$ | 77,331 | $ | (78,134 | ) | $ | (803 | ) | $ | 83,578 | $ | (11,423 | ) | $ | 72,155 | |||||||||
The Company has a net operating loss carryforward for federal income tax purposes of $83.2 million, of which, $21.1 million expires through 2029 and $62.1 million expires in 2030.
A reconciliation of the change in the amount of unrecognized tax benefits for the twelve months ended September 30, 2010, is as follows (in thousands):
| Tax | Interest | Total | ||||||||||
| Balance, October 1, 2009 |
$ | 4,864 | $ | 1,225 | $ | 6,089 | ||||||
| Additions based on tax positions related to the current year |
286 | 285 | 571 | |||||||||
| Reductions for tax positions of prior years |
(219 | ) | — | (219 | ) | |||||||
| Balance, September 30, 2010 |
$ | 4,931 | 1,510 | 6,441 | ||||||||
Substantially all of the $4.9 million unrecognized benefits would affect the Company’s effective tax rate if recognized. The Company recorded $0.3 million of interest expense in the year ended September 30, 2010 as a result of positions taken in prior years. Interest and penalties recognized in the Consolidated Balance Sheet at September 30, 2010 were $2.0 million. The Company classifies interest and penalties related to unrecognized tax benefits as interest and tax expense, respectively.
The Company files tax returns in the U.S. federal jurisdiction and various state jurisdictions. The Company is currently open to audit under the statute of limitations by the Internal Revenue Service for the fiscal years 2006 through 2009. The Company or its subsidiaries’ state tax returns are open to audit under the statute of limitations for the fiscal years 2006 through 2009.
57
Table of Contents
IMPERIAL SUGAR COMPANY AND SUBSIDIARIES
NOTES TO CONSOLIDATED FINANCIAL STATEMENTS—(Continued)
September 30, 2010, 2009 and 2008
10. PENSION AND OTHER BENEFIT PROGRAMS
Defined Benefit Pension Plans and Postretirement Benefits Other Than Pensions
Substantially all of the Company’s employees are covered by retirement plans. Retirement benefits are primarily a function of years of service and the employee’s compensation for a defined period of employment. In 2003, the Company froze the benefits under the salaried pension plan resulting in reductions in future pension obligations. The Company funds pension costs at an actuarially determined amount based on normal cost and the amortization of prior service costs, gains and losses over the remaining service periods. Additionally, the Company previously provided a supplemental non-qualified, unfunded pension plan for certain management members as well as a non-qualified retirement plan for non-employee directors, which provided benefits based upon years of service as a director and the retainer in effect at the date of a director’s retirement. Certain of the Company’s employees who meet the applicable eligibility requirements are covered by benefit plans that provide postretirement health care and life insurance benefits to employees.
The Company adopted the measurement date provisions of amended authoritative guidance from the FASB related to accounting for defined benefit pension plans and other postretirement plans effective October 1, 2008. As a result of this change, pension and postretirement obligations were measured at September 30th in fiscal 2009 and 2010, as compared to a June 30th measurement date in prior years. The Company applied the “one measurement” approach in its adoption. The effect of applying the measurement date provisions to the balance sheet was as follows:
| Assets: |
Before Application |
Adjustments | After Application |
|||||||||
| Deferred Income Taxes, Net |
$ | 34,062 | $ | 213 | $ | 34,275 | ||||||
| Liabilities and Shareholders Equity: |
||||||||||||
| Deferred Employee Benefits and Other Liabilities |
78,459 | 609 | 79,068 | |||||||||
| Retained Earnings |
53,823 | (629 | ) | 53,194 | ||||||||
| Accumulated Other Comprehensive Loss |
35,745 | (233 | ) | 35,512 | ||||||||
58
Table of Contents
IMPERIAL SUGAR COMPANY AND SUBSIDIARIES
NOTES TO CONSOLIDATED FINANCIAL STATEMENTS—(Continued)
September 30, 2010, 2009 and 2008
The following tables present the benefit obligations, changes in plan assets, the funded status of the pension and postretirement benefits plans and the assumptions used (in thousands of dollars):
| Pension Benefits | ||||||||||||
| Year Ended September 30, | ||||||||||||
| 2010 | 2009 | 2008 | ||||||||||
| Change in Benefit Obligation: |
||||||||||||
| Benefit Obligation at Beginning of Measurement Period |
$ | 219,294 | $ | 190,958 | $ | 199,124 | ||||||
| Adjustment to Fiscal Year End Measurement Date |
— | 3,370 | — | |||||||||
| Service Cost |
1,164 | 1,058 | 1,063 | |||||||||
| Interest Cost |
11,294 | 12,911 | 12,301 | |||||||||
| Amendments |
(235 | ) | — | — | ||||||||
| Actuarial (Gain)/Loss |
11,174 | 29,052 | (5,878 | ) | ||||||||
| Expenses Paid |
(916 | ) | (1,051 | ) | (1,470 | ) | ||||||
| Benefits Paid |
(13,720 | ) | (17,004 | ) | (14,182 | ) | ||||||
| Benefits Obligation at End of Measurement Period |
$ | 228,055 | $ | 219,294 | $ | 190,958 | ||||||
| Change in Plan Assets: |
||||||||||||
| Fair Value of Plan Assets at Beginning of Measurement Period |
$ | 120,415 | $ | 136,015 | $ | 142,230 | ||||||
| Adjustment for Fourth Quarter Contributions |
— | 3,324 | — | |||||||||
| Adjustment to Fiscal Year End Measurement Date |
— | 2,943 | — | |||||||||
| Actual Return on Plan Assets |
10,729 | (14,451 | ) | (6,154 | ) | |||||||
| Employer Contribution |
13,564 | 10,639 | 15,591 | |||||||||
| Expenses Paid |
(916 | ) | (1,051 | ) | (1,470 | ) | ||||||
| Benefits Paid |
(13,720 | ) | (17,004 | ) | (14,182 | ) | ||||||
| Fair Value of Plan Assets at End of Measurement Period |
$ | 130,072 | $ | 120,415 | $ | 136,015 | ||||||
| Funded Status at End of Measurement Period |
$ | (97,983 | ) | $ | (98,879 | ) | $ | (54,943 | ) | |||
| Adjustment for Fourth Quarter Contributions |
— | — | 3,324 | |||||||||
| Accrued Pension Cost at September 30 |
$ | (97,983 | ) | $ | (98,879 | ) | $ | (51,619 | ) | |||
| Current Liabilities |
$ | (819 | ) | $ | (772 | ) | $ | (592 | ) | |||
| Noncurrent Liabilities |
(97,164 | ) | (98,107 | ) | (51,027 | ) | ||||||
| $ | (97,983 | ) | $ | (772 | ) | $ | (592 | ) | ||||
| Amounts Recognized in Accumulated Other Comprehensive Loss: |
||||||||||||
| Net Actuarial Loss |
$ | 122,371 | $ | 114,908 | $ | 60,963 | ||||||
| Prior Service Cost |
415 | 772 | 925 | |||||||||
| Total |
$ | 122,786 | $ | 115,680 | $ | 61,888 | ||||||
59
Table of Contents
IMPERIAL SUGAR COMPANY AND SUBSIDIARIES
NOTES TO CONSOLIDATED FINANCIAL STATEMENTS—(Continued)
September 30, 2010, 2009 and 2008
| Postretirement Benefits Other Than Pensions | ||||||||||||
| Year Ended September 30, | ||||||||||||
| 2010 | 2009 | 2008 | ||||||||||
| Change in Benefit Obligation: |
||||||||||||
| Benefit Obligation at Beginning of Measurement Period |
$ | 8,898 | $ | 8,674 | $ | 9,618 | ||||||
| Adjustment to Fiscal Year End Measurement Date |
— | 142 | — | |||||||||
| Service Cost |
18 | 11 | 13 | |||||||||
| Interest Cost |
452 | 585 | 587 | |||||||||
| Actuarial (Gain)/Loss |
118 | 406 | (829 | ) | ||||||||
| Benefits Paid |
(805 | ) | (920 | ) | (715 | ) | ||||||
| Benefits Obligation at End of Measurement Period |
$ | 8,681 | $ | 8,898 | $ | 8,674 | ||||||
| Change in Plan Assets: |
||||||||||||
| Fair Value of Plan Assets at Beginning of Measurement Period |
$ | — | — | — | ||||||||
| Employer Contribution |
805 | $ | 920 | $ | 715 | |||||||
| Benefits Paid |
(805 | ) | (920 | ) | (715 | ) | ||||||
| Fair Value of Plan Assets at End of Measurement Period |
$ | — | $ | — | $ | — | ||||||
| Funded Status at End of Measurement Period |
$ | (8,681 | ) | $ | (8,898 | ) | $ | (8,674 | ) | |||
| Adjustment for Fourth Quarter Contributions |
— | — | 183 | |||||||||
| Accrued Benefit Cost at September 30 |
$ | (8,681 | ) | $ | (8,898 | ) | $ | (8,491 | ) | |||
| Current Liabilities |
$ | (766 | ) | $ | (812 | ) | $ | (860 | ) | |||
| Noncurrent Liabilities |
(7,915 | ) | (8,086 | ) | (7,631 | ) | ||||||
| $ | (8,681 | ) | $ | (8,898 | ) | $ | (8,491 | ) | ||||
| Amounts Recognized in Accumulated Other Comprehensive Loss: |
||||||||||||
| Net Actuarial Loss |
$ | 6,777 | $ | 7,289 | $ | 7,390 | ||||||
| Prior Service Cost |
(12,534 | ) | (14,128 | ) | (16,121 | ) | ||||||
| Total |
$ | (5,757 | ) | $ | (6,839 | ) | $ | (8,731 | ) | |||
60
Table of Contents
IMPERIAL SUGAR COMPANY AND SUBSIDIARIES
NOTES TO CONSOLIDATED FINANCIAL STATEMENTS—(Continued)
September 30, 2010, 2009 and 2008
The assumptions used and the annual costs related to these plans consist of the following (in thousands of dollars):
| Year Ended September 30, | ||||||||||||
| 2010 | 2009 | 2008 | ||||||||||
| Pension Benefits |
||||||||||||
| Weighted-average Assumptions: |
||||||||||||
| Discount Rate |
||||||||||||
| At measurement date |
4.82 | % | 5.33 | % | 6.75 | % | ||||||
| For the year ended |
5.33 | % | 7.63 | % | 6.41 | % | ||||||
| Expected Return on Plan Assets |
7.00 | % | 8.0 | % | 8.0 | % | ||||||
| Components of Net Periodic Benefit Cost of Company-sponsored Plans (in thousands): |
||||||||||||
| Service Cost |
$ | 1,164 | $ | 1,058 | $ | 1,063 | ||||||
| Interest Cost |
11,294 | 12,911 | 12,301 | |||||||||
| Expected Return on Plan Assets |
(10,300 | ) | (11,703 | ) | (11,642 | ) | ||||||
| Amortization of Prior Service Cost |
122 | 122 | 123 | |||||||||
| Recognized Actuarial Loss |
3,282 | 917 | 1,556 | |||||||||
| Total Pension Cost |
$ | 5,562 | $ | 3,305 | $ | 3,401 | ||||||
| Net Actuarial Loss |
$ | 10,744 | $ | 55,206 | $ | 11,749 | ||||||
| Prior Service Cost |
(235 | ) | — | — | ||||||||
| Amortization of Prior Service Cost |
(122 | ) | (123 | ) | (122 | ) | ||||||
| Amortization of Actuarial (Loss) |
(3,282 | ) | (1,291 | ) | (1,388 | ) | ||||||
| Total Recognized in Accumulated Other Comprehensive Loss |
$ | 7,105 | $ | 53,792 | $ | 10,239 | ||||||
| Total Recognized in Net Periodic Benefit Cost and Other Comprehensive Income |
$ | 12,667 | $ | 57,097 | $ | 13,640 | ||||||
The prior service cost and estimated net loss for the defined benefit pension plans that will be amortized from accumulated other comprehensive income into net periodic benefit cost over the next fiscal year is $77,000 and $4,322,000, respectively.
| Year Ended September 30, | ||||||||||||
| 2010 | 2009 | 2008 | ||||||||||
| Postretirement Benefits Other Than Pensions |
||||||||||||
| Discount Rate Assumptions |
4.82 | % | 5.33 | % | 6.75 | % | ||||||
| Components of Net Periodic Benefit Cost (in thousands): |
||||||||||||
| Service Cost |
$ | 18 | $ | 11 | $ | 13 | ||||||
| Interest Cost |
452 | 584 | 587 | |||||||||
| Amortization of Prior Service Cost |
(1,594 | ) | (1,594 | ) | (1,594 | ) | ||||||
| Recognized Actuarial Loss |
645 | 398 | 519 | |||||||||
| Net Periodic Benefit Cost (Credit) |
$ | (479 | ) | $ | (601 | ) | $ | (475 | ) | |||
| Net Actuarial Loss/(Gain) |
$ | 118 | $ | 406 | $ | (829 | ) | |||||
| Amortization of Prior Service Cost |
1,594 | 1,993 | 1,594 | |||||||||
| Amortization of Actuarial Gain/(Loss) |
(645 | ) | (507 | ) | (519 | ) | ||||||
| Total Recognized in Accumulated Other Comprehensive Loss |
$ | 1,067 | $ | 1,892 | $ | 246 | ||||||
| Total Recognized in Net Periodic Benefit Cost and Other Comprehensive Income |
$ | 588 | $ | 1,291 | $ | (229 | ) | |||||
61
Table of Contents
IMPERIAL SUGAR COMPANY AND SUBSIDIARIES
NOTES TO CONSOLIDATED FINANCIAL STATEMENTS—(Continued)
September 30, 2010, 2009 and 2008
The prior service cost credit and estimated net loss for postretirement benefits other than pensions that will be amortized from accumulated other comprehensive income into net periodic benefit cost over the next fiscal year is $1,594,000 and $635,000, respectively.
Aggregated accumulated benefit obligations for all plans were $228.1 million and $219.0 million at September 30, 2010 and 2009, respectively. Accumulated benefit obligations were in excess of plan assets for all plans for both periods.
Pension plan contributions, which are based on regulatory requirements, totaled $12.8 million and $10.6 million during fiscal 2010 and 2009; contributions during fiscal 2011 are expected to be approximately $15.5 million.
The assumed health care cost trend rate used in measuring the accumulated benefit obligation for postretirement benefits other than pensions as of September 30, 2010 was 8.5% for 2010. The rate was assumed to decrease gradually to 5% for fiscal 2018 and remain at that level thereafter. Assumed health care cost trend rates have a significant effect on the amounts reported for the health care plan. A one-percentage-point change in assumed health care cost trend rates would have the following effects:
| 1-Percentage Point Increase |
1-Percentage Point Decrease |
|||||||
| (In Thousands of Dollars) | ||||||||
| Effect on Total Service and Interest Cost |
$ | 16 | $ | (14 | ) | |||
| Effect on Postretirement Benefit Obligation |
371 | (331 | ) | |||||
The plan assets of the defined benefit pension plans are held in a third party master trust, which is administered by the Company’s Welfare and Benefits Committee (Committee). The Committee oversees the trust activities and the financial integrity of the pension plans by establishing and managing funds for the immediate and future needs of the plans’ operations and programs.
The primary investment objective for the portfolio of assets is to meet or exceed the future obligations of the plans’ participants. Financial risks and returns are managed through diversification of plan assets, selection of investment managers and quarterly review of portfolio performance results. Plan asset investments are broadly diversified primarily into marketable securities, such as equity and high quality fixed income securities. Target allocations among various asset categories achieve a target mix that is the strategic allocation for the portfolio. Minimum and maximum criteria are used to set boundaries for each target allocation to ensure the portfolio does not drift from the target mix.
The Company’s plan assets actual and target allocation percentages were as follows:
| September 30, 2010 |
September 30, 2009 |
|||||||||||||||
| Asset Category |
Actual | Target | Actual | Target | ||||||||||||
| Intermediate Fixed Income |
31 | % | 32 | % | 42 | % | 32 | % | ||||||||
| Large Cap Equity |
18 | % | 22 | % | 17 | % | 22 | % | ||||||||
| Mid Cap Equity |
11 | % | 10 | % | 12 | % | 10 | % | ||||||||
| Small Cap Equity |
5 | % | 4 | % | 8 | % | 4 | % | ||||||||
| International Equity |
13 | % | 12 | % | 7 | % | 12 | % | ||||||||
| Hedge Fund |
12 | % | 15 | % | 6 | % | 15 | % | ||||||||
| Real Estate Fund |
4 | % | 5 | % | 5 | % | 5 | % | ||||||||
| Cash and Other |
6 | % | 0 | % | 3 | % | 0 | % | ||||||||
62
Table of Contents
IMPERIAL SUGAR COMPANY AND SUBSIDIARIES
NOTES TO CONSOLIDATED FINANCIAL STATEMENTS—(Continued)
September 30, 2010, 2009 and 2008
Plan assets at September 30, 2010 are summarized in the following table at the appropriate level of the fair value hierarchy (in thousands of dollars):
| Asset Category |
Fair Value Measurements at September 30, 2010 | |||||||||||||||
| Total | Level 1 | Level 2 | Level 3 | |||||||||||||
| Intermediate Fixed Income |
$ | 40,567 | $ | 5,282 | $ | 35,285 | $ | — | ||||||||
| Large Cap Equity |
23,876 | 23,876 | — | — | ||||||||||||
| Mid Cap Equity |
13,657 | 13,657 | — | — | ||||||||||||
| Small Cap Equity |
6,687 | 6,687 | — | — | ||||||||||||
| International Equity |
16,688 | 16,688 | — | — | ||||||||||||
| Hedge Fund |
15,444 | — | — | 15,444 | ||||||||||||
| Real Estate Fund |
5,834 | — | — | 5,834 | ||||||||||||
| Cash and Other |
7,319 | 2,914 | 4,405 | — | ||||||||||||
| Total |
$ | 130,072 | $ | 69,104 | $ | 39,690 | $ | 21,278 | ||||||||
Fair value hierarchy levels are as follows:
| • | Level 1—Unadjusted quoted prices in active markets that are accessible at the measurement date for identical, unrestricted assets or liabilities; |
| • | Level 2—Quoted prices in markets that are not considered to be active or financial instruments for which all significant inputs are observable, either directly or indirectly; |
| • | Level 3—Prices or valuations that require inputs that are both significant to the fair value measurement and unobservable. These inputs may be used with internally developed methodologies that are used to generate management’s best estimate of fair value. |
Changes in Level 3 assets from October 1, 2009 to September 30, 2010 are as follows:
| Hedge Fund | Real Estate Fund | Total | ||||||||||
| Beginning balance at September 30, 2009 |
$ | 7,477 | $ | 5,851 | $ | 13,328 | ||||||
| Purchases |
7,500 | — | 7,500 | |||||||||
| Sales |
— | (463 | ) | (463 | ) | |||||||
| Realized and Unrealized Gain (Loss) |
467 | 446 | 913 | |||||||||
| Ending balance at September 30, 2010 |
$ | 15,444 | $ | 5,834 | $ | 21,278 | ||||||
The following benefit payments, which reflect expected future service, as appropriate, are expected to be paid (in thousands):
| Fiscal Year Ending September 30, |
Pension Benefits |
Post Retirement Benefits Other Than Pensions |
||||||
| 2011 |
15,026 | 784 | ||||||
| 2012 |
15,243 | 772 | ||||||
| 2013 |
15,499 | 760 | ||||||
| 2014 |
15,753 | 747 | ||||||
| 2015 |
15,875 | 736 | ||||||
| 2016-2020 |
79,910 | 3,332 | ||||||
The assumed rate of return is based on the results of historical statistical return studies.
63
Table of Contents
IMPERIAL SUGAR COMPANY AND SUBSIDIARIES
NOTES TO CONSOLIDATED FINANCIAL STATEMENTS—(Continued)
September 30, 2010, 2009 and 2008
401(k) Plans
Substantially all of the employees may elect to defer a portion of their annual compensation in the Company-sponsored 401(k) tax deferred savings plans. The Company makes matching contributions in some of these plans. The amount charged to expense for these plans was $1.5 million, $1.4 million and $1.3 million for the years ended September 30, 2010, 2009 and 2008, respectively.
Deferred Compensation
The Company has non-current liabilities for an inactive deferred compensation plan aggregating $7.8 million and $8.1 million at September 30, 2010 and 2009, respectively. Interest expense includes $0.6 million in each of fiscal 2010, 2009 and 2008, for such plan.
11. STOCK-BASED COMPENSATION
The Company has a long-term incentive plan which provides for the granting of incentive awards in the form of stock options, restricted stock, stock appreciation rights (SARs), cash award performance units and performance shares at the discretion of the Executive Compensation Committee of the Board of Directors. The plan authorizes the granting of up to 2,534,568 shares of common stock. As of September 30, 2010, shares available for future grants totaled 175,619.
Stock Options
Stock options granted to date have an exercise price equal to the fair market value of the shares of the Company’s common stock at the date of grant. Options became exercisable in annual increments over a three-year period from grant date and expire ten years from date of grant.
In fiscal 2008, the Company recorded compensation expense of $0.1 million for stock options based on the methods and assumptions noted below.
For the purpose of estimating the fair value of options on their date of grant, the Company began using a binomial lattice option pricing model in fiscal 2005 and used a Black-Scholes option-pricing model previously. The following assumptions were used in those models:
| Expected Stock Price Volatility |
3.0-35 | % | ||
| Risk-free Interest Rate |
2.5-4.2 | % | ||
| Expected Life of Options |
5.0 | |||
| Dividend Yield |
0-0.7 | % |
64
Table of Contents
IMPERIAL SUGAR COMPANY AND SUBSIDIARIES
NOTES TO CONSOLIDATED FINANCIAL STATEMENTS—(Continued)
September 30, 2010, 2009 and 2008
A summary of stock option activity in the plan is as follows:
| Options | Weighted- Average Exercise Price |
Weighted- Average Remaining Contractual Term |
Aggregate Intrinsic Value |
|||||||||||||
| (Per share) | (In years) | (In thousands) | ||||||||||||||
| Outstanding at September 30, 2008 |
111,039 | $ | 5.29 | |||||||||||||
| Exercised |
(11,667 | ) | 6.78 | |||||||||||||
| Forfeited |
(11,668 | ) | 6.78 | |||||||||||||
| Outstanding at September 30, 2009 |
87,704 | 4.90 | ||||||||||||||
| Forfeited |
(834 | ) | 6.78 | |||||||||||||
| Outstanding at September 30, 2010 |
86,870 | $ | 4.88 | 2.9 | $ | 761 | ||||||||||
| Vested at September 30, 2010 |
86,870 | $ | 4.88 | 2.9 | $ | 761 | ||||||||||
| Expected to vest in the future |
— | $ | — | — | $ | — | ||||||||||
No options were granted after fiscal 2006, however adjustments were made to certain outstanding grants in accordance with their terms for a special dividend paid in fiscal 2008. The total intrinsic value of options exercised was $0.1 million in fiscal 2009.
During fiscal 2009, cash received from the exercise of stock options was $0.1 million. As of September 30, 2010, there was no remaining unrecognized compensation expense related to nonvested stock options.
Restricted Stock and Restricted Stock Units
Restricted stock grants consist of the Company’s common stock and generally vest over a three or four-year period from the date of grant. Restricted stock awards are valued at the average market price of the Company’s stock at the date of grant, and the Company records the compensation expense over the vesting term. Restricted Stock Units (RSUs) granted in fiscal 2009 and 2010 had no requisite service period and were immediately expensed.
In fiscal 2010, the Company issued 133,446 shares in a restricted stock grant, 70% of which, or 93,412 shares, are subject to vesting terms that are performance-based. The performance-based portion of the grant cliff vests, to the extent the performance objectives have been achieved, at the end of a 34 month period ending September 30, 2012. The remaining 30%, or 40,034 shares, vest over time during the same 34 month period. In fiscal 2009, the Company issued 246,771 shares in a performance-based restricted stock grant. Based on the measurement of results against the performance objectives at September 30, 2009, 172,923 of these shares were returned to the Company as unearned. The remaining shares from this grant vest over a 30 month period.
The Company recorded compensation expense of $2.0 million, $2.5 million and $2.2 million in fiscal 2010, 2009 and 2008, respectively, related to restricted stock grants.
65
Table of Contents
IMPERIAL SUGAR COMPANY AND SUBSIDIARIES
NOTES TO CONSOLIDATED FINANCIAL STATEMENTS—(Continued)
September 30, 2010, 2009 and 2008
A summary of restricted stock and restricted stock unit activity in the plan is as follows:
| Number of Shares/Units |
Weighted- Average Grant Date Fair Value |
|||||||
| (Per share) | ||||||||
| Restricted Stock at September 30, 2008 |
324,695 | $ | 20.97 | |||||
| Granted |
314,805 | 8.14 | ||||||
| Vested |
(91,004 | ) | 17.51 | |||||
| Unearned |
(172,923 | ) | 7.51 | |||||
| Forfeited |
(32,730 | ) | 15.10 | |||||
| Restricted Stock at September 30, 2009 |
342,843 | 17.11 | ||||||
| Granted |
162,517 | 14.34 | ||||||
| Vested |
(84,040 | ) | 17.00 | |||||
| Forfeited |
(28,487 | ) | 14.25 | |||||
| Restricted Stock at September 30, 2010 |
392,833 | $ | 16.19 | |||||
The total fair value of shares vested during fiscal 2010 and 2009 was $1.1 million in each year. As of September 30, 2010, there was approximately $1.6 million of total unrecognized compensation expense related to nonvested restricted stock which is expected to be recognized over a weighted-average period of 1.6 years.
66
Table of Contents
IMPERIAL SUGAR COMPANY AND SUBSIDIARIES
NOTES TO CONSOLIDATED FINANCIAL STATEMENTS—(Continued)
September 30, 2010, 2009 and 2008
12. EARNINGS PER SHARE
The following table presents information necessary to calculate basic and diluted earnings per share (in thousands of dollars, except share and per share amounts):
| Year Ended September 30, | ||||||||||||
| 2010 | 2009 | 2008 | ||||||||||
| Income (Loss) from Continuing Operations |
$ | 136,860 | $ | (23,827 | ) | $ | (21,181 | ) | ||||
| Average Shares Outstanding |
11,805,587 | 11,721,357 | 11,657,622 | |||||||||
| Effect of Incremental Shares Issuable from Assumed Exercise of Stock Options, Warrants and Nonvested Restricted Stock Under the Treasury Stock Method(1) |
276,413 | — | — | |||||||||
| Adjusted Average Shares |
12,082,000 | 11,721,357 | 11,657,622 | |||||||||
| Diluted EPS—Continuing Operations |
$ | 11.33 | $ | (2.03 | ) | $ | (1.81 | ) | ||||
| Income (Loss) from Discontinued Operations |
$ | — | $ | 644 | $ | 260 | ||||||
| Average Shares Outstanding |
11,805,587 | 11,721,357 | 11,657,622 | |||||||||
| Effect of Incremental Shares Issuable from Assumed Exercise of Stock Options, Warrants and Nonvested Restricted Stock Under the Treasury Stock Method(1) |
276,413 | — | — | |||||||||
| Adjusted Average Shares |
12,082,000 | 11,721,357 | 11,657,622 | |||||||||
| Diluted EPS—Discontinued Operations |
$ | 0.00 | $ | 0.05 | $ | 0.02 | ||||||
| Net Income (Loss) |
$ | 136,860 | $ | (23,183 | ) | $ | (20,921 | ) | ||||
| Average Shares Outstanding |
11,805,587 | 11,721,357 | 11,657,622 | |||||||||
| Effect of Incremental Shares Issuable from Assumed Exercise of Stock Options, Warrants and Nonvested Restricted Stock Under the Treasury Stock Method(1) |
276,413 | — | — | |||||||||
| Adjusted Average Shares |
12,082,000 | 11,721,357 | 11,657,622 | |||||||||
| Diluted EPS—Net Income (Loss) |
$ | 11.33 | $ | (1.98 | ) | $ | (1.79 | ) | ||||
| (1) | The computation of diluted EPS for the year ended September 30, 2010 includes 44,037 options and 232,376 restricted stock shares and excludes 4,735 antidilutive restricted stock shares. No assumed option exercises or restricted stock share issuances were included in the computation of diluted EPS for the years ended September 30, 2009 and 2008, because doing so would have an antidilutive effect on the computation of diluted earnings per share. The computations exclude 430,547 and 435,734 antidilutive aggregate of unexercised stock options and nonvested restricted stock for the years ended September 30, 2009 and 2008. |
67
Table of Contents
IMPERIAL SUGAR COMPANY AND SUBSIDIARIES
NOTES TO CONSOLIDATED FINANCIAL STATEMENTS—(Continued)
September 30, 2010, 2009 and 2008
13. OTHER INCOME
Other income included the following (in thousands of dollars):
| Year ended September 30, | ||||||||||||
| 2010 | 2009 | 2008 | ||||||||||
| Equity Earnings in investment in: |
||||||||||||
| Comercializadora Santos Imperial S. de R.L. de C.V. |
$ | 1,609 | $ | 1,775 | $ | 665 | ||||||
| Wholesome Sweeteners, Inc. |
2,895 | 706 | 1,089 | |||||||||
| Other |
(69 | ) | — | — | ||||||||
| Distributions from cost basis fuel terminal partnership |
— | 147 | 11,422 | |||||||||
| Gain on securities |
— | 388 | 51 | |||||||||
| Settlement of natural gas pricing litigation |
857 | 107 | — | |||||||||
| Other |
250 | (75 | ) | 128 | ||||||||
| Total |
$ | 5,542 | $ | 3,048 | $ | 13,355 | ||||||
The Company owns a 50 percent interest in Comercializadora Santos Imperial S. de R.L. de C.V. and a 50 percent interest in Wholesome Sweeteners, Inc. (increased from 45 percent in July 2008). The Company reports its share of earnings in these investees on the equity method. Summarized financial information for the Company’s equity method investees is as follows (in thousands of dollars):
| Twelve Months Ended September 30, | ||||||||||||||||||||||||
| Comercializadora
Santos Imperial S. de R.L. de C.V. |
Wholesome Sweeteners, Inc. | |||||||||||||||||||||||
| 2010 | 2009 | 2008 | 2010 | 2009 | 2008 | |||||||||||||||||||
| Net Sales |
$ | 259,464 | $ | 221,189 | $ | 132,077 | $ | 99,792 | $ | 70,445 | $ | 60,090 | ||||||||||||
| Operating Income |
$ | 5,199 | $ | 5,020 | $ | 1,848 | $ | 11,859 | $ | 5,326 | $ | 5,768 | ||||||||||||
| Net Income |
$ | 3,219 | $ | 4,248 | $ | 1,330 | $ | 6,917 | $ | 2,572 | $ | 2,794 | ||||||||||||
68
Table of Contents
IMPERIAL SUGAR COMPANY AND SUBSIDIARIES
NOTES TO CONSOLIDATED FINANCIAL STATEMENTS—(Continued)
September 30, 2010, 2009 and 2008
14. FAIR VALUE OF FINANCIAL INSTRUMENTS
The Company determines the fair value of natural gas and raw sugar futures contracts and marketable securities using quoted market prices for the individual securities. The following table presents the Company’s assets and liabilities measured and recognized at fair value on a recurring basis classified at the appropriate level of the fair value hierarchy as of September 30, 2010 and September 30, 2009 (in thousands of dollars):
| September 30, 2010 | ||||||||||||||||||||
| Fair Value | Margin Requirements Settled in Cash |
Balance Sheet Total |
||||||||||||||||||
| Level 1 | Level 2 | Level 3 | ||||||||||||||||||
| Current Assets: |
||||||||||||||||||||
| No. 16 Domestic Sugar Futures Contracts |
$ | 22,027 | — | — | $ | (22,027 | ) | — | ||||||||||||
| No. 11 World Sugar Futures Contracts |
333 | — | — | (333 | ) | |||||||||||||||
| Marketable Securities |
198 | — | — | — | $ | 198 | ||||||||||||||
| Current Liabilities: |
||||||||||||||||||||
| No. 11 World Sugar Futures Contracts |
194 | — | — | (194 | ) | — | ||||||||||||||
| Natural Gas |
333 | — | — | (333 | ) | — | ||||||||||||||
| Non-Current Assets: |
||||||||||||||||||||
| No. 16 Domestic Sugar Futures Contracts |
25 | — | — | (25 | ) | — | ||||||||||||||
| Non-Current Liabilities: |
||||||||||||||||||||
| No. 16 Domestic Sugar Futures Contracts |
276 | — | — | (276 | ) | — | ||||||||||||||
| September 30, 2009 | ||||||||||||||||||||
| Fair Value | Margin Requirements Settled in Cash |
Balance Sheet Total |
||||||||||||||||||
| Level 1 | Level 2 | Level 3 | ||||||||||||||||||
| Current Assets: |
||||||||||||||||||||
| No. 16 Domestic Sugar Futures Contracts |
$ | 17,651 | — | — | $ | (17,651 | ) | — | ||||||||||||
| No. 11 World Sugar Futures Contracts |
3,425 | — | — | (3,425 | ) | — | ||||||||||||||
| Natural Gas |
1 | — | — | (1 | ) | — | ||||||||||||||
| Marketable Securities |
56 | — | — | — | $ | 56 | ||||||||||||||
| Current Liabilities: |
||||||||||||||||||||
| Natural Gas |
126 | — | — | (126 | ) | — | ||||||||||||||
| Non-Current Assets: |
||||||||||||||||||||
| No. 16 Domestic Sugar Futures Contracts |
468 | — | — | (468 | ) | — | ||||||||||||||
| Non-Current Liabilities: |
||||||||||||||||||||
| Natural Gas |
13 | — | — | (13 | ) | — | ||||||||||||||
15. DERIVATIVE INSTRUMENTS
We use raw sugar futures and options in our raw sugar purchasing programs and natural gas futures and options to hedge natural gas purchases used in our manufacturing operations. Additionally, we periodically use derivatives to manage interest rate and foreign currency exchange risk. Our objective in the use of derivative instruments is to mitigate commodity price, interest rate or foreign currency exchange risk. Our derivatives hedging activity is supervised by a senior risk management committee which monitors and reports compliance with our risk management policy to the Audit Committee of the Board of Directors.
69
Table of Contents
IMPERIAL SUGAR COMPANY AND SUBSIDIARIES
NOTES TO CONSOLIDATED FINANCIAL STATEMENTS—(Continued)
September 30, 2010, 2009 and 2008
The majority of our industrial channel sales and a portion of our distributor channel sales are made under fixed price, forward sales contracts. In order to mitigate price risk in raw and refined sugar commitments, we manage the volume of refined sugar sales contracted for future delivery in relation to the volume of raw cane sugar purchased for future delivery by entering into forward purchase contracts to buy raw cane sugar at fixed prices and by using raw sugar futures contracts. Historically, substantially all of our purchases of domestic raw sugar and quota raw sugar imports are priced based on the Intercontinental Exchange (ICE) Sugar No. 16 futures contract. We use these futures contracts to price our physical domestic and quota raw sugar purchase commitments. Certain of these derivative instruments qualify as cash flow hedges and are designated as hedges for accounting purposes. To the extent that derivative instruments do not qualify for hedge accounting treatment, the Company records the effect of those instruments in current earnings. Non-quota imports under the re-export program, which constitutes less than 10% of our raw sugar purchases, are priced based on the ICE Sugar No. 11 futures contract. We use these futures contracts to price our world raw purchase commitments, however, these derivative instruments are not designated as cash flow hedges. Additionally we receive short raw sugar futures contracts from certain raw sugar suppliers that are used as pricing mechanisms which are not designated as hedges. We have purchased domestic and world raw sugar futures contracts up to 22 months in advance of the physical purchase.
The pricing of our physical natural gas purchases generally is indexed to a spot market index and we use natural gas futures contracts traded on the New York Mercantile Exchange to hedge the cost of natural gas purchased under these physical contracts. These derivative instruments qualify as cash flow hedges and are designated as hedges for accounting purposes. Additionally, we utilize natural gas futures which are not designated as cash flow hedges to manage the remaining commodity price risk above the volume of derivatives designated as cash flow hedges. We have purchased natural gas futures contracts up to 12 months in advance of the physical purchase of natural gas.
For derivative instruments that qualify as a cash flow hedge, the effective portion of the gain or loss of the derivative is reported as a component of other comprehensive income and reclassified to earnings in the same period or periods during which the hedged transaction affects earnings. Gains and losses that result from the discontinuance of cash flow hedges because it is probable that the original forecasted transaction will not occur are recognized in current earnings. Gains and losses on derivatives representing hedge ineffectiveness are recognized in current earnings. Gains and losses on derivatives not designated as hedges are recognized in current earnings.
At September 30, 2010 we had the following net futures positions:
| Hedge Designation |
Domestic Sugar (cwt) |
World Sugar (cwt) |
Natural Gas (mmbtu) |
|||||||||
| Cash Flow |
— | — | 220,000 | |||||||||
| Not Designated |
3,645,600 | 647,360 | 270,000 | |||||||||
All of our futures contracts are settled in cash daily with the respective futures exchanges and therefore do not contain credit-risk-related contingent features. The Company has $12.2 million recorded on the balance sheet for cash held on deposit in margin accounts at September 30, 2010 for the futures positions above. At September 30, 2010 there were no derivative positions to mitigate the risk of interest rates or foreign currency exchange. For the twelve month period ended September 30, 2010, we did not engage in trading activity with derivatives.
70
Table of Contents
IMPERIAL SUGAR COMPANY AND SUBSIDIARIES
NOTES TO CONSOLIDATED FINANCIAL STATEMENTS—(Continued)
September 30, 2010, 2009 and 2008
The table below shows the location and amounts in the consolidated balance sheets for derivative instruments (in thousands):
As of September 30, 2010:
| Hedge Designation | Fair Value |
Margin Requirements Settled in Cash |
Balance Sheet Total |
|||||||||||||
| Current Assets: |
||||||||||||||||
| No. 16 Domestic Sugar Futures Contracts |
Not Designated | $ | 22,027 | $ | (22,027 | ) | — | |||||||||
| No. 11 World Sugar Futures Contracts |
Not Designated | 333 | (333 | ) | — | |||||||||||
| Current Liabilities: |
||||||||||||||||
| No. 11 World Sugar Futures Contracts |
Not Designated | 194 | (194 | ) | — | |||||||||||
| Natural Gas |
Cash Flow | 260 | (260 | ) | — | |||||||||||
| Natural Gas |
Not Designated | 73 | (73 | ) | — | |||||||||||
| Non-Current Assets: |
||||||||||||||||
| No. 16 Domestic Sugar Futures Contracts |
Not Designated | 25 | (25 | ) | — | |||||||||||
| Non-Current Liabilities: |
||||||||||||||||
| No. 16 Domestic Sugar Futures Contracts |
Not Designated | 276 | (276 | ) | — | |||||||||||
As of September 30, 2009:
| Hedge Designation | Fair Value |
Margin Requirements Settled in Cash |
Balance Sheet Total |
|||||||||||||
| Current Assets: |
||||||||||||||||
| No. 16 Domestic Sugar Futures Contracts |
Not Designated | $ | 17,651 | $ | (17,651 | ) | — | |||||||||
| No. 11 World Sugar Futures Contracts |
Not Designated | 3,425 | (3,425 | ) | — | |||||||||||
| Natural Gas |
Cash Flow | 1 | (1 | ) | — | |||||||||||
| Current Liabilities: |
||||||||||||||||
| Natural Gas |
Cash Flow | 95 | (95 | ) | — | |||||||||||
| Natural Gas |
Not Designated | 31 | (31 | ) | — | |||||||||||
| Non-Current Assets: |
||||||||||||||||
| No. 16 Domestic Sugar Futures Contracts |
Not Designated | 468 | (468 | ) | — | |||||||||||
| Non-Current Liabilities: |
||||||||||||||||
| Natural Gas |
Cash Flow | 13 | (13 | ) | — | |||||||||||
The impact of futures contracts on the consolidated income statement for the twelve months ended September 30, 2010 and 2009 is presented below:
| Hedge Designation |
Income Statement Line Item |
Twelve Months
Ended September 30, 2010 |
Twelve Months
Ended September 30, 2009 |
|||||||||||||||||||||||
| Domestic Sugar |
World Sugar |
Natural Gas |
Domestic Sugar |
World Sugar |
Natural Gas |
|||||||||||||||||||||
| Cash Flow |
Cost of Sales(1) | $ | (225 | ) | $ | — | $ | 1,731 | $ | (110 | ) | $ | — | $ | 7,558 | |||||||||||
| Cash Flow |
Accumulated other comprehensive loss |
— | — | 1,922 | 795 | — | 4,312 | |||||||||||||||||||
| Not Designated |
Cost of Sales (credit) | (49,615 | ) | 5,260 | 364 | (26,878 | ) | (4,317 | ) | 401 | ||||||||||||||||
| (1) | Amounts were reclassified from accumulated other comprehensive income. |
71
Table of Contents
IMPERIAL SUGAR COMPANY AND SUBSIDIARIES
NOTES TO CONSOLIDATED FINANCIAL STATEMENTS—(Continued)
September 30, 2010, 2009 and 2008
There were no gains or losses recognized on cash flow hedges for ineffectiveness, nor were there any portion of derivatives excluded from the effectiveness assessment. Approximately $0.5 million of losses on cash flow hedges for natural gas is expected to be reclassified to earnings over the next twelve months.
16. COMPONENTS OF ACCUMULATED OTHER COMPREHENSIVE INCOME (LOSS)
Changes in Accumulated Other Comprehensive Income (Loss) for the twelve months ended September 30, 2010 are as follows (in thousands of dollars):
| Net Unrealized Gains (Losses) on Derivatives |
Net Unrealized Gains (Losses) on Pension and Other Post Retirement Medical Benefits |
Foreign Currency Translation Adjustments and Other |
Total | |||||||||||||
| Balance September 30, 2009 |
$ | 25 | $ | (69,820 | ) | $ | (114 | ) | $ | (69,909 | ) | |||||
| Change in Derivative Fair Value (Net of Tax of $688) |
(1,233 | ) | (1,233 | ) | ||||||||||||
| Reclassification from Accumulated Other Comprehensive Income (Loss) to Net Income (Net of Tax of $540) |
967 | 967 | ||||||||||||||
| Foreign Currency Translation Adjustment (Net of Tax of $89) |
160 | 160 | ||||||||||||||
| Change in Pension and Other Postretirement Benefits Liability (Net of Tax of $2,933) |
(5,255 | ) | (5,255 | ) | ||||||||||||
| Balance September 30, 2010 |
$ | (241 | ) | $ | (75,075 | ) | $ | 46 | $ | (75,270 | ) | |||||
17. DISCONTINUED OPERATIONS
In fiscal 2009 and 2008 the Company settled indemnity claims in connection with businesses previously sold, and recorded the resultant income in discontinued operations.
18. RELATED PARTY AND OTHER INFORMATION
The Company recorded approximately $1.7 million, $34.0 million and $8.5 million of cost of sales in fiscal 2010, 2009 and 2008 respectively, and $1.8 million of finished goods inventory at September 30, 2010, resulting from purchases from our partner in the Mexican marketing joint venture.
Other current liabilities include payroll and employee benefit accruals totaling $7.3 million and $8.8 million at September 30, 2010 and 2009, respectively.
72