Attached files
| file | filename |
|---|---|
| EX-32 - HAUPPAUGE DIGITAL INC | v206632_ex32.htm |
| EX-23 - HAUPPAUGE DIGITAL INC | v206632_ex23.htm |
| EX-21 - HAUPPAUGE DIGITAL INC | v206632_ex21.htm |
| EX-31.2 - HAUPPAUGE DIGITAL INC | v206632_ex31-2.htm |
| EX-31.1 - HAUPPAUGE DIGITAL INC | v206632_ex31-1.htm |
UNITED
STATES
SECURITIES
AND EXCHANGE COMMISSION
WASHINGTON,
D.C. 20549
FORM
10-K
(Mark
One)
|
x
|
ANNUAL REPORT PURSUANT TO
SECTION 13 OR 15(d) OF THE SECURITIES EXCHANGE ACT OF
1934
|
For the
fiscal year
ended September 30,
2010
OR
|
¨
|
TRANSITION REPORT PURSUANT TO
SECTION 13 OR 15(d) OF THE SECURITIES EXCHANGE ACT OF
1934
|
For the
transition period from to
Commission
file number 1-13550
HAUPPAUGE DIGITAL
INC.
(Exact
name of registrant as specified in its charter)
|
Delaware
|
11-3227864
|
|
(State
or other jurisdiction of
|
(I.R.S
Employer
|
|
incorporation
or organization)
|
Identification
No.)
|
|
91 Cabot Court, Hauppauge, New
York
|
11788
|
|
(Address
of principal executive offices)
|
(Zip
Code)
|
Issuer's
telephone number, including area code (631)
434-1600
Securities
registered pursuant to Section 12 (b) of the Act:
|
Title of each class
|
Name of each exchange on which registered
|
|
Common
Stock, $.01 par value
|
The
NASDAQ Stock Market
|
Securities
registered pursuant to Section 12 (g) of the Act:
None
(Title of
class)
Indicate
by check mark if the registrant is a well-known seasoned issuer, as defined in
Rule 405 of the Securities Act.
¨
Yes x
No
Indicate
by check mark if the registrant is not required to file reports pursuant to
Section 13 or 15(d) of the Act.
¨
Yes x
No
Indicate
by check mark whether the registrant (1) has filed all reports required to be
filed by Section 13 or 15 (d) of the Securities Exchange Act of 1934 during the
preceding twelve (12) months (or for such shorter period that the registrant was
required to file such reports), and (2) has been subject to such filing
requirements for the past ninety (90) days.
x
Yes ¨
No
Indicate
by check mark whether the registrant has submitted electronically and posted on
its corporate Web site, if any, every Interactive Data File required to be
submitted and posted pursuant to Rule 405 of Regulation S-T (§232.405 of this
chapter) during the preceding 12 months (or for such shorter period that the
registrant was required to submit and post such files).
¨
Yes ¨
No
Indicate
by check mark if disclosure of delinquent filers pursuant to Item 405 of
Regulation S-K is not contained herein, and will not be contained, to the best
of registrant's knowledge, in definitive proxy or information statements
incorporated by reference in Part III of this Form 10-K or any amendment to this
Form 10-K. x
Indicate
by check mark whether the registrant is a large accelerated filer, an
accelerated filer, a non-accelerated filer or a smaller reporting
company. See the definitions of “large accelerated filer”, “accelerated filer”
and “smaller reporting company” in Rule 12b-2 of the Exchange
Act. (Check One):
|
¨ Large
Accelerated Filer
|
¨ Accelerated Filer
|
|
¨
Non-Accelerated Filer
|
x
Smaller reporting company
|
|
(Do
not check box if smaller reporting company)
|
Indicate
by check mark whether the registrant is a shell company (as defined in Rule12b-2
of the Act).
¨
Yes x No
The
aggregate market value of the voting stock held by non-affiliates of the
registrant as of the close of business on March 31, 2010 was approximately
$6,743,406 based upon the last price reported on such date on the NASDAQ Global
Market. Non-affiliates include all stockholders other than officers,
directors and 5% stockholders of the registrant.
As of
December 29, 2010, the number of shares of Common Stock, $0.01 par value,
outstanding was 10,081,889.
DOCUMENTS
INCORPORATED BY REFERENCE
None.
PART I
Special Note Regarding
Forward Looking Statements
This
Annual Report on Form 10-K contains forward-looking statements as that term is
defined in the federal securities laws. The events described in
forward-looking statements contained in this Annual Report on Form 10-K may not
occur. Generally these statements relate to business plans or
strategies, projected or anticipated benefits or other consequences of our plans
or strategies, financing plans, projected or anticipated benefits from
acquisitions that we may make, or projections involving anticipated revenues,
earnings or other aspects of our operating results or financial position, and
the outcome of any contingencies. Any such forward-looking statements
are based on current expectations, estimates and projections of
management. We intend for these forward-looking statements to be
covered by the safe-harbor provisions for forward-looking
statements. Words such as “may,” “will,” “expect,” “believe,”
“anticipate,” “project,” “plan,” “intend,” “estimate,” and “continue,” and their
opposites and similar expressions are intended to identify forward-looking
statements. We caution you that these statements are not guarantees
of future performance or events and are subject to a number of uncertainties,
risks and other influences (including, but not limited to, those set forth in
“Item 1A–Risk Factors”), many of which are beyond our control, that may
influence the accuracy of the statements and the projections upon which the
statements are based. Any one or more of these uncertainties, risks
and other influences could materially affect our results of operations and
whether forward-looking statements made by us ultimately prove to be
accurate. Our actual results, performance and achievements could
differ materially from those expressed or implied in these forward-looking
statements. We undertake no obligation to publicly update or revise
any forward-looking statements, whether from new information, future events or
otherwise. All cautionary statements made in this Annual Report on
Form 10-K should be read as being applicable to all related forward-looking
statements wherever they appear.
ITEM
1. BUSINESS
OVERVIEW
We are a
developer of analog and digital TV tuner and other products for the personal
computer market. Through our Hauppauge Computer Works, Inc., Hauppauge Digital
Europe Sarl and PCTV Systems Sarl subsidiaries, we design, develop, manufacture
and market analog, digital and other types of TV tuners and other devices that
allow PC users to watch television on a PC screen in a resizable window. Our
products also enable the recording of TV shows to a PC’s hard disk, receiving of
digital TV data transmissions, and the display of digital media stored on a
computer to a TV set via a home network. We were incorporated in
Delaware in August 1994 and are headquartered in Hauppauge, New York. We have
administrative offices in Luxembourg, Ireland and Singapore, sales
offices in Germany, London, Paris, The Netherlands, Sweden, Italy, Spain,
Singapore, Taiwan and California and research and development centers in
Hauppauge, New York, Braunschweig, Germany and Taipei,Taiwan.
OUR
STRATEGY
Since our
entry into the PC video market in 1991, management believes that we have become
a leader in bringing TV content to PCs by focusing on five primary strategic
fronts:
|
|
·
|
innovating
and diversifying our products
|
|
|
·
|
introducing
new and desirable features in our
products
|
|
|
·
|
expanding
our domestic and international sales and distribution
channels
|
|
|
·
|
forging
strategic relationships with key industry
players
|
|
|
·
|
outsourcing our
production to contract
manufacturers
|
As more
people are looking to PCs for a total entertainment experience, we
believe that our products are able to enhance the capabilities of the PC to
enable it to become a one-stop integrated entertainment system. We
feel our current products and products we may introduce in the future have the
potential to be ubiquitous in PC-based home entertainment
systems.
2
Our
engineering group works on updating our current products to add new and
innovative features that the marketplace seeks, while remaining vigilant in
keeping our manufacturing costs low and trying to ensure that our products are
compatible with new operating systems. This work is done in addition to our
research and development efforts in designing, planning and building new
products.
During
fiscal 2010 our engineering department introduced the WinTV Extend, a built-in
Internet video server for the WinTV v7.2 application. WinTV
Extend takes a live TV signal received through one of the Hauppauge
WinTV or PCTV tuner products and sends the live TV to your iPhone, iPad, iPod
touch, Mac or PC computer over either a home WiFi connection or over the
Internet. In addition, we introduced the MediaMVD-HD High Definition
digital media player and introduced new TV tuner products with the PCTV DV-T2
high definition digital TV receiver for the UK plus the PCTV 282e Flash Stick
and the PCTV DVBV-S2 460e stick.
During
fiscal 2009 our engineering department introduced software support for all of
our WinTV-HVR and WinTV-NOVA products for use with the Microsoft Windows 7
operating system. In addition, we introduced new TV tuner products with the
WinTV-Ministick, the WinTV-Aero Stick, the WinTV-HVR-930
Triple mode TV tuner stick, the PCTV Nano-stick 73e Ultimate, and the
PCTV Picostick.
All of
these products are designed to run under the Microsoft Windows 7 operating
system in addition to Microsoft Vista and
Microsoft Windows XP. The products for North America are
designed to support the NTSC analog cable TV standard plus over-the-air ATSC
high definition TV and clear QAM digital cable TV.
We
believe that strategic relationships with key suppliers, PC manufacturers,
technology providers, and internet and e-commerce solutions providers give us
important advantages in developing new technologies and marketing our
products. By jointly working with, and sharing our engineering expertise
with a variety of other companies, we seek to leverage our investment in
research and development and minimize time to market.
Our
domestic and international sales and marketing team cultivates a variety of
distribution channels comprised of computer and electronic retailers, computer
products distributors and PC manufacturers. Electronic retailers
include retail stores, web stores and third-party catalogs, both print and
on-line, among others. We work closely with our retailers to enhance sales
through joint advertising campaigns and promotions. We believe that developing
our international presence contributes to our strategic position, allowing us to
benefit from investments in product development, and more firmly establishing
our Hauppauge®, WinTV®, PCTV and MediaMVP™ brand names in the international
marketplace. We currently have ten sales offices in countries outside of the
U.S. and a sales and R&D facility in Taiwan to service the growing Asian
market.
We seek
to maintain and improve our profit margins by, among other things, outsourcing
our production to contract manufacturers suited to accommodate the type and
volume of our needs. We also leverage international supplier relationships to
assist us in receiving competitive prices for the component parts we buy. We
believe this two-tiered approach allows us to be the lowest cost / highest
quality producer in our marketplace. This approach enables us to focus our human
and financial resources on developing, marketing and distributing our
products. Successfully engineering products to have low
production costs and commonality of parts along with the use of single platforms
for multiple models are additional important ways that we believe our design and
build strategy contributes to our financial performance.
PRODUCTS
Our
products fall under three product categories:
|
|
·
|
Analog
TV tuners
|
|
|
·
|
Digital TV
tuners, and combination analog plus digital TV tuner
products
|
|
|
·
|
Non-TV
tuner products such as our digital media
players
|
3
See “Item
7- Management’s Discussion and Analysis of Financial Condition and Results of
Operations” and the Consolidated Financial Statements comprising part of this
Annual Report on Form 10-K for additional information relating to our operating
segments.
Analog TV
Tuners
Our
analog TV tuner products enable, among other things, a PC user to watch analog
cable TV in a resizable window on a PC. Although we continue selling
analog TV tuners in regions outside of the United States, we have stopped
developing analog only TV tuners, concentrating
our engineering resources on digital TV tuners and combination hybrid analog and
digital TV tuners, which is detailed in the section entitled “Digital TV
Tuners".
With the
global shift to digital TV broadcasts, the sales of our analog family products
have been declining and we expect this decline to continue during the transition
from analog to digital broadcasts.
Digital TV and Combination
Analog plus Digital TV Tuner Products
Our
digital TV tuner products enable, among other things, a PC user to watch digital
television in a resizable window on a PC or laptop screen. There are
different digital TV standards throughout the world, and we develop TV tuner
products for many of these digital TV formats. Examples of digital TV broadcasts
we can receive on our TV tuner products include: over-the-air high definition
ATSC, clear QAM and DVB-C digital cable, digital terrestrial DVB-T, digital
satellite DVB-S and DVB-S2. To support these digital TV formats, and as many of
our primary markets transition from analog to digital TV, we have
been concentrating our engineering resources on digital TV tuner products and
have discontinued development on analog only TV tuners.
We have a
line of external TV tuners called TV tuner “sticks”. TV tuner “sticks” are small
TV tuners which connect to a PC, notebook or netbook computer through the USB
port. TV tuner “sticks’ are typically used for mobile PC users and
others who want the flexibility to simply insert a USB TV tuner and watch TV on
their screen. The small size and UPC plug-in capability are good for use in
laptops while traveling.
Our
WinTV-NOVA products are digital only TV tuners for PCs. They support
the various forms of digital TV and come in either an internal or external form
factor.
Our WinTV-NOVA-T
is a DVB-T digital terrestrial tuner for
our European markets which allows for the viewing of
digital terrestrial TV and listening to digital radio on a PC. The product also
allows recording of digital TV and radio to a hard
drive. This product is available as either a PCI card or an external
USB device.
Our
WinTV-NOVA-T-500 is a dual tuner DVB-T tuner for our European markets which uses
“Diversity Technology” and allows for the viewing of digital terrestrial
programs while recording another program. The product also allows
recording of two digital TV programs simultaneously or watching one channel
while recording another.
Our
WinTV-NOVA-T-USB2 is an external high performance DVB-T digital TV tuner, with
dual tuners for recording of two digital TV programs simultaneously or watching
one channel while recording another.
Our
WinTV-NOVA-T TV tuner stick is a pocket sized external DVB-T tuner for our
European markets which allows for the viewing of digital
terrestrial TV and the listening of digital radio on a PC or laptop.
The product also allows recording of digital TV and
radio to a hard drive. The product’s pocket size and UPC plug-in
capability is good for use in laptops while traveling.
Our
WinTV-NOVA-TD stick, introduced during fiscal 2008, is a pocket-sized external
DVB-T tuner for our European markets, employs “Diversity Technology” with the
use of two antennas to maximize the reception for
the viewing of digital terrestrial TV on a PC or laptop. The product
also allows recording of digital TV to a hard drive in high quality MPEG-2
format. The product’s pocket size and UPC plug-in capability is good for use in
laptops while traveling.
Our
WinTV-Aero stick is a small but powerful external DVB-T tuner with a built-in
telescoping antenna for our European markets which
allows a user to watch and record DVB-T digital TV programs. It has a
compact design and was designed for mobile laptop computers and compact netbook
computers. The WinTV-Aero comes with a remote control and has a built-in
external connector which allows a user to connect it to a rooftop TV antenna
when the user is inside their home or office
building.
4
Our
WinTV-Ministick is a small and portable external DVB-T tuner for our
European markets which allows a user to watch and record
digital TV programs on a netbook, laptop or desktop computer. WinTV-Ministick
comes with a remote control and a portable digital TV antenna which allows a
user to watch TV at home or when they travel.
Our
WinTV-HVR products are combinations of both digital TV and analog TV tuners on
an internal TV tuner board or external USB TV tuner.
Our
WinTV-HVR-900 stick is a pocket sized external tuner for our European
markets which allows for the viewing of digital
terrestrial and analog terrestrial TV on a PC or
laptop. Digital and analog programs can be recorded to a hard drive
in high quality MPEG-2 format.
Our
WinTV-HVR-930C stick is a triple mode external tuner for our European markets
which allows for the viewing of digital cable TV and radio, digital terrestrial
TV and radio and analog cable or analog terrestrial TV on a PC or
laptop. This product allows the recording of digital and analog programs to a
hard drive in high quality MPEG-2 format and includes a DVB-T
antenna.
Our
WinTV-HVR-950Q stick is a pocket sized external tuner for our North American
markets which allows for the viewing of ATSC high
definition TV and NTSC cable TV on a PC or
laptop. The product also allows recording of digital and analog programs to a
hard drive in high quality MPEG-2 format.
Our
WinTV-HVR-1100 and WinTV-HVR-1300 are PCI based tuners for our European markets,
which are designed to be installed inside a desktop PC. These TV tuners allow
the viewing of digital terrestrial and analog terrestrial TV on a PC screen, in
addition to listening to FM radio and DVB-T radio through a PC’s audio system.
These products also allow the recording of digital and analog programs to a hard
drive in high quality MPEG-2 format. The WinTV-HVR-1300 is the higher
performance of the two models, in that it includes a hardware MPEG-2 encoder for
recording analog TV directly to a PC’s hard disk.
Our
WinTV-HVR-1400 and WinTV-HVR-1500, introduced during fiscal 2007, are dual tuner
ExpressCard/54 cards designed for notebook computers with ExpressCard/54mm
expansion slots. These TV tuners are for analog and digital TV
watching and recording on laptop computers, and allow the recording
of digital programs to a hard drive in high quality MPEG-2 format and
the recording of analog programs.
Our
WinTV-HVR-1600, introduced during fiscal 2007, is a PCI combination analog and
digital TV tuner for our North American market. The
WinTV-HVR-1600 is installed in an internal PCI slot in a desktop PC and allows
the watching and recording of ATSC high definition TV and
NTSC cable TV. The WinTV-HVR-1600 can record all ATSC formats,
including the 1080i format. The WinTV-HVR-1600 also supports viewing
and recording clear QAM digital cable TV channels and includes a
remote control and IR blaster which changes the channels on your
satellite or cable TV set top box.
Our
WinTV-HVR-1800, introduced during fiscal 2007, is a combination
analog and digital PCI Express TV tuner for our North
American market. The WinTV-HVR-1800 allows the watching and recording
of ATSC high definition TV, clear QAM digital cable TV
and NTSC analog cable TV on a PC.
Our
WinTV-HVR-3300 is a tri-mode PCI based TV tuner for our
European markets. The WinTV-HVR-3300 is installed in a desktop PC and allows
watching and recording of digital terrestrial (DVB-T), satellite (DVB-S) and
analog cable TV; in addition it has the ability to receive FM radio and DVB-T
radio. When recording digital TV programs, the original broadcast format is used
which preserves the quality of the recording.
Our
WinTV-HVR-4400 is a quad-format PCI based TV tuner for our European markets. It
is installed in a desktop PC and can be used to watch and
record digital terrestrial (DVB-T), digital satellite (DVB-S), high
definition digital satellite (DVB-S2) and analog cable TV; in addition, it has
the ability to receive FM radio and DVB-T radio. When recording digital TV
programs, the original digital broadcast format is used which preserves the
quality of the recording.
5
Our WinTV-NOVA-S is
a low cost DVB-S tuner for our European markets which allows for the
viewing of satellite based digital programming on a PC. The product
also allows for recording and playback of digital TV, using the high quality
MPEG-2 format, and for listening to digital radio.
Our HD
PVR is a High-Definition video
recorder for making real-time H.264 compressed video recordings at resolutions
up to 1080i. The HD PVR records component video from a game console such
as the Playstation 3 or cable TV and satellite set top boxes. With a built-in IR
blaster, the HD PVR can automatically change TV channels for scheduled
recordings. The HD PVR recording format can be used to burn Blu-ray DVD disks.
The HD PVRs recording quality allows personal archival
of high definition TV programs from any component video HD set top
box. The HD PVR also has standard definition composite and S-Video inputs
which allows you to record your old home video tapes into an AVCHD format for
creating Blu-ray DVD recordings.
Our
WinTV-HVR-1950 is a high performance external USB based TV tuner for
your PC or laptop. The WinTV-HVR-1950 allows you to watch,
pause and record analog cable TV, clear QAM digital cable TV, or ATSC
over-the-air digital TV at up to 1080i resolution. The
product comes with a remote control and IR blaster, and contains a
built-in hardware MPEG-2 encoder for use when recording analog
video.
Our
WinTV-HVR-2200 and WinTV-HVR-2250 products are dual tuner PCI Express based TV
tuners designed to be installed in a desktop PC. These PCI Express boards allow
a PC user to watch, pause or record two analog or digital TV programs at the
same time. A user can either watch one TV program
while recording another or can record two TV programs at once. With
the WinTV-HVR-2250, a user in North America can watch and record analog cable TV
or high definition digital ATSC and clear QAM digital cable TV. With
the WinTV-HVR-2200, a user in Europe or Asia can watch or record analog PAL TV
or digital DVB-T TV. Both of these products allow the recording of analog cable
TV programs to a PC's hard disk with our built-in high quality MPEG-2 hardware
encoder.
PCTV
products
Our PCTV
products allow Windows or Macintosh users to view television programming on
their computers. Our PCTV line consists of a family of USB
sticks with a small and convenient form factor well-suited for use
with laptops and PCI-based cards more appropriate for desktop users, in addition
to PCI cards for use in desktop computers. PCTV products are
positioned as our high end product offering. We believe that the
positioning of the PCTV product line will be complementary to our existing WinTV
line and will broaden our product offerings.
Other Non-TV Tuner
Products
|
(i)
|
MediaMVP™
|
Our
MediaMVP™ is a Linux-based digital media device, and is one of a new class of PC
products which link TV sets and PCs. Media, such as music, digital pictures, and
digital videos, are transmitted from the PC, where they are stored, to the
MediaMVP™, where they are converted from a digital format into an analog format,
enabling playback on a TV connected to the MediaMVP™. MediaMVP™ was introduced
to the market in fiscal 2003, and the first shipments to
customers were made at the start of our 2004 fiscal
year.
Our
MediaMVP™ enables a user to watch and listen to PC-based videos, music and
pictures on a TV set through a home network. The MediaMVP™ connects
to TV sets or home theater systems and, via an Ethernet network, plays back MP3
music, MPEG-1 and MPEG-2 videos, and JPEG and GIF digital pictures
that have been recorded and stored on a PC. The MediaMVP™ decodes this media and
then outputs video through composite and S-Video connections for
high quality video on TV sets and high quality audio through stereo
audio output connectors to TV sets or home theater systems.
Our
MediaMVP™ also provides an on-TV-screen display of media directory listings. It
receives commands from the supplied remote control, and sends these commands to
the PC server. The TV menus are created on the PC server, sent over the Ethernet
LAN and displayed by the MediaMVP™’s browser. The MediaMVP™’s remote
control allows a user to pause, fast forward and rewind through videos, plus
pause music and picture shows. A user can adjust the audio volume from the
MediaMVP™’s remote control, avoiding the need to use the
TV’s remote control. The MediaMVP™ is available
in a wired or wireless version.
6
|
(ii)
|
Video
Capture Products
|
Our
ImpactVCB Video Capture Board (“ImpactVCB”) is a low cost PCI board for high
performance access to digitized video. Designed for PC-based video
conferencing and video capture in industrial applications, the ImpactVCB
features “live” video-in-a-window, still image capture and drivers for Windows®
2000, Windows® XP, Windows® NT and Windows® 98. There are third party drivers
and applications for use with the Linux operating system.
Our USB
Live is an easy way to watch video, grab images and video conference on the PC
with the addition of a camera. It plugs into the PC’s USB port for
easy installation and brings video into users’ PCs from their camcorder or
VCR. Users can create video movies, save still and motion video
images onto their hard disk with our software, and video conference over the
internet with the addition of a camera or camcorder.
|
(iii)
|
Software
Recording Products
|
Our WinTV
Extend is a built-in Internet video server for the WinTV v7.2 application. WinTV
Extend is standard in the WinTV v7.2 application. WinTV Extend will take your
live TV signal and send it to your iPhone, iPad, iPod touch, Mac or PC computer
over either a home WiFi connection or over the Internet
Our
“Wing” software enables the user to record TV shows on a personal computer for
playback on the Sony Playstation Portable (PSP), Apple iPod and other portable
video players. Wing can also convert existing TV recordings to the PSP and iPod
formats. With the emergence and popularity of portable video players, our Wing
product provides an easy solution for recording live TV shows for
playback on these devices.
TECHNOLOGY
Analog TV
Technology
We have
developed four generations of products which convert analog video into digital
video since our first such product was introduced in 1991.
The first
generation of WinTV® products put the TV image on the PC screen using chroma
keying, requiring a dedicated “feature connector cable” between the WinTV® and
the VGA (video) board. Our initial customers were mostly professional PC users,
such as financial market professionals who needed to be able to view stock
market-related TV shows while spending many hours on their PCs, who found having
TV in a window on their desktop useful and entertaining.
In 1993,
we invented a technique called “smartlock”, which eliminated the need for the
“feature connector cable.” In 1994, we introduced the WinTV®-Celebrity
generation of TV tuner boards based on this smartlock technology, greatly
improving customer satisfaction. At the time, our CinemaPro series of WinTV®
boards then used smartlock and other techniques to further reduce cost and
improve performance.
In June
1996, we introduced the WinTV®-PCI line of TV tuner boards for PCs. These boards
were developed to eliminate the relatively expensive smartlock circuitry and
memory used on the WinTV®-Celebrity and CinemaPro products. The WinTV®-PCI used
a technique called “PCI Push” and was designed to be used in the then emerging
Intel® Pentium® market. These Pentium®-based PCs had a new type of system
expansion “bus”, called the PCI bus, which allowed data to be moved at a much
higher rate than the older ISA bus, which the previous WinTV® generations used.
The “PCI Push” technique moves the video image 30 times per second (in Europe
the image is moved 25 times per second) over the PCI bus. In addition
to being less expensive to manufacture, the WinTV®-PCI had higher digital video
movie capture performance than the previous generations, capturing video at up
to 30 quarter screen frames per second. With this higher performance
capture capability, the WinTV®-PCI found new uses in video conferencing, video
surveillance and internet streaming video applications.
7
The
fourth generation analog TV tuners are the WinTV®-PVR models which were first
developed during fiscal 2000 and introduced to the market in early fiscal 2001.
The WinTV®-PVRs include both internal PCI and external USB TV tuners which are
designed to add the ability to record TV shows to a PC’s hard disk. The core
technology in the WinTV®-PVR products is a hardware MPEG encoder, which
compresses analog video from a TV tuner or external video source into an MPEG
format in real time. MPEG is the compression format used on DVDs and for the
transmission of digital TV. This MPEG encoder is a purchased chip, to
which we add our driver and application software to create the recording and
program pause functions. Our WinTV®2000 application was enhanced to add the
functions needed to record, pause and play back TV on a PC screen.
Digital TV
Technology
Our
WinTV®-D board, developed during the 1999 fiscal year and delivered to the
market in the beginning of fiscal 2000, was the first ATSC digital TV tuner for
the North American market which allowed PCs to receive, display and record
over-the-air digital TV signals. ATSC digital television is the digital TV
standard for North America which has replaced analog television in the United
States and Canada. In the U.S., all analog over-the-air television
transmissions have ceased as of June 19, 2009 and only digital TV transmissions
will be broadcast. Since our first ATSC digital TV tuner delivered in
2000, we have introduced 8 new digital TV tuners for use in North
America.
In fiscal
1999, we also introduced the WinTV®-DVB board for the European market. This
board brings European digital TV to PCs, and is based on the Digital Video
Broadcast standard. Both the WinTV®-D and the WinTV®-DVB have the
ability to receive special data broadcasts which some broadcasters may send
along with the digital TV signal, in addition to displaying digital TV in a
resizable window. Data broadcasts on digital TV are transmitted at several
million bits per second. Our proprietary software can decode and display some of
these special data broadcasts. We may work on standardized reception
and display software, if such broadcasts become standardized.
The
software to control the digital TV reception is based on our WinTV®-2000
software, which was developed during fiscal 1999 and has had a major update in
2006 and 2008. Over the two fiscal years ended September 30, 2010, we
have further developed the digital TV reception capabilities of our digital
family of products and as of September 30, 2010 we have 18 products for DVB-T
terrestrial, DVB-S and DVB-S2 satellite, ATSC and clear QAM digital TV
reception. In addition, there are seven PCTV products which allow
digital TV to be watched on a PC or notebook computer.
Our
MediaMVP™ is a device which allows TV recordings which are stored on a PC or
notebook computer to be viewed on a TV set. Based on the Linux operating system,
the MediaMVP™ works in a client/server system with a PC, communicating with the
PC ‘server’ and receiving digital media from the PC and displaying the media on
the TV set. The core technology to the MediaMVP™ comprises the configuration and
enhancements to the Linux operating system, the user interface displayed on the
TV set, and the technology to transmit digital media reliably over the local
area network. The MediaMVP™ is available in a wired or wireless
version.
RESEARCH
AND DEVELOPMENT
Our
development efforts are focused on extending the range and features of our
existing products and developing additional internal and externally attached TV
tuner products. We intend to develop more highly integrated versions of hardware
products to further improve performance and price points, and new versions of
software to add features, improve ease of use, and provide support for new
operating systems.
As of
September 30, 2010, we had three research and development operations: one based
in our Hauppauge, New York headquarters, one based in Taipei, Taiwan, ROC and
one in Braunschweig, Germany. The New York and Taiwan R&D
operations are aimed at extending the range and features of our digital/analog
products, developing additional externally attached TV products, additional
high-definition digital TV products and portable digital players. The
Braunschweig, Germany PCTV research and engineering facility is responsible for
the updating and enhancement of the current PCTV line in addition to developing
new PCTV products.
The
technology underlying our products and certain other products in the computer
industry, in general, is subject to rapid change, including the potential
introduction of new types of products and technologies, which may have a
material adverse impact upon our business. See, “Item 1A — Risk
Factors”.
8
We
maintain an ongoing research and development program. Our future success, of
which there can be no assurances, will depend, in part, on our ability to
respond quickly to technological advances by developing and introducing new
products, successfully incorporating such advances in existing products, and
obtaining licenses, patents, or other proprietary technologies to be used in
connection with new or existing products. We continue to invest in research and
development. We spent approximately $4,459,000 and $4,422,000 for research and
development expenses for the years ended September 30, 2010 and 2009,
respectively. There can be no assurance that our current and future
research and development will be successful or that we will be able to foresee,
and respond to, advances in technological developments and to successfully
develop other products. Additionally, there can be no assurances that the
development of technologies and products by competitors will not render our
products or technologies non-competitive or obsolete. See “Item
1A- Risk Factors.”
PRODUCTION
AND SUPPLIERS
We design
the hardware for most models of the WinTV, PCTV and
MediaMVP products, and also write the operating software to be used
in conjunction with many versions of the Microsoft Windows operating system,
including Windows 7 and Windows Vista.
During
fiscal 2010, we sub-contracted the manufacturing and assembly of most of these
products to six independent third parties at facilities in various Asian
countries. We monitor and test the quality of the completed products at any one
of our facilities in the U.S. (Hauppauge, New York), Singapore or Ireland before
packaging the products and shipping them to our customers. We also buy some
models of TV tuner products, such as the WinTV Nova-t-Stick and
XFones from other unrelated third party companies, add Hauppauge software and
sell under our name or on a private label basis.
Most of
the PCTV products sold by Hauppauge in 2009 were manufactured and assembled by
Avid prior to the PCTV acquisition. They were provided to Hauppauge by Avid as
part of the PCTV Inventory and Product Return Agreement, which ended on June 24,
2010. Of the PCTV products not provided by Avid, we sub-contracted
the manufacturing and assembly to two independent third
parties. These two contract manufacturers, both located in Asia, were
previous used by Avid for the manufacturing of PCTV products.
Certain
component parts, such as TV tuners, video decoder chips and software compression
chips, plus certain assembled products, such as the WinTV-HVR stick
products that are essential to our business, are available
from a single source or limited sources. Other essential component
parts that are generally available from multiple sources may be obtained by us
from only a single source or limited sources because of pricing concerns. See
“Item 1A-Risk Factors.”
Components
are subject to industry-wide availability and pricing pressures. Any
availability limitations, interruption in supplies, or price increases could
have a material adverse effect on our business, operating results and financial
condition. In addition, our new products may initially utilize custom components
obtained from only one source. See “Item 1A-Risk Factors.” We typically attempt
to evaluate and qualify additional suppliers for these components.
Where a
product utilizes a new component, initial capacity constraints of the supplier
of that component may exist until such time as the supplier's yields have
matured.
Components
are normally acquired through purchase orders, either issued by us or by our
contract manufacturers, typically covering our requirements for a 60-120 day
period from the date of issue. Purchased assembled products are normally covered
by longer term purchase orders. Our principal suppliers of component parts
are Dibcom S.A., NXP Semiconductors and Conexant
Systems.
If the
supply of a key component, or a purchased assembled product, were to be delayed
or curtailed, or in the event a key manufacturing vendor delays shipment of
completed products to us or our contract manufacturer, our ability to ship
products in desired quantities, and in a timely manner, will be adversely
affected. Our business, operating results and financial condition
will likely be adversely affected, depending on the time required to obtain
sufficient quantities from the original source or, if possible, to identify and
obtain sufficient quantities from an alternative source. See “Item 1A-Risk
Factors.” We attempt to mitigate these potential risks by working closely with
our key suppliers on product introduction plans, strategic inventories,
coordinated product introductions, and internal and external manufacturing
schedules and levels.
9
We have,
from time to time, experienced significant price increases and limited
availability of certain components. Similar occurrences in the future could have
a material adverse effect on our business, operating results and financial
condition. See “Item 1A-Risk Factors.”
During
fiscal 2010 and 2009, all WinTV, PCTV and MediaMVP manufacturing was performed
by six unrelated contract manufacturers in Asia. Product design specifications
are provided by our engineering team to ensure proper assembly. Contract
manufacturing is primarily done on a consignment basis, in which we provide all
the significant component parts and we pay for assembly charges and for certain
additional parts for each board produced. Some products are purchased on a
turnkey basis, in which all components and labor are provided by the
manufacturer, and the manufacturing price includes parts and assembly costs. We
monitor the quality of the finished product produced by our contract
manufacturers. As of September 30, 2010, we had six qualified contract
manufacturers located in Malaysia, Indonesia, Taiwan and China, who are capable
of producing our products to our standards. If demand were to
increase dramatically, we believe additional production could be absorbed by
these qualified contract manufacturers. For fiscal 2010 and 2009 we did not
engage any contract manufacturers in Europe or North America.
CUSTOMER
SERVICE AND TECHNICAL SUPPORT
We
maintain customer service and technical support departments in our Hauppauge,
New York headquarters, as well as in the U.K., Germany, France, Italy,
Scandinavia, Taiwan and in Singapore. Technical support is provided to help with
installation problems or pre-sale and post-sale questions on our products, while
customer service provides repair service in accordance with our warranty policy
free of charge for product that is within the warranty period. During
fiscal 2009 customer support and technical support for PCTV products was
absorbed into the existing Hauppauge customer support and technical support
infrastructure.
CUSTOMERS
AND MARKETS
We
primarily market our products to the personal computer market, including both
Microsoft Windows and Apple Macintosh based systems. To reach this market, we
sell to a network of computer retailers in the U.S., Europe and Asia and through
computer products distributors and manufacturers. To attract new users to our
products, from time to time we run special promotions and participate in
cooperative advertising with computer retailers. We actively participate in
trade shows to educate and train key computer retail marketing personnel. Most
of our sales and marketing budget is aimed at the consumer market.
Apart
from the typical home user, we also target business users. One example of a
business application is in the securities brokerage industry where our product
is primarily used to display financial TV shows in a window on a broker’s PC
screen while the PC continues to receive financial information. We have sold our
WinTV® products on a direct corporate sales basis to two large
financial services information providers for incorporation into their
workstations, and several independent financial institutions. This market
segment is typically project-based.
We also
offer our products to PC manufacturers that either embed a WinTV® product in a
PC that they sell, or sell the WinTV® as an accessory to the PC.
Sales Channels for Our
Products
We
primarily sell through a sales channel which consist of retailers, PC
manufacturers and distributors. We have no exclusive distributors and retailers.
For fiscal 2010 no one customer accounted for more than 10% of our net
sales. For fiscal 2009, we had one customer, D&H Distributing,
that accounted for approximately 12% of our net sales.
Our PCTV
products are offered as our high end line and are sold through
similar retail and distribution channels as our WinTV products.
10
Marketing and
Sales
We market
our products both domestically and internationally through our sales offices in
the U.S. (New York and California), Germany, the United Kingdom, France, Taiwan
and Singapore, plus through independent sales representative offices in the
Netherlands, Spain, Scandinavia, Poland and Italy. For the fiscal 2010,
approximately 46% of our sales were made within the United States while
approximately 54% were made outside the United States. For fiscal 2009,
approximately 48% of our net sales were made within the United States while
approximately 52% were made outside the United States. More
information on our geographic segments can be obtained from “Item 7-Management’s
Discussion and Analysis of Financial Condition and Results of Operations,”
and the notes to the “Consolidated Financial Statements”
which comprise part of this Annual Report on Form 10-K.
From time
to time, we advertise our products in a number of consumer computer magazines.
We also participate in retailers’ market promotion programs, such as store
circulars and promotions and retail store displays. These in-store
promotional programs, magazine advertisements, plus a public relations program
aimed at editors of key PC computer magazines and an active website on the
internet, are the principal means of getting our product introduced to end
users. Our sales in computer retail stores are closely related to the
effectiveness of these programs, along with the technical capabilities of the
products. We also list our products in catalogs of various mail order companies
and attend trade shows.
For the
most part we intend to absorb the marketing and sales of our PCTV line into our
existing sales and marketing structure. Our existing sales
personnel handle the generating of sales orders and the PCTV
line follows marketing and advertising programs that are
similar to our WinTV programs.
We
currently have fifteen sales people located in Europe, two sales people in the
Far East and two sales people in the U.S., located in New York and California.
In addition to our sales people we also utilize the services of 7 manufacturer
representatives in the United States and 12 manufacturer representatives
in Europe.
See “Item
7-Management’s Discussion and Analysis of Financial Condition and Results of
Operations” with reference to a discussion on the impact seasonality has on our
sales.
FOREIGN
CURRENCY FLUCTUATIONS
For each
of the fiscal years ended September 30, 2010 and 2009, at least 40% of our sales
were generated by our European subsidiary and were invoiced and collected in
local currency, which is primarily the Euro. On the supply side, since
we predominantly deal with North American and Asian suppliers and
contract manufacturers, approximately 95% of the our
inventory required to support our European sales is purchased and
paid in U.S. Dollars.
The
combination of sales billed in Euros supported by inventory purchased in U.S.
Dollars results in an absence of a natural local currency hedge. Consequently,
our financial results are subject to market risks resulting from the
fluctuations in the Euro to U.S. Dollar exchange rates.
See “Item
1A-Risk Factors” and “Item 7-Management’s Discussion and Analysis of Financial
Condition and Results of Operations.”
COMPETITION
Our
business is subject to significant competition. Competition exists from larger
companies that possess substantially greater technical, financial, human, sales
and marketing resources than we do. The dynamics of competition in this market
involve short product life cycles, declining selling prices, evolving industry
standards and frequent new product introductions. We compete against
a number of Asian and European companies. Our MediaMVP™ product
competes in the consumer electronics market, where competition comes from Sony
Corporation., Toshiba Corporation, Cisco Systems, Inc. and
others.
11
We
believe that competition from new entrants into our market will increase as the
market for television in a PC expands. There can be no assurance that we will
not experience increased competition in the future. Such increased competition
may have a material adverse affect on our ability to successfully market our
products. Competition is expected to remain intense and, as a result, we may
lose some of our market share to our competitors. Further, we believe that the
market for our products will continue to be price competitive and thus we could
continue to experience lower selling prices, lower gross profit margins and
reduced profitability levels for such products than in the
past. “Item 1A-Risk Factors”.
Though
management believes that the delivery of TV via the internet will become more
popular in the future, we believe that TV delivered via cable, broadcast or
satellite will continue to dominate the way consumers watch live television.
Since our products connect directly to cable, broadcast and satellite tuners, we
view our products as the preferred way to watch and record TV on the
PC.
PATENTS,
COPYRIGHTS AND TRADEMARKS
With the
proliferation of new products and rapidly changing technology, there is a
significant volume of patents and other intellectual property rights held by
third parties with regard to our market. There are a number of companies that
hold patents for various aspects of the technologies incorporated in some of the
PC and TV industries' standards. Given the nature of our products and
development efforts, there are risks that claims associated with such patents or
intellectual property rights could be asserted by third parties against
us. We expect that parties seeking to gain competitive advantages
will increase their efforts to enforce any patent or intellectual property
rights that they may have. The holders of patents from which we may
have not obtained licenses may take the position that we are required to obtain
a license from them.
If a
patent holder refuses to offer such a license or offers such a license on terms
unacceptable to us, there is a risk of incurring substantial litigation or
settlement costs regardless of the merits of the allegations or which party
eventually prevails. If we do not prevail in a litigation suit, we may be
required to pay significant damages and/or cease sales and production of
infringing products and accordingly, may incur significant defense
costs. Additionally, we may need to attempt to design around a given
technology, although there can be no assurances that this would be possible or
economical.
We
currently use technology licensed from third parties in certain
products. Our business, financial condition and operating results
could be adversely affected by a number of factors relating to these third-party
technologies, including:
|
|
·
|
failure
by a licensor to accurately develop, timely introduce, promote or support
the technology
|
|
|
·
|
delays
in shipment of products
|
|
|
·
|
excess
customer support or product return costs due to problems with licensed
technology and
|
|
|
·
|
termination
of our relationship with such
licensors
|
We may
not be able to adequately protect our intellectual property through patent,
copyright, trademark and other means of protection. If we fail to
adequately protect our intellectual property, our intellectual property rights
may be misappropriated by others, invalidated or challenged, and our competitors
could duplicate our technology or may otherwise limit any competitive
technological advantage we may have. Due to the rapid pace of technological
change, we believe our success is likely to depend more upon continued
innovation, technical expertise, marketing skills and customer support and
service rather than upon legal protection of our proprietary rights. However, we
intend to aggressively assert our intellectual property rights when
necessary.
Even
though we independently develop most of our products and copyright the operating
software which our products use, our success will depend, in a large part, on
our ability to innovate, obtain or license patents, protect trade secrets and
operate without infringing on the proprietary rights of others. We maintain
copyrights on certain of our designs and software programs, but currently we
have no patent on the WinTV® board or other products.
The
trademarks “Hauppauge®”, “SoftPVR®”, “HardPVR®” , “MediaMVP®” and
"WinTV®" have been registered with the United States Patent and
Trademark Office.
12
See
“Item 1A-Risk Factors” and “Item 7-Management’s Discussion
and Analysis of Financial Condition and Results of Operations.”
EMPLOYEES
As of
September 30, 2010, we employed 167 people domestically and
internationally, including our executive officers, all of whom are employed on
a full-time basis, and none of whom are represented by a
union. Included in the 167 employees are 23 employees
located in Braunschweig, Germany, primarily consisting of engineers
and product support personnel, formerly employed by Avid Technology,
Inc., whom we hired to support our PCTV operations.
CORPORATE
STRUCTURE
Hauppauge
Digital Inc. was incorporated in the state of Delaware on August 2, 1994. Listed
below is a chart depicting our corporate
structure.
Corporate
Organization Chart
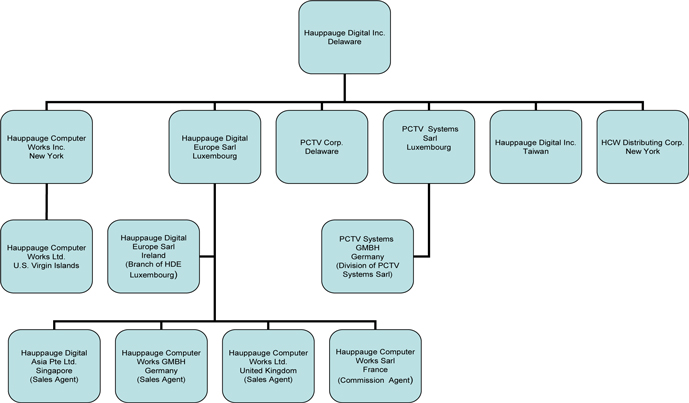
Hauppauge
Digital Inc. is the parent holding company. Our subsidiaries function
as follows:
Hauppauge
Computer Works, Inc., incorporated in New York, is our United States operating
company. It has locations in Hauppauge, New York and Danville, California. The
Hauppauge, New York location functions as our company headquarters and houses
the executive offices and is responsible for some or all of the following
functions:
|
|
·
|
Sales
|
|
|
·
|
Technical
Support
|
|
|
·
|
Research
and development
|
|
|
·
|
Warehousing
and shipping
|
|
|
·
|
Finance
and Administrative
|
13
|
|
·
|
Inventory
planning and forecasting
|
Hauppauge
Digital Europe Sarl (“HDE”), incorporated in Luxembourg, is our European
subsidiary. It has the
following
wholly-owned subsidiaries:
|
|
·
|
Hauppauge
Digital Asia Pte Ltd. (incorporated in
Singapore)
|
|
|
·
|
Hauppauge
Computer Works, GMBH (incorporated in
Germany)
|
|
|
·
|
Hauppauge
Computed Works Ltd. (incorporated in the United
Kingdom)
|
|
|
·
|
Hauppauge
Computer Works Sarl (incorporated in
France)
|
The
subsidiaries of HDE listed above function as sales and commission agents, and
are primarily responsible for some or all of the following
functions:
|
|
·
|
Directing
and overseeing European sales, marketing and promotional
efforts
|
|
|
·
|
Procuring
sales and servicing customers
|
|
|
·
|
Sales
administration
|
|
|
·
|
Technical
support
|
|
|
·
|
Product
and material
procurement support
|
|
|
·
|
Contract
manufacturer and production support
|
Hauppauge
Digital Europe Sarl also has a branch office in
Blanchardstown, Ireland, which functions as our European distribution center
and is responsible for some or all of our following
functions:
|
|
·
|
Warehousing
of product
|
|
|
·
|
Shipment
of product
|
|
|
·
|
Repair
center
|
|
|
·
|
European
logistics center
|
Hauppauge
Digital Inc. Taiwan was incorporated during fiscal 2004 in Taiwan, ROC and is
responsible for some or all of the following functions:
|
|
·
|
Sales
administration for Asia and China
|
|
|
·
|
Research
and development activities
|
PCTV
Systems Sarl (Luxembourg) is a wholly owned subsidiary of Hauppauge
Digital Inc. This subsidiary was created to be the holding
company of certain assets and properties acquired from Avid
Technology, Inc., Pinnacle Systems, Inc., Avid Technology
GmbH, Avid Development GmbH and Avid Technology International
BV. PCTV Systems GMBH is a division of PCTV Systems Sarl,
Luxembourg. Located in Germany, PCTV Systems GMBH is responsible for
PCTV research and development.
Hauppauge
Computer Works, Inc. is in turn the holding company of a foreign sales
corporation, Hauppauge Computer Works, Ltd, (incorporated in the U.S. Virgin
Islands).
HCW
Distributing Corp., incorporated in New York, is an inactive
company.
Our
executive offices are located at 91 Cabot Court, Hauppauge, New York 11788, and
our telephone number at that address is (631) 434-1600. Our internet
address is http://www.hauppauge.com.
ITEM 1A. RISK
FACTORS
Our
operating results and financial condition are subject to various risks and
uncertainties, including those described below, that could materially adversely
affect our business, operating results and financial condition, any of which
could negatively affect the trading price of our Common
Stock. Because of the following factors, as well as other variables
affecting our business, operating results and financial condition, past
performance may not be a reliable indicator of future performance, and
historical trends should not be used to anticipate results or trends for future
periods.
14
If TV technology for the PC, or our
implementation of this technology, is not accepted, we will not be able to
sustain or expand our business.
Our
future success depends on the growing use and acceptance of TV and video
applications for PCs. The market for these applications is still evolving, and
may not develop to the extent necessary to enable us to further expand our
business. We have invested, and continue to invest, significant time and
resources in the development of new products for this market.
Our:
|
|
·
|
dependence
on sales of TV and video products for the
PC
|
|
|
·
|
lack
of market diversification
|
|
|
·
|
concentration
on the North American and European market for the majority of our
sales
|
|
|
·
|
potential
inability to remain ahead of the development of competing
technologies
|
could
each have a material adverse effect on our business, operating results and
financial condition if we are unable to address any of the factors listed
above.
We
rely upon sales of a small number of product lines, and the failure of any one
product line to be successful in the market could substantially reduce our
sales.
We
currently rely upon sales from our existing product lines of internal and
external products to generate a majority of our sales. While we continue to
develop additional products within these and other product lines, there can be
no assurance that we will be successful in doing so. Consequently, if the
existing or future products are not successful, sales could decline
substantially, which would have a material adverse effect on our business,
operating results and financial condition.
We
rely heavily on the success of retailers, dealers and PC manufacturers to
market, sell and distribute our products. If these channels are not effective in
distributing our products, our sales could be reduced.
These
retailers, dealers and PC manufacturers may not effectively promote or market
our products or they may experience financial difficulties and even close
operations. Our sales channels are not contractually obligated to
sell our products, and they typically sell on an “as needed” basis. Therefore,
they may, at any time:
|
|
·
|
refuse
to promote our products
|
|
|
·
|
discontinue
the use of our products in favor of a competitor's
product
|
Also,
with a distribution channel standing between us and the actual end user, we may
not be able to accurately gauge current demand and anticipate future demand for
our products. For example, retailers, dealers and PC manufacturers
may place large initial orders for a new product just to keep their stores and
products stocked with the newest TV tuners and not because there is a
significant demand for them.
We
operate in a highly competitive market, and many of our competitors have much
greater resources, which may make it difficult for us to remain
competitive.
Our
business is subject to significant competition. Competition exists from larger
companies that possess substantially greater technical, financial, human, sales
and marketing resources than we do. The dynamics of competition in this market
involve short product life cycles, declining selling prices, evolving industry
standards and frequent new product introductions. We compete against
companies such as ATI Technologies Inc., a division of Advanced Micro Devices,
Inc., and a number of Asian and European companies. Our MediaMVP™ product
competes in the consumer electronics market, where competition comes from Sony
Corporation, Toshiba Corporation, Cisco Systems, Inc. and
others.
15
We
believe that competition from new entrants will increase as the market for
digital video in a PC expands. There can be no assurance that we will not
experience increased competition in the future. Such increased competition may
have a material adverse affect on our ability to successfully market our
products. Competition is expected to remain intense and, as a result, we may
lose some of our market share to our competitors. Further, we believe that the
market for our products will continue to be price competitive and thus we could
continue to experience lower selling prices, lower gross profit margins and
reduced profitability levels for such products than in the past.
Rapid
technological changes and short product life cycles in our industry and the
availability of new products, services and technologies could harm our
business.
The
technology underlying our products and other products in the computer industry,
in general, is subject to rapid change, including the potential introduction of
new types of products, services and technologies, which may have a material
adverse impact upon our business, operating results and financial
condition. The pervasive availability of new products, services
(including internet services) and technologies may have a material adverse
impact upon our business, operating results and financial
condition. We will need to maintain an ongoing research and
development program, and our potential future success, of which there can be no
assurances, will depend, in part, on our ability to respond quickly to
technological advances by developing and introducing new products, successfully
incorporating such advances in existing products, and obtaining licenses,
patents, or other proprietary technologies to be used in connection with new or
existing products. We expended approximately $4,459,000 and
$4,422,000 for research and development expenses for the fiscal years ended
September 30, 2010 and 2009, respectively. There can be no assurance that our
research and development will be successful or that we will be able to foresee
and respond to such advances in technological developments and to successfully
develop additional products. Additionally, there can be no assurances that the
development of technologies, services or products by competitors will not render
our products or technologies non-competitive or obsolete.
If TV or
video capabilities are included in PCs or in operating systems, it could result
in a reduction in the demand for add-on TV and video
devices. Although we believe that our software is a competitive
strength, as operating systems such as Windows move to integrate and standardize
software support for video capabilities, we will be challenged to further
differentiate our products. Our operating results and ability to
retain our market share are also dependent on continued growth in the underlying
markets for PC, TV and video products.
We
may not be able to timely adopt emerging industry standards, which may make our
products unacceptable to potential customers, delay our product introductions or
increase our costs.
Our
products must comply with a number of current industry standards and practices
established by various international bodies. Failure to comply with evolving
standards, including video compression standards, TV transmission standards, and
PC interface standards, will limit acceptance of our products by the market. If
new standards are adopted in the industry, we will be required to adopt those
standards in our products. It may take a significant amount of time to develop
and design products incorporating these new standards, and we may not succeed in
doing so. We may also become dependent upon products developed by third parties
and have to pay royalty fees, which may be substantial, to the developers of the
technology that constitutes the newly adopted standards.
We
are dependent upon foreign markets for sales of our products, primarily the
European market, and adverse changes in these markets could reduce our
sales.
Our
future performance will likely be dependent, in large part, on our ability to
continue to compete successfully in the European markets, where a large portion
of our current and potential customers are located. Our ability to compete in
these markets will depend on many factors, including:
|
|
·
|
the
economic conditions in these
regions
|
|
|
·
|
the
value of the euro versus the U.S.
dollar
|
|
|
·
|
the
stability of the political environment in these
regions
|
|
|
·
|
adverse
changes in the relationships between major countries in these
regions
|
|
|
·
|
the
state of trade relations among these regions and the United
States
|
|
|
·
|
restrictions
on trade in these regions
|
|
|
·
|
the
imposition or changing of tariffs by the countries in these regions on
products of the type that we sell
|
|
|
·
|
changes
in the regulatory environment in these
regions
|
16
|
|
·
|
export
restrictions and export license
requirements
|
|
|
·
|
restrictions
on the export of critical
technology
|
|
|
·
|
our
ability to develop PC TV products that meet the varied technical
requirements of customers in each of these
regions
|
|
|
·
|
our
ability to maintain satisfactory relationships with our foreign customers
and distributors
|
|
|
·
|
changes
in freight rates
|
|
|
·
|
our
ability to enforce agreements and other rights in the countries in these
regions
|
|
|
·
|
difficulties
in staffing and managing international
operations
|
|
|
·
|
difficulties
assessing new and existing international markets and credit
risks
|
|
|
·
|
potential
insolvency of international customers and difficulty in collecting
accounts
|
If we are
unable to address any of these factors, it could have a material adverse effect
on our business, operating results and financial condition.
We
are heavily dependent upon foreign manufacturing facilities for our products,
primarily facilities in Asia, which exposes us to additional risks.
The
majority of our products are built at contract manufacturing facilities in Asia.
Our ability to successfully build products at overseas locations will depend on
many factors, including:
|
|
·
|
the
economic conditions in these
regions
|
|
|
·
|
the
acceptance of the U.S. dollar as the currency to purchase manufactured
products
|
|
|
·
|
the
stability of the political environment in these
regions
|
|
|
·
|
adverse
changes in the relationships between major countries in these
regions
|
|
|
·
|
the
state of trade relations among these regions and the United
States
|
|
|
·
|
restrictions
on trade in these regions
|
|
|
·
|
the
imposition or changing of tariffs by the countries in these regions on
products of the type that we sell
|
|
|
·
|
changes
in the regulatory environment in these
regions
|
|
|
·
|
import
restrictions and import license
requirements
|
|
|
·
|
our
ability to maintain satisfactory relationships with our foreign
manufacturers
|
|
|
·
|
changes
in freight rates
|
|
|
·
|
difficulties
in staffing and managing international
operations
|
|
|
·
|
potential
insolvency of vendors and difficulty in obtaining
materials
|
If we are
unable to address any of these factors, it could have a material adverse effect
on our business, operating results and financial condition.
Foreign
currency exchange fluctuations could adversely affect our results.
For the
two fiscal years ended September 30, 2010 and 2009, at least 40% of our sales
were generated by our European subsidiary and were invoiced and
collected in local currency, which was primarily the Euro. On the
supply side, since we predominantly deal with North American and Asian suppliers
and contract manufacturers, approximately 95% of our inventory required to
support our European sales are purchased and paid in U.S. Dollars.
The
combination of sales billed in Euros supported by inventory purchased in U.S.
Dollars results in an absence of a natural local currency hedge. Consequently,
our financial results are subject to market risks resulting from the
fluctuations in the Euro to U.S. Dollar exchange
rates.
See “Item
7—Management’s Discussion and Analysis of Financial Condition and Results of
Operations.”
17
We
may be unable to develop new products that meet customer requirements in a
timely manner.
Our
success is dependent on our ability to continue to introduce new products with
advanced features, functionality and performance that our customers demand. We
may not be able to introduce new products on a timely basis, that are accepted
by the market, and that sell in quantities sufficient to make the products
viable for the long-term. Sales of new products may negatively impact sales of
existing products. In addition, we may have difficulty establishing
our products' presence in markets where they do not currently have significant
brand recognition.
We
may experience volatile gross profit margins.
Over the
last two fiscal years our gross profit margins have ranged from a low of 15.03%
to a high of 29.21% due to the following factors, among
others:
|
|
·
|
larger
sales mix of lower margin products
|
|
|
·
|
changes
in foreign currency exchange rates
|
|
|
·
|
allowances
for excess inventory
|
|
|
·
|
increases
in costs charged by contract
manufacturers
|
|
|
·
|
increases
in duty and tariff rates
|
|
|
·
|
increases
in shipping costs
|
|
|
·
|
lower
average selling prices
|
|
|
·
|
increases
in material acquisition costs and
|
|
|
·
|
different
gross margins for like products in different
markets
|
As
margins may decline, our profitability will be more dependent upon effective
cost management controls. There can be no assurances that such cost
and management controls can be implemented and maintained, and if implemented,
that they will be successful.
We
have experienced, and expect to continue to experience, downward pricing
pressure on our products, which could substantially impair our operating
performance.
We are
experiencing, and are likely to continue to experience, downward pricing
pressure on our products. As a result, we have experienced, and we expect to
continue to experience, declining average sales prices for our
products. Increases in the number of units that we are able to sell
and reductions in per unit costs may not occur, and if they occur, they may not
be sufficient to offset reductions in per unit sales prices, in which case our
net income would be reduced and we could incur losses. Since we typically
negotiate supply arrangements far in advance of delivery dates, we may need to
commit to price reductions for our products before we are aware of how, or if,
these cost reductions can be obtained. As a result, any current or future price
reduction commitments and our inability to respond to increased price
competition could have a material adverse effect on our business, operating
results and financial condition.
Our
cost reduction and operational efficiency programs may not achieve the intended
results
Changing
economic and business conditions may dictate that we undertake a plan
of cost and operational efficiency reductions. We cannot be certain
that these programs will achieve their intended results. Additionally, these
programs may be misplaced or insufficient for purposes of positioning us for
future growth, in which case our long-term competitive position may
suffer. Failure of these programs, if any, could have a material
adverse effect on our business, operating results and financial
condition.
We
are dependent upon contract manufacturers for our production. If
these manufacturers do not meet our requirements, either in volume or quality,
then we could be materially harmed.
During
fiscal 2010, we subcontracted the manufacturing and assembly of our products to
six independent third parties at facilities in various Asian
countries.
Relying
on subcontractors involves a number of significant risks,
including:
· loss
of control over the manufacturing process
· potential
absence of adequate production capacity
· potential
delays in production lead times
· unavailability
of certain process technologies
18
· reduced
control over delivery schedules, manufacturing yields, quality and costs,
and
· unexpected
increases in component costs
We may
need to hold more inventory than is immediately required to compensate for
potential manufacturing disruptions.
If our
significant subcontractors become unable or unwilling to continue to manufacture
these products in required volumes, we will have to identify qualified alternate
subcontractors. Additional qualified subcontractors may not be available, or may
not be available on a timely or cost competitive basis. Any interruption in the
supply of, or increase in the cost of, the products manufactured by
third party subcontractors could have a material adverse effect on our business,
operating results and financial condition.
We
are dependent upon single or limited source suppliers for our components and
assembled products. If these suppliers do not meet the demand, either
in volume or quality, then we could be materially harmed.
If the
supply of a key component or assembled product, such as the WinTV-HVR-900, the
WinTV-Nova-T-Stick or a PCTV product, were to be delayed or curtailed or in the
event a key manufacturing or sole vendor delays shipment of such components or
completed products, our ability to ship products in desired quantities and in a
timely manner would be adversely affected. Our business, operating results and
financial condition could also be adversely affected, depending on the time
required to obtain sufficient quantities from the original source or, if
possible, to identify and obtain sufficient quantities from an alternative
source. We attempt to mitigate these potential risks by working closely with our
key suppliers on product introduction plans, strategic inventories, coordinated
product introductions, and internal and external manufacturing schedules and
levels. We are also seeking out alternative sources for assembled
products, making us less dependent on a single or limited source.
We may
need to hold more inventory than is immediately required to compensate for
potential component shortages or discontinuation. This could lead to an increase
in the costs of manufacturing or assembling our products.
If any
single or limited source supplier becomes unable or unwilling to continue to
supply these components or assembled products in required volumes, we will have
to identify and qualify acceptable replacements or redesign our products with
different components. Additional sources may not be available, or
product redesign may not be feasible on a timely basis. Any interruption in the
supply of or increase in the cost of the components and assembled products
provided by single or limited source suppliers could have a material adverse
effect on our business, operating results and financial condition.
We
may incur excessive expenses if we are unable to accurately forecast sales of
our products.
We
generally ship products within one to four weeks after receipt of orders.
Therefore, our sales backlog is typically minimal. Accordingly, our expectations
of future net sales and our product manufacturing and materials planning are
based largely on our own estimates of future demand and not on firm customer
orders.
If we
obtain orders in excess of our internal forecasts, we may be unable to timely
increase production to meet demand which could have a material adverse effect on
our business, operating results and financial condition. If our net
sales do not meet expectations, our business, operating results and financial
condition would be adversely affected, we may be burdened with excess inventory,
and we may be subject to excess costs or inventory write-offs.
We
may experience a reduction in sales if we are unable to respond quickly to
changes in the market for our products.
Our net
sales can be affected by changes in the quantity of products that our retail,
distributor and PC manufacturer customers maintain in their inventories. We may
be directly and rapidly affected by changes in the market, including the impact
of any slowdown or rapid increase in end user demand. Despite efforts to reduce
distribution channel inventory exposure, retailers, distribution
partners and PC manufacturer customers may still choose to alter their inventory
levels, which could cause a reduction in our net sales; this could have a
material adverse effect on our business, operating results and financial
condition.
19
We
may accumulate inventory to minimize the impact of shortages from manufacturers
and suppliers, which may result in obsolete inventory that we may need to write
off resulting in losses.
Managing
our inventory is complicated by fluctuations in the demand for our products as
well as the issues of using contract manufacturers and procuring components from
suppliers mentioned above. As we must plan to have sufficient quantities of
products available to satisfy our customers' demands, we sometimes accumulate
inventory for a period of time to minimize the impact of possible insufficient
capacity or availability of components from our manufacturers and suppliers.
Although we expect to sell the inventory within a short period of time, products
may remain in inventory for extended periods of time and may become obsolete
because of the passage of time and the introduction of new products or new
components within existing products. In these situations, we would be required
to write off obsolete inventory which could have a material adverse effect on
our business, operating results and financial condition.
We
may need financing, and may not be able to raise financing on favorable terms,
if at all, which could increase our costs and limit our ability to grow and
operate.
We
anticipate that we may need to raise additional capital in the future to
continue our long term expansion plans, to respond to competitive pressures or
to respond to unanticipated requirements. On March 31, 2009, our line
of credit with the JP Morgan Chase Bank expired and was not
renewed. We cannot be certain that we will be able to obtain
financing on commercially reasonable terms, if at all. Our failure or
inability to obtain financing on acceptable terms could require us to limit our
plans for expansion, incur indebtedness that has high rates of interest or
substantial restrictive covenants, issue equity securities that will dilute
existing stockholders’ holdings or discontinue a portion of our operations, each
of which could have a material adverse effect on our business, operating results
and financial condition.
We
may become involved in costly intellectual property disputes.
With the
proliferation of new products and rapidly changing technology, there is a
significant volume of patents and other intellectual property rights held by
third parties. There are a number of companies that hold patents for various
aspects of the technologies incorporated in some of the PC and TV industries'
standards. Given the nature of our products and development efforts,
there are risks that claims associated with such patents or intellectual
property rights could be asserted by third parties against us. We
expect that parties seeking to gain competitive advantages will increase their
efforts to enforce any patent or intellectual property rights that they may
have. The holders of patents from which we may have not obtained
licenses may take the position that it is required to obtain a license from
them.
If a
patent holder refuses to offer such a license or offers such a license on terms
unacceptable to us, there is a risk of incurring substantial litigation or
settlement costs regardless of the merits of the allegations, or which party
eventually prevails. If we do not prevail in a litigation suit, we may be
required to pay significant damages and/or to cease sales and production of
infringing products and accordingly, may incur significant defense
costs. Additionally, we may need to attempt to design around a given
technology, although there can be no assurances that this would be possible or
economical.
We
currently use technology licensed from third parties in certain
products. Our business, financial condition and operating results
could be adversely affected by a number of factors relating to these third-party
technologies, including:
|
|
·
|
failure
by a licensor to accurately develop, timely introduce, promote or support
the technology
|
|
|
·
|
delays
in shipment of products
|
|
|
·
|
excess
customer support or product return costs due to problems with licensed
technology
|
|
|
·
|
termination
of our relationship with such
licensors
|
We
may be unable to enforce our intellectual property rights.
We may
not be able to adequately protect our intellectual property through patent,
copyright, trademark and other means of protection. If we fail to
adequately protect our intellectual property, our intellectual property rights
may be misappropriated by others, invalidated or challenged, and our competitors
could duplicate our technology or may otherwise limit any competitive
technological advantage we may have. Due to the rapid pace of technological
change, we believe our success is likely to depend more upon continued
innovation, technical expertise, marketing skills and customer support and
service rather than upon legal protection of our proprietary rights. However, we
intend to aggressively assert our intellectual property rights when
necessary.
20
Even
though we typically develop our products independently, our success, of which
there can be no assurances, will depend, in a large part, on our
ability to innovate, obtain or license patents, protect trade secrets,
copyrights and trademarks, and draw upon our proprietary technology without
infringing on the proprietary rights of others. We maintain copyrights on our
designs and software programs, but currently we have no patent on the WinTV®
board as we believe that such technology cannot be patented.
We have
no patents issued or pending that relate to our technology. We are subject to a
number of risks relating to intellectual property rights, including the
following:
|
|
·
|
the
means by which we seek to protect our proprietary rights may not be
adequate to prevent others from misappropriating our technology or from
independently developing or selling technology or products with features
based on or similar to our products
|
|
|
·
|
our
products may be sold in foreign countries that provide less protection to
intellectual property than is provided under U.S.
laws
|
|
·
|
our
intellectual property rights may be challenged, invalidated, violated or
circumvented and may not provide us with any competitive
advantage
|
We
may not be able to attract and retain qualified managerial and other skilled
personnel.
Our
success, of which there can be no assurances, depends, in part, on our ability
to identify, attract, motivate and retain qualified managerial, technical and
sales personnel. Our success, of which there can be no assurances, is dependent
on our ability to manage effectively the enhancement and introduction of
existing and new products and the marketing of such products. We are
particularly dependent on our ability to identify, attract, motivate and retain
qualified managers, engineers and salespersons. The loss of the services of a
significant number of engineers or sales people or one or more senior officers
or managers could be disruptive to product development efforts or business
relationships and could seriously harm our business.
We
depend on a limited number of key personnel, and the loss of any of their
services could adversely affect our future growth and profitability and could
substantially interfere with our operations.
Our
products are complex and our market is evolving. The success of our business
depends in large part upon the continuing contributions of our management and
technical personnel. The loss of the services of any of our key officers or
employees could adversely affect our future growth and profitability and could
have a material adverse effect on our business, operating results and financial
condition.
Our
dependence upon our key officers and employees is increased by the fact that
they are responsible for our sales and marketing efforts as well as our overall
operations. We do not have key person life insurance policies covering any of
our employees other than Mr. Plotkin, our President, Chairman of the
Board, Chief Executive Officer and Chief Operating Officer. The
insurance coverage that we have on him may be insufficient to compensate us for
the loss of his services.
21
Our
products could contain defects, which could result in delays in recognition of
sales, loss of sales, loss of market share, or failure to achieve market
acceptance, or claims against us.
We
develop complex products for TV and video processing. Despite testing by our
engineers, subcontractors and customers, errors may be found in existing or
future products. This could result in, among other things, a delay in
recognition of sales, loss of sales, loss of market share, failure to achieve
market acceptance or substantial damage to our reputation. We could be subject
to material claims by customers, and may need to incur substantial expenses to
correct any product defects. We do not have product liability insurance to
protect against losses caused by defects in our products, and we also do not
have "errors and omissions" insurance. As a result, any payments that we may
need to make to satisfy our customers may be substantial and may result in a
substantial charge to earnings.
We
may experience fluctuations in our future operating results, which will make
predicting our future results difficult.
Historically,
our quarterly and annual operating results have varied significantly from period
to period, and we expect that our results will continue to do so. These
fluctuations result from a variety of factors, including:
|
·
|
market
acceptance of our products
|
|
·
|
changes
in order flow from our customers, and their inability to forecast their
needs accurately
|
|
·
|
the
timing of our new product announcements and of announcements by our
competitors
|
|
·
|
increased
competition, including changes in pricing by us and our
competitors
|
|
·
|
delays
in deliveries from our limited number of suppliers and
subcontractors
|
|
·
|
difficulty
in implementing effective cost management constraints;
and
|
|
·
|
market
and economic conditions
|
As our
sales are primarily to the consumer market, we have experienced certain seasonal
revenue trends. Our peak sales quarter, due to holiday season sales of computer
equipment, is typically our first fiscal quarter (October to December), followed
by our second fiscal quarter (January to March). In addition, our international
sales, mostly in the European market, were 54% and 52% of sales for the fiscal
years ended September 30, 2010 and 2009, respectively. Our fiscal fourth quarter
sales (July to September) can be potentially impacted by the reduction of
activity experienced in Europe during the July and August summer holiday period.
Accordingly, any sales or net income in any particular period may be lower than
the sales and net income in a preceding or comparable period. Period-to-period
comparisons of our results of operations may not be meaningful, and should not
be relied upon as indications of our future performance. In addition, our
operating results may be below the expectations of securities analysts and
investors in future periods. Failure to meet such expectations, should such an
event occur, will likely cause our share price to decline.
Our
Common Stock price is highly volatile.
The
market price of our Common Stock has been, and may continue to be, subject to a
high degree of volatility. Numerous factors may have a significant impact on the
market price of our Common Stock, including:
|
·
|
general
conditions in the PC and TV
industries
|
|
·
|
product
pricing
|
|
·
|
new
product introductions
|
|
·
|
market
growth forecasts
|
|
·
|
technological
innovations
|
|
·
|
mergers
and acquisitions
|
22
|
·
|
announcements
of quarterly operating results
|
|
·
|
overall
U.S. and international economic and market conditions and economic
health
|
|
·
|
stability
of the U.S. and international securities
markets
|
In
addition, stock markets have experienced extreme price volatility and broad
market fluctuations in recent years. This volatility has had a substantial
effect on the market price of securities issued by many high technology
companies in many cases for reasons unrelated to the operating performance of
the specific companies. The price of our Common Stock has experienced volatility
not necessarily related to our performance.
We
may not be able to maintain compliance with the requirements for continued
listing under the NASDAQ Listing Rules or we may not be able to maintain our
NASDAQ listing.
On
October 6, 2009, NASDAQ notified us that we were subject to delisting based on
our failure to timely hold our annual meeting. On December 9, 2009,
we held our annual meeting and on December 10, 2009, a NASDAQ Hearings Panel
rendered its determination to continue our listing.
On
November 18, 2009, we received a notice from NASDAQ indicating that we were not
in compliance with the $1.00 minimum closing bid price requirement for continued
listing on The Nasdaq Global Market, as set forth in NASDAQ Listing Rule
5450(a)(1) (the "Rule"). In accordance with NASDAQ Rule
5810(c)(3)(A), we were provided 180 calendar days, or until May 17, 2010, to
regain compliance with the $1.00 minimum closing bid price
requirement. On May 24, 2010, we received written notification (the
"May 24 Notice") from NASDAQ that we had regained compliance with the $1.00
minimum closing bid price requirement. The May 24 Notice stated that,
as a result of the our having satisfied the $1.00 per share minimum closing bid
price requirement for the ten consecutive business days ending on May 21, 2010,
we had regained compliance with the Rule and that this matter was now
closed.
No
assurances can be provided that we will be able to achieve or maintain
compliance with the requirements for continued listing under the NASDAQ Listing
Rules (including with respect to, among others things, minimum bid price and
stockholders’ equity) or that we will maintain our NASDAQ listing.
We
may not be able to maintain our listing on The Nasdaq Global Market or be
eligible for admittance on The Nasdaq Capital Market.
Our
Common Stock trades on The Nasdaq Global Market under the symbol
HAUP. If we fail to meet the continued listing standards of The
Nasdaq Global Market, our Common Stock could be delisted from The Nasdaq Global
Market. We may not be eligible for admittance on the NASDAQ Capital
Market. If our securities are delisted by NASDAQ, then the market
liquidity for such securities would likely be negatively affected, which may
make it more difficult for holders to sell such securities in the open market,
and we could face additional difficulty raising capital necessary for our
continued operation. Investors may find it more difficult to dispose
of or obtain accurate quotations as to the market value of our
securities.
Our
Amended and Restated By-Laws and the Rights Agreement to which we are party may
have anti-takeover effects, limiting the ability of outside stockholders to seek
control of management, and any premium over market price that an acquirer might
otherwise pay may be reduced and any merger or takeover may be
delayed.
Effective
August 16, 2001, the Board of Directors unanimously approved Amended and
Restated By-Laws for us (the “By-Laws”). The By-Laws do not permit
stockholders to call a special meeting of stockholders and consequently, an
expensive proxy contest cannot occur other than in connection with the annual
meeting of stockholders. The By-Laws also impose strict requirements
for shareholder proposals and nominations of prospective board members other
than those nominated by or at the discretion of the Board of
Directors. These amendments may collectively or individually impact a
person’s decision to purchase voting securities in our company and may have
anti-takeover effects in that any merger or takeover may be
delayed. Accordingly, any premium over market price that an acquirer
might otherwise pay may be reduced. On July 19, 2001, the Board of
Directors declared a dividend distribution of one Right for each outstanding
share of our Common Stock to stockholders of record at the close of business on
August 5, 2001. Each Right entitles the registered holder to purchase
from us one Common Share at a purchase price of $11.00 per share, subject to
adjustment and terms set out in the Rights Agreement between us and Continental
Stock Transfer & Trust Company, as Rights Agent.
23
The
Rights may have certain anti-takeover effects. The Rights will cause
substantial dilution to a person or group that attempts to acquire us in a
manner which causes the Rights to become discount Rights unless the offer is
conditional on a substantial number of Rights being
acquired. Accordingly, any premium over market price that an acquirer
might otherwise pay may be reduced.
We
have paid no dividends and none are anticipated.
We have
never paid any cash dividends on our Common Stock and do not contemplate or
anticipate paying any cash dividends on our Common Stock in the foreseeable
future. It is currently anticipated that earnings, if any, will be used to
finance the development and expansion of the business. In addition,
the Note contains restrictions on the payment of dividends, among other
things.
We
may not be able to effectively integrate businesses or assets that we
acquire.
We may
identify and pursue acquisitions of complementary companies and strategic
assets, such as customer bases, products and technology. However,
there can be no assurance that we will be able to identify suitable acquisition
opportunities.
If any
such opportunity involves the acquisition of a business, we cannot be certain
that:
|
|
·
|
we
will successfully integrate the operations of the acquired business with
our own
|
|
|
·
|
all
the benefits expected from such integration will be
realized
|
|
|
·
|
management's
attention will not be diverted or divided, to the detriment of current
operations
|
|
|
·
|
amortization
of acquired intangible assets will not have a negative effect on operating
results or other aspects of our
business
|
|
|
·
|
delays
or unexpected costs related to the acquisition will not have a detrimental
effect on our business, operating results and financial
condition
|
|
|
·
|
customer
dissatisfaction with, or performance problems at, an acquired company will
not have an adverse effect on our
reputation
|
|
|
·
|
respective
operations, management and personnel will be
compatible.
|
In most
cases, acquisitions will be consummated without seeking and obtaining
stockholder approval, in which case stockholders will not have an opportunity to
consider and vote upon the merits of such an acquisition.
Although
we will endeavor to evaluate the risks inherent in a particular acquisition,
there can be no assurance that we will properly ascertain or assess such
risks.
We
have a history of operating losses and there can be no assurance that we will be
profitable in the future.
We
incurred losses from continuing operations for the last three fiscal
years. While we believe that, with the proper execution of our
business and operating plan, our cash and cash equivalents as of September 30,
2010 and our internally generated cash will provide us with sufficient liquidity
to meet our capital needs for the next twelve months, we must ultimately remain
profitable or obtain financing to be able to meet our future cash flow
requirements, and there can be no assurance that we will be able to do
so. In addition, there can be no assurance that we will be able to
obtain financing on commercially reasonable terms, if at all.
ITEM 1B. UNRESOLVED
STAFF COMMENTS
Not
applicable
24
ITEM 2. PROPERTIES
We occupy
a facility located at 91 Cabot Court, Hauppauge, New York that we use for our
executive offices and for the testing, storage and shipping of our
products. Hauppauge Computer Works, Inc., (“HCW”)
leased the premises (the “1990 Lease”), from Ladokk Realty Co., a
real estate partnership which is principally owned by Kenneth Plotkin,
our President, Chairman of the Board, Chief Executive Officer and
Chief Operating Officer and the holder of approximately 8.44% of our
shares of Common Stock as of September 30, 2010, Dorothy
Plotkin, the wife of Kenneth Plotkin, holder of approximately 5.47% of our
shares of Common Stock as September 30,
2010, and Laura Aupperle, believed by us to be the holder of
approximately 7.00% of our shares of Common Stock as of September 30,
2010. We are obligated to pay real estate taxes and operating costs
of maintaining the premises under the 1990 Lease.
The
current lease on the premises commenced as of September 1, 2006 and ends on
August 31, 2011 and calls for base rent in the first year of the term
of $300,000, payable monthly in the amount of $25,000. Rent is subject to an
annual increase of 3% over the term. The execution of the current lease was
approved by our Board of Directors, following the recommendation of our Audit
Committee. Under the current lease HCW is obligated to pay for
utilities, repairs to the premises, and taxes during the term.
On May 1,
2001, Hauppauge Digital Europe Sarl commenced a lease of a 15,642 square foot
building in Blanchardstown, Dublin, Ireland. The facility houses our
European warehousing and distribution center. The lease, which
is for the standard twenty-five year term in Ireland with the right to terminate
by the lessee on the fifth and tenth year of the lease, calls for an annual rent
of approximately $179,000. The rent includes an allocation for common
area maintenance charges.
Our PCTV
Systems operation occupies approximately 8,400 square feet in Braunschweig,
Germany. This location houses our PCTV engineering and product development
personnel. The lease expires on March 31, 2014 and calls for an annual rent of
approximately $115,000.
Our
Singapore subsidiary, Hauppauge Digital Asia Pte Ltd., occupies approximately
5,400 square feet in Singapore, which it uses as a sales and administration
office and for the testing, storage and shipping of our products. The lease
expires on November 30, 2011 and calls for an annual rent of approximately
$63,000. The rent includes an allocation for common area maintenance
charges.
Our
German subsidiary, Hauppauge Computer Works GMBH, occupies approximately 6,000
square feet in Mönchengladbach, Germany. It is used as our European sales office
and customer support center. It also has a product demonstration room
and a storage facility. Hauppauge Computer Works GMBH pays an annual
rent of approximately $55,000 for this facility pursuant to a rental agreement,
which expires on October 31, 2011.
HCW
occupies a shared office facility at the Danville Business Center in Danville,
California. We use the California office as our western region sales
office. The lease expires on May 31, 2011 and requires us to
pay an annual rent, which includes telecommunications services, of approximately
$9,800.
ITEM
3. LEGAL PROCEEDINGS
We are
presently party to no pending material legal proceedings.
ITEM
4. (REMOVED AND RESERVED)
25
PART II
ITEM
5. MARKET FOR REGISTRANT’S COMMON
EQUITY, RELATED STOCKHOLDER MATTERS AND ISSUER PURCHASES OF EQUITY
SECURITIES
Our
Common Stock trades on the NASDAQ Global Market under the symbol
HAUP. The range of high and low sales prices for our Common Stock
during the two fiscal years ended September 30, 2010 and 2009 were as
follows:
|
Year ended September 30,
2010
|
High
|
Low
|
||||||
|
First
Quarter
|
1.12 | 0.62 | ||||||
|
Second
Quarter
|
0.93 | 0.70 | ||||||
|
Third
Quarter
|
3.93 | 0.86 | ||||||
|
Fourth
Quarter
|
2.57 | 1.78 | ||||||
|
Year ended September 30,
2009
|
High
|
Low
|
||||||
|
First
Quarter
|
1.16 | 0.82 | ||||||
|
Second
Quarter
|
1.86 | 1.01 | ||||||
|
Third
Quarter
|
1.40 | 1.03 | ||||||
|
Fourth
Quarter
|
1.31 | 0.95 | ||||||
We have
been advised by our transfer agent, Continental Stock Transfer & Trust
Company, that the approximate number of holders of record (registered holders)
of our Common Stock as of December 28, 2010 was 141.
No cash
dividends have been paid during the two fiscal years ended September 30, 2010.
We have no present intention of paying any cash dividends in our foreseeable
future and intend to use our net income, if any, in our operations.
On
November 8, 1996, we approved a stock repurchase program. The program
authorized us to repurchase up to 850,000 shares of our own stock. The stock
repurchase program was extended by a resolution of our Board of Directors on
December 17, 1997. At our August 3, 2007 Board meeting, our Board of
Directors approved an increase in the number of shares which can be repurchased
under the plan to 1,200,000. As of September 30, 2010 we had
repurchased 760,479 shares as an average price of $3.16
Securities
Authorized for Issuance Under Equity Compensation Plans
Set forth
in the table below is certain information regarding the number of shares of our
common stock that may be issued under options, warrants and rights pursuant to
all of our existing equity compensation plans as of September 30,
2010.
Equity
Compensation Plan Information
|
Plan Category
|
Number of securities
to be issued upon
exercise of
outstanding options,
warrants and rights
|
Weighted average
exercise price of
outstanding options,
warrants and
rights
|
Number of securities
remaining available for
future issuance under
equity compensation
plans (excluding
securities reflected in the
first column)
|
|||||||||
|
Equity
compensation plans approved by stockholders
|
1,454,442 | $ | 3.31 | 326,625 | ||||||||
|
Equity
compensation plans not approved by stockholders
|
- | $ | - | - | ||||||||
|
Total
|
1,454,442 | $ | 3.31 | 326,625 | ||||||||
26
ITEM
6. SELECTED FINANCIAL DATA
Item 301
of Regulation S-K “Selected Financial Data” is not required for Smaller
Reporting Companies.
27
ITEM
7. MANAGEMENT’S DISCUSSION AND ANALYSIS OF FINANCIAL
CONDITION AND RESULTS
OF OPERATIONS
Results
of operations
Twelve
months ended September 30, 2010 compared to September 30, 2009.
Results
of operations for the twelve months ended September 30, 2010 compared to
September 30, 2009 are as follows:
|
Twelve
|
Twelve
|
|||||||||||||||||||||||
|
Months
|
Months
|
|||||||||||||||||||||||
|
Ended
|
Ended
|
Variance
|
Percentage of sales
|
|||||||||||||||||||||
|
9/30/10
|
9/30/09
|
$
|
2010
|
2009
|
Variance
|
|||||||||||||||||||
|
Net
Sales
|
$ | 56,918,617 | $ | 59,344,538 | $ | (2,425,921 | ) | 100.00 | % | 100.00 | % | -4.09 | % | |||||||||||
|
Cost
of sales
|
38,486,848 | 46,557,904 | (8,071,056 | ) | 67.62 | % | 78.45 | % | -10.83 | % | ||||||||||||||
|
Gross
Profit
|
18,431,769 | 12,786,634 | 5,645,135 | 32.38 | % | 21.55 | % | 10.84 | % | |||||||||||||||
|
Gross
Profit %
|
32.38 | % | 21.55 | % | 10.83 | % | ||||||||||||||||||
|
Expenses:
|
||||||||||||||||||||||||
|
Sales
& marketing
|
9,917,378 | 10,634,647 | (717,269 | ) | 17.41 | % | 17.92 | % | -0.51 | % | ||||||||||||||
|
Sales
& marketing-PCTV
|
424,051 | 320,732 | 103,319 | 0.75 | % | 0.54 | % | 0.20 | % | |||||||||||||||
|
Technical
support
|
465,741 | 549,046 | (83,305 | ) | 0.82 | % | 0.93 | % | -0.11 | % | ||||||||||||||
|
General
& administrative
|
3,446,878 | 3,433,719 | 13,159 | 6.06 | % | 5.79 | % | 0.26 | % | |||||||||||||||
|
General
& administrative-PCTV
|
291,647 | 266,250 | 25,397 | 0.51 | % | 0.45 | % | 0.06 | % | |||||||||||||||
|
Amortization
of intangible assets
|
754,836 | 566,127 | 188,709 | 1.33 | % | 0.95 | % | 0.37 | % | |||||||||||||||
|
Selling,
general and administrative stock compensation expense
|
278,549 | 347,069 | (68,520 | ) | 0.49 | % | 0.58 | % | -0.10 | % | ||||||||||||||
|
Total selling,
general and administrative expense
|
15,579,080 | 16,117,590 | (538,510 | ) | 27.37 | % | 27.16 | % | 0.20 | % | ||||||||||||||
|
Research and
development
|
2,505,704 | 2,819,542 | (313,838 | ) | 4.40 | % | 4.75 | % | -0.35 | % | ||||||||||||||
|
Research and
development-PCTV
|
1,796,627 | 1,410,777 | 385,850 | 3.16 | % | 2.38 | % | 0.78 | % | |||||||||||||||
|
Research
and development stock compensation expense
|
156,584 | 191,616 | (35,032 | ) | 0.28 | % | 0.32 | % | -0.04 | % | ||||||||||||||
|
Total
expenses
|
20,037,995 | 20,539,525 | (501,530 | ) | 35.21 | % | 34.61 | % | 0.59 | % | ||||||||||||||
|
Net
operating loss
|
(1,606,226 | ) | (7,752,891 | ) | 6,146,665 | -2.83 | % | -13.06 | % | 10.24 | % | |||||||||||||
|
Other
income :
|
||||||||||||||||||||||||
|
Interest
income
|
5,373 | 14,217 | (8,844 | ) | 0.01 | % | 0.02 | % | -0.01 | % | ||||||||||||||
|
Interest (expense)
|
(4,340 | ) | (62,557 | ) | 58,217 | -0.01 | % | -0.11 | % | 0.09 | % | |||||||||||||
|
Foreign
currency
|
227,902 | 670,760 | (442,858 | ) | 0.40 | % | 1.13 | % | -0.73 | % | ||||||||||||||
|
Total
other income
|
228,935 | 622,420 | (393,485 | ) | 0.40 | % | 1.04 | % | -0.66 | % | ||||||||||||||
|
Loss before
tax provision
|
(1,377,291 | ) | (7,130,471 | ) | 5,753,180 | -2.43 | % | -12.02 | % | 9.59 | % | |||||||||||||
|
Deferred
tax expense (benefit)
|
264,247 | (164,501 | ) | 428,748 | 0.45 | % | -0.28 | % | 0.73 | % | ||||||||||||||
|
Current
income tax
|
205,022 | 177,051 | 27,971 | 0.36 | % | 0.30 | % | 0.06 | % | |||||||||||||||
|
Net
loss
|
$ | (1,846,560 | ) | $ | (7,143,021 | ) | $ | 5,296,461 | -3.24 | % | -12.04 | % | 8.80 | % | ||||||||||
Net sales
for the twelve months ended September 30, 2010 decreased $2,425,921 compared to
the twelve months ended September 30, 2009 as shown in the table
below.
|
Increase
|
||||||||||||||||||||||||
|
(decrease)
|
Increase
|
Percentage of sales by
|
||||||||||||||||||||||
|
Twelve Months
|
Twelve Months
|
Dollar
|
(decrease)
|
Geographic region
|
||||||||||||||||||||
|
Location
|
Ended 9/30/10
|
Ended 9/30/09
|
Variance
|
Variance %
|
2010
|
2009
|
||||||||||||||||||
|
Domestic
|
$ | 26,194,015 | $ | 28,480,464 | $ | (2,286,449 | ) | -8 | % | 46 | % | 48 | % | |||||||||||
|
Europe
|
29,329,137 | 28,932,928 | 396,209 | 1 | % | 52 | % | 49 | % | |||||||||||||||
|
Asia
|
1,395,465 | 1,931,146 | (535,681 | ) | -28 | % | 2 | % | 3 | % | ||||||||||||||
|
Total
|
$ | 56,918,617 | $ | 59,344,538 | $ | (2,425,921 | ) | -4 | % | 100 | % | 100 | % | |||||||||||
We
experienced a decrease in unit sales of about 8.48%, while changes in sales mix,
the addition of PCTV product line sales increased the average unit price by
about 12.66%. Sales were impacted by lower consumer demand primarily
in Europe due to the weak global economic conditions and a weaker Euro exchange
rate during the second half of our fiscal year.
28
Seasonal
nature of sales
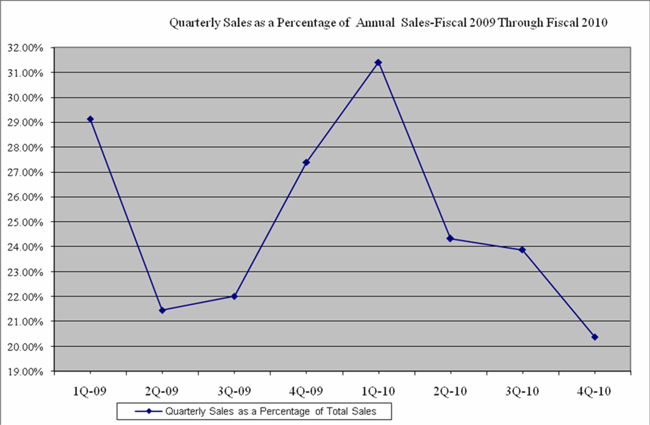
As the
chart above indicates, there is a seasonal pattern to our quarterly
sales. Listed below are the primary causes of our
seasonal
sales:
|
|
·
|
We
primarily sell through a sales channel which consists of retailers, PC
manufacturers and distributors. Spurred on by holiday spending,
our sales during our first fiscal quarter, which encompasses the holiday
season, have historically been the highest of our fiscal
year.
|
|
|
·
|
For
each of the fiscal years ended September 30, 2009 and 2010 at least 40% of
our sales were generated by our European subsidiary. We
typically experience a slowdown due to the summer holiday period in Europe
starting with the second half of our fiscal third quarter and into the
first half of our fiscal fourth quarter. We also experience
decreased sales in the U.S during the summer holiday
months. This has historically caused sales for the last six
months of our fiscal year to be lower than the first six months of our
fiscal year. As the chart above indicates, our sales for the first six
months of fiscal 2009 and fiscal 2010 accounted for 51% and 56% of sales,
respectively, and our sales for the last six months of fiscal 2009 and
2010 accounted for 49% and 44% of sales,
respectively.
|
Although
our strategy has been to diversify our sales to minimize the seasonal nature of
our business, we anticipate similar seasonal trends for the near term
future.
Gross
profit
Gross
profit increased $5,645,135 for the twelve months ended September 30, 2010
compared to the twelve months ended September 30, 2009.
29
The
increase in the gross profit is detailed below:
|
Increase
|
||||
|
(decrease)
|
||||
|
Decrease
in sales
|
$ | (785,062 | ) | |
|
Higher
gross profit on sales mix
|
3,288,773 | |||
|
Higher
gross profit due Euro exchange rate
|
227,024 | |||
|
Lower
production and production related costs
|
278,691 | |||
|
Change
in accrued expense fees due to settlements and changes in
estimates
|
2,253,709 | |||
|
Change
in accrued expense fees due to correction of error related to prior
periods
|
382,000 | |||
|
Total
increase in gross profit
|
$ | 5,645,135 | ||
Gross
profit percentage for the twelve months ended September 30, 2010 was 32.38%
compared to 21.55% for the twelve months ended September 30, 2009, an increase
of 10.83%.
The
increase in the gross profit percentage is detailed below:
|
Increase
|
||||
|
(decrease)
|
||||
|
Higher gross
profit on sales mix
|
5.89 | % | ||
|
Increase
in gross profit due Euro exchange
rate
|
0.28 | % | ||
|
Lower production
and production related costs as a percentage of sales
|
0.03 | % | ||
|
Change
in accrued expense fees due to settlements and changes in
estimates
|
3.96 | % | ||
|
Change
in accrued expense fees due to correction of error related to
prior periods
|
0.67 | % | ||
|
Total
increase in gross profit percentage
|
10.83 | % | ||
The
increase in the gross profit percentage for the twelve months ended September
30, 2010 compared to the twelve months ended September 30, 2009 was primarily
due to:
|
|
·
|
Favorable
changes in product sales mix, price stabilization and the addition of the
PCTV product line resulted in an increase in the gross profit percentage
for fiscal 2010 over fiscal 2009 of
5.89%.
|
|
|
·
|
Reductions
in production and production related costs such as building overhead,
packaging costs, freight costs and labor costs at a third party facility
resulted in an increase in the gross profit percentage for fiscal
2010 over fiscal 2009 of
0.03%.
|
|
|
·
|
An
increase in the average Euro to USD rate from $1.3532 for fiscal 2009 to
$1.3570 for fiscal 2010 resulted in an increase in gross profit percentage
of 0.28% for fiscal 2010 over fiscal
2009.
|
|
|
·
|
Changes
in accrued expense fees due to settlements and changes in estimates
resulted in a gross profit percentage increase of 3.96% for fiscal
2010.
|
|
|
·
|
Changes
in accrued expense fees due to correction of error related to prior
periods resulted in a gross profit percentage increase of 0.67% for fiscal
2010.
|
30
Volatility
of gross profit percentage:
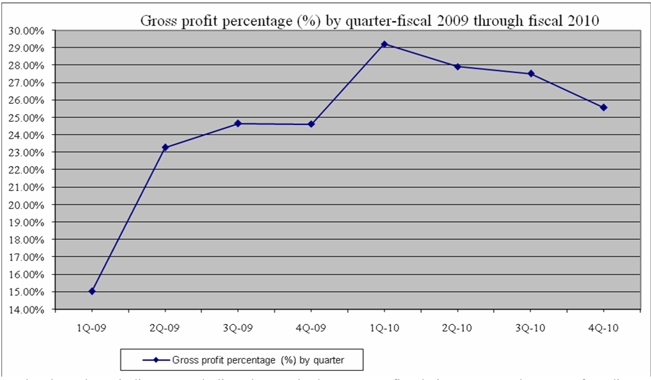
As the
chart above indicates, excluding changes in the gross profit relating to accrued
expense fee adjustments due to settlements and changes in estimates, over the
eight quarters of fiscal 2009 and fiscal 2010, the gross profit percentage has
ranged from a low of 15.03% to a high of 29.21%.
Factors
affecting the volatility of our gross profit percentages are:
|
|
·
|
Mix
of gross profit percentages: gross profit percentages vary within our
retail family of products as well as for products sold to computer
manufacturers. Varying sales mix of these product lines affects the
quarterly gross profit percentage.
|
|
|
·
|
Volatility
of Euro to U.S. dollar exchange rate. With over 40% of our sales
denominated in Euros, changes in the Euro to U.S. dollar exchange rate
impact gross profit. An increase in the Euro tends to increase our gross
profit percentage, while a decrease in the Euro tends to decrease our
gross profit percentage.
|
|
|
·
|
Fluctuating
quarterly sales caused by seasonal trends: included in cost of sales are
certain fixed costs, mainly for production labor, warehouse labor and the
overhead costs of our Ireland distribution facility. When unit and dollar
sales decline due to seasonal sales trends, these fixed costs get spread
over lower unit and dollar sales, resulting
in increased unit costs and increased fixed costs as
a percentage of sales, which lowers the gross profit
percentage.
|
|
|
·
|
Competitive
pressures: our market is constantly changing with new competitors joining
our established competitors. These competitive pressures from time to time
result in a lowering of our average sales prices to meet our competitors’
prices, which tends to reduce the gross profit and gross profit
percentage.
|
|
|
·
|
Supply
of component parts: in times when component parts are in short supply we
have to manage price increases. Conversely, when component parts’ supply
is high we may be able to secure price
decreases.
|
|
|
·
|
Sales
volume: as unit sales volume increases we have more leverage in
negotiating volume price reductions with our component suppliers and our
contract manufacturers.
|
|
|
·
|
Cost
reductions: we evaluate the pricing we receive from our suppliers and our
contract manufacturers and we often seek to achieve component part and
contract manufacturer cost
reductions.
|
|
|
·
|
Mix
of sales that impact our obligation to pay certain licensing
costs.
|
|
|
·
|
Volatility
of fuel prices: increases in fuel costs are reflected in the amounts we
pay for the delivery of product from our suppliers and the amounts we pay
for deliveries to our customers. Rising fuel prices increase our freight
costs and negatively impact our gross
profit.
|
Managing
product mix through market strategy and new products, moderating seasonal
trends, efficiently managing shipments and achieving cost reductions are a
company priority and are critical to our competitive position in the
market. Although our goal is to optimize gross profit and minimize
gross profit fluctuations, in light of the dynamics of our market we anticipate
the continuance of gross profit percentage fluctuations.
31
Selling,
general and administrative expenses
The chart
below illustrates the components of selling, general and administrative
expenses.
|
Twelve months ended September 30,
|
||||||||||||||||||||||||
|
Dollar Amounts
|
Percentage of Sales
|
|||||||||||||||||||||||
|
Increase
|
||||||||||||||||||||||||
|
2010
|
2009
|
(Decrease)
|
2010
|
2009
|
Increase
|
|||||||||||||||||||
|
Sales
& marketing-HCW
|
$ | 9,917,378 | $ | 10,634,647 | $ | (717,269 | ) | 17.41 | % | 17.92 | % | -0.51 | % | |||||||||||
|
Sales
& marketing-PCTV
|
424,051 | 320,732 | 103,319 | 0.75 | % | 0.54 | % | 0.20 | % | |||||||||||||||
|
Technical
support
|
465,741 | 549,046 | (83,305 | ) | 0.82 | % | 0.93 | % | -0.11 | % | ||||||||||||||
|
General
& administrative-HCW
|
3,446,878 | 3,433,719 | 13,159 | 6.06 | % | 5.79 | % | 0.26 | % | |||||||||||||||
|
General
& administrative-PCTV
|
291,647 | 266,250 | 25,397 | 0.51 | % | 0.45 | % | 0.06 | % | |||||||||||||||
|
Amortization
of intangible assets
|
754,836 | 566,127 | 188,709 | 1.33 | % | 0.95 | % | 0.37 | % | |||||||||||||||
|
Selling,
general and administrative stock compensation expense
|
278,549 | 347,069 | (68,520 | ) | 0.49 | % | 0.58 | % | -0.10 | % | ||||||||||||||
|
Total selling,
general and administrative expense
|
$ | 15,579,080 | $ | 16,117,590 | $ | (538,510 | ) | 27.37 | % | 27.16 | % | 0.20 | % | |||||||||||
Selling,
general and administrative expense for the fiscal 2010 decreased $538,510
compared to fiscal 2009.
Excluding
the PCTV expenses and amortization of intangible assets acquired in the PCTV
acquisition, selling, general and administrative expenses decreased $855,935
from the prior year. Sales and marketing expenses for HCW decreased $717,269,
driven by reductions in trade show expenses of $70,790, lower sales office
expenses of $353,861, mainly due to personnel and overhead reductions plus lower
sales and lower advertising expense of $286,170 due lower sales.
Sales and
marketing expenses related to the PCTV product line increased $103,319. The PCTV
acquisition was finalized at the end of December 2008, so the results for fiscal
2009 only included nine months of PCTV expenses while the results for the fiscal
2010 included PCTV expenses for twelve months.
General
and administrative expenses for HCW and the PCTV product line remained
consistent year over year.
The increase in amortization of
intangible assets of $188,709 was related to intangible assets acquired in the
purchase of the PCTV business. The PCTV acquisition was finalized at the end of
December 2008, so the results for fiscal 2009 only included nine months of
intangible asset amortization while the results for fiscal 2010 included twelve
months of intangible asset amortization.
32
Selling,
general and administrative expense as a percentage of sales
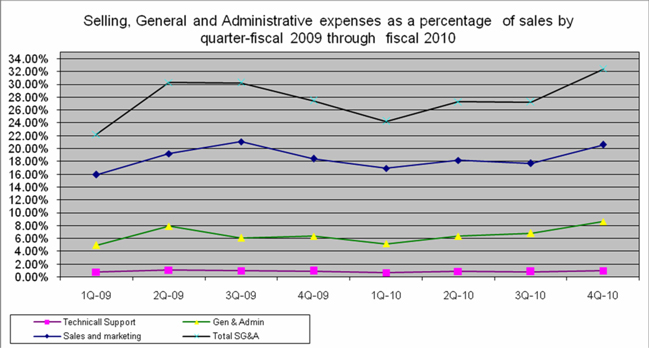
The chart
above shows the quarterly fluctuations for technical support, general and
administrative, sales and marketing and total selling, general and
administrative expense. Due to fixed costs which fluctuate minimally
with changes in sales coupled with the seasonal nature of our business, selling
general and administrative expense as a percentage of sales are sensitive to
seasonal sales fluctuations. Over the eight quarters of fiscal 2009 and fiscal
2010, selling general and administrative expense as a percentage of sales has
resulted in the following trends:
|
|
·
|
With
our first quarter usually yielding the highest quarterly sales levels of
the fiscal year, selling, general and administrative expense as a
percentage of sales have typically been the lowest of the fiscal
year. As reflected in the chart, selling, general and
administrative expense as a percentage of sales was the lowest in the
first quarter of fiscal 2009 and
2010.
|
|
|
·
|
Reflecting
the seasonal trend in sales, selling, general and administrative expense
for the third or fourth quarter are the highest as a percentage
of sales. Total selling, general and administrative expense as
a percentage of sales were the highest in the third quarter of fiscal 2009
and fourth quarter of fiscal 2010.
|
|
|
·
|
Reflecting
the decline in sales, total selling, general and administrative expenses
as a percent of sales were higher for fiscal 2010 compared to fiscal
2009.
|
With the
expectation that the seasonal nature of sales will continue for the near future,
we expect selling, general and administrative expenses as a percentage of sales
to reflect a future trend that is similar to the historical trends we have
experienced over the prior two fiscal years.
Research
and development expense
Research
and development expense increased $36,980 from the prior fiscal year as
follows:
|
Research
and development expense
|
||||||||||||
|
Fiscal 2010 increases
(decreases) from fiscal 2009
|
HCW
|
PCTV
|
Total
|
|||||||||
|
Research
and development expense-HCW
|
$ | (313,838 | ) | $ | 0 | $ | (313,838 | ) | ||||
|
Research
and development expense-PCTV
|
0 | 385,850 | 385,850 | |||||||||
|
Stock
compensation expense
|
(35,032 | ) | 0 | (35,032 | ) | |||||||
|
Total
research and development increase (decrease)
|
$ | (348,870 | ) | $ | 385,850 | $ | 36,980 | |||||
33
Excluding
the expense of the PCTV division, research and development expense decreased
$313,838 from the prior fiscal year. The decrease was primarily due to personnel
and personnel related reductions and the number of development programs in
process.
Offsetting
the expense decreases were $385,850 in expense related to personnel and
development programs of the PCTV business. The PCTV acquisition
was finalized at the end of December 2008, so the results for fiscal 2009 only
included nine months of PCTV expenses, while the results for the fiscal 2010
included PCTV expenses for twelve months.
Other
income
Other
income for the twelve months ended September 30, 2010 was $228,935 compared to
other income of $622,420 for the twelve months ended September 30, 2009 as
detailed below:
|
Twelve months ended September 30,
|
||||||||
|
2010
|
2009
|
|||||||
|
Interest
income
|
$ | 5,373 | $ | 14,217 | ||||
|
Interest
(expense)
|
(4,340 | ) | (62,557 | ) | ||||
|
Foreign
currency transaction gains
|
227,902 | 670,760 | ||||||
|
Total
other income
|
$ | 228,935 | $ | 622,420 | ||||
Lower
interest income was due to lower interest rate yields coupled with less cash
invested. Lower interest expense was due to the note payable to Avid
Technology, Inc. being paid in full as of December 24, 2009. Lower foreign
currency transaction gains were due to lower Euro exchange rates.
Tax
provision
Our net
tax provision for the year ended September 30, 2010 and 2009 is as
follows:
|
Twelve months ended
September 30,
|
||||||||
|
2010
|
2009
|
|||||||
|
Deferred
tax expense (benefit)
|
$ | 264,247 | $ | (164,500 | ) | |||
|
Foreign
income tax
|
165,022 | 137,050 | ||||||
|
State
income tax
|
40,000 | 40,000 | ||||||
|
Net
tax provision
|
$ | 469,269 | $ | 12,550 | ||||
Our net
deferred tax asset is primarily attributable to our Hauppauge Computer Works
Inc. domestic operations and consists primarily of timing
differences. In evaluating the future realization of our deferred tax
asset and the corresponding valuation allowance as of September 30, 2010, we
took into consideration.
|
|
·
|
our
domestic operations had taxable
income for four out of the last
five fiscal years
|
|
|
·
|
including
royalties paid to our domestic operations by our European
subsidiary, we anticipate taxable income for our
domestic operations for fiscal
2011
|
|
|
·
|
our history of utilization
of prior domestic net operating
losses
|
After
evaluating the circumstances listed above, it was our opinion that our net
deferred tax asset of $1,920,938 is realizable as of September 30,
2010.
As a
result of all of the above items mentioned in the Management’s Discussion and
Analysis of Financial Condition and Results of Operations, we had a
net loss of $1,846,560 for the twelve months
ended September 30, 2010, which resulted in basic and
diluted net loss per share of $0.18 on weighted average
basic and diluted shares of 10,066,637, compared to a net
loss of $7,143,021 for the twelve months ended
September 30, 2009, which resulted in basic and
diluted net loss per share of $0.71 on weighted average
basic and diluted shares of 10,045,449.
34
Options
to purchase 1,454,442 and 1,522,394 shares of Common Stock at prices ranging
$1.05 to $7.45 and $1.08 to $8.75, respectively, were
outstanding as of September 30, 2010 and 2009, respectively, but were not
included in the computation of diluted net income per share of Common Stock
because they were anti-dilutive.
Liquidity
and Capital Resources
Our cash,
working capital and stockholders’ equity position is set forth
below:
|
As of September 30,
|
||||||||
|
2010
|
2009
|
|||||||
|
Cash
|
$ | 7,057,904 | $ | 8,368,342 | ||||
|
Working
Capital
|
4,777,442 | 5,885,577 | ||||||
|
Stockholders’
Equity
|
9,980,642 | 12,334,866 | ||||||
We had
cash and cash equivalents as of September 30, 2010 of $7,057,904 a decrease of
$1,310,438 from September 30, 2009.
The
decrease in cash was due to:
|
Operating
|
Investing
|
Financing
|
||||||||||||||
|
|
Activities
|
Activities
|
Activities
|
Total
|
||||||||||||
|
Sources
of cash:
|
||||||||||||||||
|
Decrease
in accounts receivable
|
$ | 5,360,314 | $ | - | $ | - | $ | 5,360,314 | ||||||||
|
Net
loss adjusted for non cash items
|
500,198 | - | - | 500,198 | ||||||||||||
|
Proceeds
from employee stock purchases
|
0 | - | 27,829 | 27,829 | ||||||||||||
|
Total
sources of cash
|
5,860,512 | - | 27,829 | 5,888,341 | ||||||||||||
|
Less cash used
for:
|
||||||||||||||||
|
Decrease
in accounts payable and accrued expenses
|
$ | (3,726,119 | ) | $ | - | $ | - | $ | (3,726,119 | ) | ||||||
|
Increase
in inventory
|
(2,346,246 | ) | - | - | (2,346,246 | ) | ||||||||||
|
Effect
of exchange rates on cash
|
(477,618 | ) | - | - | (477,618 | ) | ||||||||||
|
PCTV
acquisition-net of note payable
|
- | (511,332 | ) | - | (511,332 | ) | ||||||||||
|
Capital
equipment purchases
|
- | (62,792 | ) | - | (62,792 | ) | ||||||||||
|
Increase
in prepaid expenses and other current assets
|
(73,461 | ) | - | - | (73,461 | ) | ||||||||||
|
Purchase
of treasury shares
|
- | - | (1,211 | ) | (1,211 | ) | ||||||||||
|
Total
usage of cash
|
(6,623,444 | ) | (574,124 | ) | (1,211 | ) | (7,198,779 | ) | ||||||||
|
Net
cash decrease
|
$ | (762,932 | ) | $ | (574,124 | ) | $ | 26,618 | $ | (1,310,438 | ) | |||||
Net cash
provided by operating activities was due to a decrease in accounts receivable of
$5,360,314 and the net loss adjusted for non cash items of $500,198. Offsetting
these cash sources from operating activities was an increase in inventories of
$2,346,246, a decrease in accounts payable and accrued expenses of $ 3,726,119
and an increase in prepaid expenses and other current assets of
$73,461 The decrease in accounts receivable was due to lower
sales during the fourth quarter of fiscal 2010 compared to the fourth quarter of
fiscal 2009. The increase in inventory was due to inventory
purchased earlier in the year to cover holiday promotions and world
cup promotions.
Cash of
$574,124 was used in investing activities. Of this amount, the
Company paid $511,332 on the note payable to Avid Technologies, Inc and $62,792
was used to purchase fixed assets. The note to Avid Technologies,
Inc. was fully paid on December 24, 2009. Cash of $27,829 from
financing activities came from purchases of stock under our employee stock
purchase plan and employee stock option plan and $1,211 was used to purchase
treasury stock.
Our cash
requirements for the next twelve months will include, among other things, the
cash needed to fund our operating and working capital needs. With the
proper execution of our business and operating plan, we believe that our cash
and cash equivalents as of September 30, 2010 and our internally generated cash
will provide us with sufficient liquidity to meet our capital needs for the next
twelve months. Failure to meet the business and operating plan could
require the need for additional sources of capital. In light of
the current economic and credit conditions there can be no assurances that we
will be able to find external sources of financing to fund our additional
capital needs. In addition, if we are able to obtain financing, there
can be no assurances that it will be on financially reasonable
terms.
35
On March
31, 2009 our line of credit with the JP Morgan Chase Bank expired and was not
renewed.
On
November 8, 1996, we approved a stock repurchase program. The program
authorized us to repurchase up to 850,000 shares of our own stock. The stock
repurchase program was extended by a resolution of our Board of Directors on
December 17, 1997. At our August 3, 2007 Board meeting,
our Board of Directors approved an increase in the number of shares
which can be repurchased under the plan to 1,200,000. As of September
30, 2010, we held 760,479 treasury shares purchased for $2,405,548 at an average
purchase price of $3.16. As of September 30, 2009, we held 759,579
treasury shares purchased for $2,404,337 at an average purchase price of
approximately $3.17 per share.
Sources
and (usage) of cash components
The chart
below shows our cash balances, sources of cash and (usage) of cash by quarter
for fiscal 2009 through fiscal 2010.
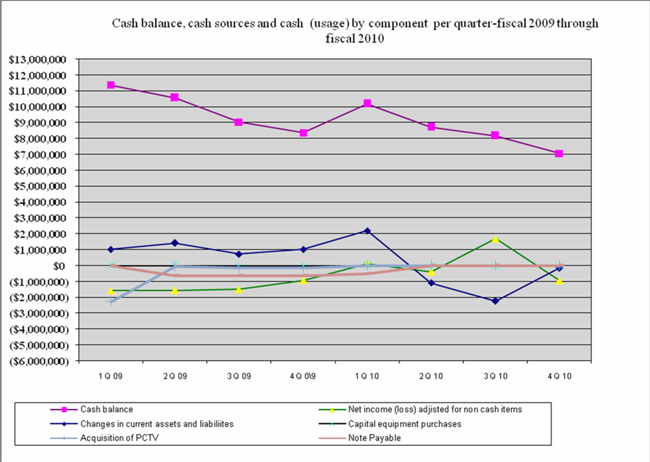
Our sources and (usage) of cash
primarily comes from the items listed below:
|
|
·
|
Net
loss adjusted for non cash items
|
|
|
·
|
Changes
in the levels of current assets and current liabilities, primarily
accounts receivable, inventories and accounts
payable
|
|
|
·
|
Effects
of exchange rates on cash
|
|
|
·
|
Purchase
of capital equipment
|
Since
accounts receivable, inventory and current liabilities make up the majority of
our current asset and current liability levels, our cash balances are affected
by changes in these assets and liabilities. In the quarters where cash was used
to increase the current asset levels or decrease the current liability levels,
there was usually a corresponding decrease or neutral position in the cash
balances during those quarters. Conversely, in the quarters when we
generated cash by reducing the current asset levels or increasing the current
liability levels, there was a corresponding increase in the cash balances during
those quarters.
36
We expect
for the near term future that our operating structure will remain similar to
past years, therefore our investment and subsequent changes in
our current assets and current liabilities required to fund our
operating cycles will continue to have a material impact on our cash generation,
cash usage and cash balances.
Future
Contractual Obligation
The
following table shows our contractual obligations related to lease and note
payable obligations as of September 30, 2010:
|
Payments due by period
|
||||||||||||||||
|
Total
|
Less than 1 year
|
1-3 years
|
3 to 5 years
|
|||||||||||||
|
Operating
lease obligations
|
$ | 1,144,654 | $ | 725,810 | $ | 359,906 | $ | 58,938 | ||||||||
Inflation
While
inflation has not had a material effect on our operations in the past, there can
be no assurance that we will be able to continue to offset the effects of
inflation on the costs of our products or services through price increases to
our customers without experiencing a reduction in the demand for our products;
or that inflation will not have an overall effect on the computer equipment
market that would have a material affect on us.
Critical
Accounting Policies and Estimates
We
believe the following critical accounting policies affect the significant
judgments and estimates used in the preparation of our financial
statements:
|
|
·
|
Revenue
Recognition
|
|
|
·
|
Management’s
estimates
|
|
|
·
|
Translation
of assets and liabilities denominated
in non-functional currencies on our European financial
statements
|
|
|
·
|
Inventory
obsolescence and reserves
|
|
|
·
|
Accounts
receivable related
reserves
|
|
|
·
|
Intangible
assets
|
Revenue
Recognition
We sell
through a sales channel which consists of retailers, PC manufacturers and
distributors. The majority of our customers are granted lines of credit. The
product is shipped on account with the majority of
customers typically given 30 to 60 day payment terms. Those customers
deemed as large credit risks either pay in advance or issue us a letter of
credit.
We
require the customer to submit a purchase order to us. The price of
the product and payment terms are fixed per the terms of the purchase
order. Upon shipment of the order to the customer, the title to the
goods is passed to the customer. The customer is legally obligated to pay for
the order within the payment terms stated on the customer’s purchase
order. The obligation to insure the boards and the cost of any
pilferage while in the customer’s possession is the responsibility of the
customer. We sell analog, hybrid video recorders or digital computer
boards that are stocked on the shelves of retailers and are subject to the
normal consumer traffic that retail stores attract. Aside from normal store
promotions such as advertisements in the store’s circular, we have no further
obligation to assist in the resale of the products.
We offer
some of our customers a right of return. Our accounting complies with FASB ASC
605-15 (SFAS 48) Revenue Recognition when Right of Return Exists, as typically
at the end of every quarter we, based on historical data, evaluate our sales
reserve level based on the previous six months sales. Due to the
seasonal nature of the business coupled with the changing economic environment,
management exercises some judgment with regard to the historical data to arrive
at the reserve.
We offer
mail-in rebates on certain products at certain times as we may determine. The
rebates are recorded as a reduction to sales. We also participate in limited
cooperative advertising programs with retailers and distributors and account for
these in accordance with FASB ASC 605-50 (EITF 01-09), “Accounting for
Consideration Given by a Vendor to a Customer (Including a Reseller of the
Vendor’s Products)”.
37
Management’s
Estimates
The
discussion and analysis of our financial condition and results of operations are
based upon our consolidated financial
statements which have been prepared in accordance with accounting principles
generally accepted in the United States. The preparation of these
financial statements requires management to make estimates and judgments that
affect the reported amounts of assets, liabilities and related
disclosure of contingent assets and liabilities at the date of the consolidated
financial statements and the reported amounts for revenues, cost of
sales and expenses during the reporting period. On an ongoing basis, management
evaluates estimates, including those related to sales provisions, as described
above, income taxes, bad debts, inventory allowances, accrued licensing fees and
other contingencies. We base our estimates on historical
data, when available, experience, and on various other assumptions that are
believed to be reasonable under the circumstances, the combined results of which
form the basis for making judgments about the carrying values of assets and
liabilities that are not readily apparent from other sources. Actual results may
differ from these estimates.
Translation of assets and
liabilities denominated in non-functional currencies on our
European financial statements
The
functional currency of our European subsidiary is the Euro. In
preparing our consolidated financial statements, we are required to translate
assets and liabilities denominated in a non-functional currency, mainly U.S.
Dollars, to Euros on the books of our European subsidiary. This
process results in exchange gains and losses depending on the changes in the
Euro to U.S. Dollar exchange rate. Under the relevant
accounting guidance, with the exception of inter-company accounts which are
considered long term in nature, we are obligated to include these gains and
losses on our statement of operations, which we report in other
income or expense under the caption “foreign currency”.
The
extent of these gains and losses can fluctuate greatly from month to month
depending on the change in the exchange rate, causing results to vary
widely. Due to the past volatility of the Euro, it is difficult to
forecast the long term trend of these gains and losses.
Inventory
obsolescence and reserves
The technology underlying our products
and other products in the computer industry, in general, is subject to rapid
change, including the potential introduction of new types of products and
technologies. Due to this, we maintain a program in
which we review on a regular basis our inventory forecasting, inventory
purchasing and our inventory levels. We review our inventory
realization and inventory reserves on a quarterly basis.
Accounts
receivable and related reserves
On a
daily basis we credit approve all orders scheduled for shipment. Customers who
are over their credit limit or who have invoices that are past their due date
are typically placed on credit hold until the credit problem is
resolved. Credit reviews are performed on new
customers. Existing customers who request an increased credit line
are subject to a new credit review before increases in their credit line are
approved.
Our
reserve for bad debt is done using a specific identification method. On a
quarterly basis we review the age and quality of our accounts receivable. We
reserve amounts due us from companies that have gone bankrupt or companies that
we evaluate are near bankrupt.
Our
products are sold through a sales channel which consist of retailers, PC
manufacturers and distributors. Our product is primarily a retail product sold
to end user consumers. Similar to other companies in the computer
industry, our products are subject to returns by the end user. In
recognition that product may be returned at a later
date, at the end of every quarter, based on historical data, we
evaluate our sales reserve level based on the previous six months sales and we
adjust our sales reserve as required.
38
Intangible
assets
Long-lived
assets include definite-lived intangible assets. Definite-lived intangible
assets are evaluated for impairment whenever events or changes in circumstances
indicate that the carrying amount of the assets may not be recoverable through
the estimated undiscounted future cash flows derived from such assets.
Definite-lived intangible assets primarily consist of covenant not to compete,
customer relationships and technology. When an impairment exists, the
related assets are written down to fair value. Although we believe our
judgments, estimates and/or assumptions used in estimating cash flows and
determining fair value are reasonable, making material changes to such
judgments, estimates and/or assumptions could materially affect such impairment
analyses and our financial results.
Recent
Accounting Pronouncements
In
January 2010, the FASB issued an accounting standard update amending the
disclosure requirements for financial instruments under fair value. New
disclosures required include the amount of significant transfers in and out of
levels 1 and 2 fair value measurements and the reasons for the transfers. In
addition, the reconciliation for level 3 activity will be required on a gross
rather than net basis. The update provides additional guidance related to the
level of disaggregation in determining classes of assets and liabilities and
disclosures about inputs and valuation techniques. The Company does not expect
the adoption of this guidance to have a material impact on its consolidated
financial statements and disclosures.
In
September 2009, the FASB issued a standard which modifies the revenue
recognition guidance for arrangements that involve the delivery of multiple
elements, such as product, software, services or support, to a customer at
different times as part of a single revenue generating transaction. This
standard provides principles and application guidance to determine whether
multiple deliverables exist, how the individual deliverables should be separated
and how to allocate the revenue in the arrangement among those separate
deliverables. The standard also expands the disclosure requirements for multiple
deliverable revenue arrangements. The Company does not expect the adoption of
this guidance to have a material impact on its consolidated financial
statements.
ITEM
7A. QUANTITATIVE AND QUALITATIVE DISCLOSURES ABOUT MARKET RISKS
Item 305
of Regulation S-K “Quantitative and Qualitative Disclosures About Market Risks”
is not required for Smaller Reporting Companies.
ITEM
8. FINANCIAL STATEMENTS AND SUPPLEMENTARY DATA
The
financial statements required by this Item 8 are included in this Annual Report
on Form
10-K
following Item 15 hereof.
ITEM
9. CHANGES IN AND DISAGREEMENTS WITH ACCOUNTANTS ON ACCOUNTING AND
FINANCIAL DISCLOSURE
None.
ITEM
9A. CONTROLS AND PROCEDURES
Disclosure
Controls and Procedures
Our principal executive officer and
principal financial officer, after evaluating the effectiveness of our
disclosure controls and procedures (as defined in paragraph (e) of Rules 13a-15
and 15d-15 under the Securities Exchange Act of 1934) as of the end of the
period covered by this Annual Report on Form 10-K, have concluded that, based on
such evaluation, our disclosure controls and procedures were effective to ensure
that information required to be disclosed by us in the reports that we file or
submit under the Securities Exchange Act of 1934 is recorded, processed,
summarized and reported, within the time periods specified in the SEC's rules
and forms and is accumulated and communicated to management, including our
principal executive officer and principal financial officer, or persons
performing similar functions, as appropriate to allow timely decisions regarding
required disclosure.
39
Management’s
Annual Report on Internal Control Over Financial Reporting
Management
is responsible for establishing and maintaining adequate internal control over
financial reporting as defined in Exchange Act Rules 13a-15(f) and 15d-15(f)
under the Securities Exchange Act of 1934. Internal Control over
financial reporting is a process designed by, or under the supervision of, our
principal executive officer and principal financial officer, or persons
performing similar functions, and effected by our board of directors,
management, and other personnel, to provide reasonable assurance regarding the
reliability of financial reporting and the preparation of financial statements
for external purposes in accordance with generally accepted accounting
principles. Our internal control over financial reporting
includes policies and procedures that (i) pertain to the maintenance
of records that in reasonable detail accurately and fairly reflect the
transactions and dispositions of our assets; (ii) provide reasonable assurance
that transactions are recorded as necessary to permit preparation of financial
statements in accordance with generally accepted accounting principles, and that
our receipts and expenditures are being made only in accordance with
authorizations of our management and directors; and (iii) provide reasonable
assurance regarding prevention or timely detection of unauthorized
acquisition, use, or disposition of our assets that could have a
material effect on the financial statements.
Because
of its inherent limitations, internal control over financial reporting may not
prevent or detect misstatements. Also, projections of any evaluation of
effectiveness to future periods are subject to risk that controls may
become inadequate because of changes in conditions, or that the degree of
compliance with policies or procedures may deteriorate.
Management assessed the effectiveness
of our internal control over financial reporting as of September 30,
2010. Management conducted its evaluation of the effectiveness of our
internal control over financial reporting based on the framework in Internal Control –
Integrated Framework
issued by the Committee of Sponsoring Organizations of the Treadway
Commission. Based on this evaluation, management has concluded that,
as of September 30, 2010, our internal control over financial reporting was
effective.
Exclusion
of Registered Public Accounting Firm Attestation Report due to Rules of the
Securities and Exchange Commission
Changes
in Internal Control Over Financial Reporting
There has
been no change in our internal control over financial
reporting during our fourth fiscal quarter ended September
30, 2010 that has materially affected, or is reasonably likely to materially
affect, our internal control over financial reporting.
ITEM
9B. OTHER INFORMATION
None.
40
PART
III
ITEM
10. DIRECTORS, EXECUTIVE OFFICERS AND CORPORATE GOVERNANCE
The
following table sets forth the positions and offices presently held with us by
each of our directors and executive officers, his age as of September 30, 2010
and the year in which each director became a director.
|
Name
|
Age
|
Positions and Offices Held
|
Year Became
Director
|
|||
|
Kenneth
Plotkin
|
59
|
Chairman
of the Board, Chief Executive Officer, President, Chief Operating Officer
and Director
|
1994
|
|||
|
Gerald
Tucciarone
|
55
|
Chief
Financial Officer, Treasurer and Secretary
|
||||
|
John
Casey
|
54
|
Vice
President of Technology
|
||||
|
Bernard
Herman
|
83
|
Director
|
1996
|
|||
|
Christopher
G. Payan
|
36
|
Director
|
2003
|
|||
|
Seymour
G. Siegel
|
67
|
Director
|
2003
|
Kenneth
Plotkin is one of our co-founders and has served as our Chairman of the
Board, Chief Executive Officer and one of our directors since our inception in
1994. He has been our President and Chief Operating Officer since
September 27, 2004 and has also served in such offices from March 14, 2001 until
May 1, 2002. Mr. Plotkin served as our Secretary until June 20, 2001
and Vice-President of Marketing from August 2, 1994 until October 16,
2005. He holds a BS and an MS in Electrical Engineering from the
State University of New York at Stony Brook. We believe that Mr. Plotkin’s past
business experience in addition to holding the position of CEO since 1994 give
him the qualifications and skills necessary to serve as one of our
directors.
Gerald Tucciarone joined us in January 1995 and has served as Chief Financial Officer and Treasurer since such time. He has served as our Secretary since July 25, 2005. Prior to his joining us, Mr. Tucciarone served as Vice-President of Finance, from 1985 to 1992, with Walker-Telecommunications, Inc., a manufacturer of phones and voice-mail equipment, and from 1992 to 1995, as Assistant Controller with Chadbourne and Parke. Mr. Tucciarone is a certified public accountant.
John Casey
has been our Vice President of Technology since January 1995.
Bernard
Herman has served as one of our directors since 1996. From
1979 to 1993, Mr. Herman was Chief Executive Officer of Okidata Corp. of Mount
Laurel, New Jersey, a distributor of computer peripheral
products. Since then, he has served as a consultant with reference to
computer products. He is also an Arbitration Neutral for the American
Arbitration Association and the National Association of Securities
Dealers. We believe that Mr. Herman’s business experience as the
former Chief Executive Officer of Okidata Corp. gives him the qualifications and
skills necessary to serve as one of our directors.
Christopher G.
Payan has served as one of our directors since May 16,
2003. Mr. Payan served as the Chief Executive Officer of Emerging
Vision, Inc. (“EVI”), an optical retailer that operates nearly 150 franchised
and company owned retail locations throughout the United States, from June 2004
through November 30, 2009 and a director of EVI from March 2004
through November 30, 2009. From October 2001 until June 2004, Mr. Payan
served as the Senior Vice President of Finance, Chief Financial Officer,
Secretary and Treasurer of EVI. From April 2002 until June of 2004,
Mr. Payan served as Co-Chief Operating Officer of EVI. Mr. Payan also
serves on the Board of Directors of Newtek Business Services,
Inc. From March 1995 through July 2001, Mr. Payan worked for Arthur
Andersen LLP, where he provided various audit, accounting, consulting and
advisory services to various small and mid-sized private and public companies in
various industries. Mr. Payan is a certified public accountant and
holds a Bachelor of Science degree, graduating Cum Laude, with Honors, from C.W.
Post – Long Island University. We believe that Mr. Payan’s business experience
as the former Chief Executive Officer, Chief Operating Officer and Chief
Financial Officer of Emerging Vision, Inc. (“EVI”) give him the qualifications
and skills necessary to serve as one of our directors.
41
Seymour G.
Siegel has served as one of our directors since May 16,
2003. He is a Certified Public Accountant and since April 2000 had
been a principal in the Business Consulting Group of Rothstein, Kass &
Company, P.C., an accounting and consulting firm. From 1974 to 1990
he was managing partner and founder of Siegel Rich and Co, P.C., CPAs which
merged into Weiser & Co., LLC, where he was a senior partner. He formed
Siegel Rich Inc. in 1994, which, in April, 2000, became a division of Rothstein,
Kass & Company, P.C. Mr. Siegel has been a director, trustee and
officer of numerous businesses, philanthropic and civic
organizations. He has served as a director and member of the audit
committees of Barpoint.com, Oak Hall Capital Fund, Prime Motor Inns Limited
Partnership and Noise Cancellation Technologies Inc., all public
companies. He is currently a director and chairman of the audit
committee of EVI and Air Industries Inc. He is also a member of the
compensation committee of EVI. We believe that Mr. Siegel’s business expertise
and experience and his accounting background give him the qualifications and
skills necessary to serve as one of our directors.
Family
Relationships
There is
no family relationship among any of our executive officers and
directors.
Term
of Office
Each
director will hold office until the next annual meeting of stockholders and
until his or her successor is elected and qualified or until his/her earlier
resignation, removal or death. Each executive officer will hold office until the
next regular meeting of the Board of Directors following the next annual meeting
of stockholders and until his or her successor is elected or appointed and
qualified or until his or her earlier death, resignation or removal from
office.
Audit
Committee
The Audit
Committee of the Board of Directors is responsible for (i) recommending
independent registered public accountants to the Board, (ii) reviewing our
financial statements with management and the independent registered public
accountants, (iii) making an appraisal of our audit effort and the effectiveness
of our financial policies and practices and (iv) consulting with management and
our independent registered public accountants with regard to the adequacy of
internal accounting controls. The members of the Audit Committee
currently are Messrs. Herman, Payan and Siegel.
Audit
Committee Financial Expert
Our Board of Directors has determined
that we have an "audit committee financial expert" (as defined by Item 407(d)(5)
of Regulation S-K as promulgated by the Securities and Exchange Commission)
serving on our Audit Committee. Our audit committee financial expert
is Seymour G. Siegel. The directors who serve on the Audit Committee
are "independent" directors based on the definition of independence in the
listing standards of The Nasdaq Stock Market.
Code
of Ethics
Our Board
of Directors has adopted a Code of Ethics for our officers, directors and
employees, including our principal executive officer, principal financial
officer, principal accounting officer or controller and other persons performing
similar functions. You can obtain a free copy of our Code of Ethics
by writing to our Secretary at our offices at 91 Cabot Court, Hauppauge, New
York 11788. We intend to satisfy the disclosure requirement under
Item 5.05(c) of Form 8-K (formerly Item 10) regarding an amendment to, or waiver
from, a provision of our Code of Ethics that applies to our principal executive
officer, principal financial officer, principal accounting officer or
controller, or persons performing similar functions and that relates to any
element of the code of ethics definition enumerated in paragraph (b) of Item 406
of Regulation S-K by posting such information on our website, www.hauppauge.com.
42
Section
16(a) Beneficial Ownership Reporting Compliance
Section
16 of the Securities Exchange Act of 1934, as amended (“Section 16”), requires
that reports of beneficial ownership of capital stock and changes in such
ownership be filed with the Securities and Exchange Commission by Section 16
“reporting persons,” including directors, certain officers, holders of more than
10% of the outstanding common stock and certain trusts of which reporting
persons are trustees and that copies of such reports be furnished to
us.
To our
knowledge, based solely on a review of copies of Forms 3, 4 and 5 furnished to
us and written representations from such persons that no other reports were
required, our officers, directors and 10% stockholders complied with all Section
16(a) filing requirements applicable to them during the fiscal year ended
September 30, 2010.
ITEM
11. EXECUTIVE COMPENSATION
Summary
Compensation Table
The
following table sets forth certain compensation information for each of the
fiscal years ended September 30, 2010 and 2009 for our Chief Executive Officer
and two other most highly compensated executive officers.
|
Name and Principal
Position
|
Fiscal
Year
|
Salary
($)
|
Bonus
($)
|
Option Awards
($)
|
All Other
Compen-
sation
($)
|
Total
($)
|
||||||||||||||||
|
Kenneth
Plotkin
|
2010
|
$ | 172,386 | $ | - | $ | - | $ | 6,000 | (2) | $ | 178,386 | ||||||||||
|
President,
Chairman of the Board, Chief Executive Officer, and Chief
Operating Officer
|
2009
|
$ | 183,186 | $ | - | $ | - | $ | 6,000 | (2) | $ | 189,186 | ||||||||||
|
Gerald
Tucciarone
|
2010
|
$ | 149,468 | $ | - | $ | 9,875 | (1)(3) | - | $ | 159,343 | |||||||||||
|
Treasurer, Chief Financial
Officer, and
Secretary
|
2009
|
$ | 158,948 | $ | - | $ | - | - | $ | 158,948 | ||||||||||||
|
John
Casey
|
2010
|
$ | 147,576 | $ | - | $ | 9,875 | (1)(3) | - | $ | 157,451 | |||||||||||
|
Vice President of Technology
|
2009
|
$ | 156,936 | $ | - | $ | - | - | $ | 156,936 | ||||||||||||
|
(1)
|
Represents the aggregate grant
date fair value of option awards computed in accordance with FASB ASC-718
(SFAS No. 123R). See Note 1 of Notes to Consolidated
Financial Statements included in our Annual Report on Form 10-K for the
fiscal year ended September 30, 2010 for a description of the assumptions
used in that computation. The actual value realized with respect to option
awards will depend on the difference between the market value of our
common stock on the date the option is exercised and the exercise
price.
|
|
(2)
|
Represents non-cash compensation
in the form of the use of a car and related
expenses.
|
43
|
(3)
|
12,500 options were granted on
April 26, 2010 at an exercise price of $1.27 and a fair value price of
$0.79. The options vest to the extent of 6,250 shares on April
26, 2011 and 6,250 shares on April 26, 2012 and expire on April 25,
2020.
|
Employment
Contracts
As of
January 10, 1998, following the expiration of a prior employment agreement with
us, Kenneth Plotkin entered into a new employment agreement (the "1998
Employment Agreement") with us to serve in certain of our
offices. The 1998 Employment Agreement provides for a three-year
term, which term automatically renews on an annual basis, unless otherwise
terminated by the Board or the executive. The 1998 Employment
Agreement provides for an annual base salary of $125,000 during the first year,
$150,000 during the second year, and $180,000 during the third year. For each
Annual Period (as defined in the 1998 Employment Agreement) thereafter, the 1998
Employment Agreement provides that compensation shall be mutually agreed upon by
the Company and the executive, said amount not to be less than that for the
preceding Annual Period.
On
January 21, 1998, pursuant to the 1998 Employment Agreement, (i) incentive stock
options to acquire a total of 90,000 shares of our common stock were granted to
Mr. Plotkin, exercisable, beginning on January 21, 1999, in increments of 33
1/3% per year at $2.544 per share, each such increment due to expire 5 years
after becoming exercisable and (ii) non-qualified options to acquire a total of
60,000 shares of common stock were granted to Mr. Plotkin, exercisable
immediately for a period of 10 years, which expired as of January 20,
2008.
The 1998
Employment Agreement provides for a bonus to be paid to Mr. Plotkin as follows:
an amount equal to 2% of our earnings, excluding earnings that are not from
operations and before reduction for interest and income taxes ("EBIT"), for each
fiscal year commencing with the year ended September 30, 1998, provided that our
EBIT for the applicable fiscal year exceeds 120% of the prior fiscal year's
EBIT, and if not, then 1% of our EBIT. The determination of EBIT
shall be made in accordance with our audited filings with the Securities and
Exchange Commission on our Form 10-K.
The 1998
Employment Agreement further provides for disability benefits, our obligation to
pay the premiums on a term life insurance policy or policies in the amount of
$500,000 on the life of Mr. Plotkin, owned by Mr. Plotkin or his spouse, or a
trust for their respective benefit or for the benefit of their family, a car
allowance of $500 per month, reasonable reimbursement for automobile expenses,
and medical insurance as is standard for our executives. Furthermore,
the 1998 Employment Agreement provides that we may apply for, and own, life
insurance on the life of Mr. Plotkin for our benefit, in such amount as the
Board may from time to time determine; we shall pay these premiums as they
become due on any such insurance policies; and all dividends and any cash value
and proceeds on such insurance policies shall belong to us.
OUTSTANDING
EQUITY AWARDS AT FISCAL YEAR-END
The
following table sets forth certain information concerning outstanding option
awards held by our named executive officers as of the fiscal year ended
September 30, 2010.
44
OPTION
AWARDS
Number of Securities Underlying
Unexercised Options
|
Name
|
Exercisable
|
Unexercisable
|
Option
Exercise
Price ($) (1)
|
Option
Expiration
Date
|
||||||||||
|
Kenneth
Plotkin
|
10,000 | - | $ | 1.16 |
10/01/2011
|
|||||||||
| 10,000 | - | $ | 1.19 |
10/16/2012
|
||||||||||
| 5,000 | - | $ | 3.32 |
8/09/2014
|
||||||||||
| 120,000 | 80,000 | (2) | $ | 4.96 |
11/20/2016
|
|||||||||
|
Gerald
Tucciarone
|
10,000 | - | $ | 1.05 |
10/01/2011
|
|||||||||
| 22,500 | - | $ | 1.08 |
10/16/2012
|
||||||||||
| 20,000 | - | $ | 4.62 |
2/11/2015
|
||||||||||
| 20,000 | 10,000 | (3) | $ | 7.45 |
1/22/2017
|
|||||||||
| 8,000 | (4) | $ | 1.64 |
6/26/2018
|
||||||||||
| 12,500 | (5) | $ | 1.27 |
4/25/2020
|
||||||||||
|
John
Casey
|
10,000 | - | $ | 1.05 |
10/01/2011
|
|||||||||
| 30,000 | - | $ | 1.08 |
10/16/2012
|
||||||||||
| 20,000 | - | $ | 4.62 |
2/11/2015
|
||||||||||
| 12,000 | 4,000 | (6) | $ | 7.45 |
1/22/2017
|
|||||||||
| 4,000 | 4,000 | (7) | $ | 4.13 |
12/26/2017
|
|||||||||
| 5,000 | (8) | $ | 1.64 |
6/26/2018
|
||||||||||
| 12,500 | (9) | $ | 1.27 |
4/25/2020
|
||||||||||
|
(1)
|
Calculated using the closing
price of our common stock on the date of the
grant.
|
|
(2)
|
80,000 options vest to the extent
of 40,000 shares on November 20, 2010 and 40,000 shares on November 20,
2011.
|
|
(3)
|
10,000 options vest on February
1, 2011.
|
|
(4)
|
8,000
options vest to the extent of 4,000 shares on June 26, 2011 and 4,000
shares on June 26, 2012.
|
|
(5)
|
12,500 options vest to the extent
of 6,250 shares on April 26, 2011 and 6,250 shares on April 26,
2012.
|
|
(6)
|
4,000 options on February 1,
2011.
|
|
(7)
|
4,000 options vest on December
26, 2010.
|
|
(8)
|
5,000 options vest to the extent
of 2,500 shares on June 26, 2011 and 2,500 shares on June 26,
2012.
|
|
(9)
|
12,500 options vest to the extent
of 6,250 shares on April 26, 2011 and 6,250 shares on April 26,
2012.
|
Termination
of Employment and Change in Control Agreements
In the
event of a termination of employment associated with a Change in Control of the
Company, as defined in the 1998 Employment Agreement, a one-time bonus shall be
paid to the executive equal to three times the amount of the executive's average
annual compensation (including salary, bonus and benefits, paid or accrued)
received by him for the thirty-six month period preceding the date of the Change
of Control.
In the
event of a Change in Control, as defined in our 1998 Incentive Stock Option
Plan, options granted to the named executive officers pursuant to said plan
shall become immediately vested and exercisable. The 1998 Incentive
Stock Option Plan further provides that options granted shall terminate if and
when the optionee ceases to be our employee or the employee of one our
subsidiaries, unless (1) the optionee shall die while in our employ or the
employ of one of our subsidiaries, in which case, the options shall be
exercisable, as and to the extent exercisable by such person or persons as shall
have acquired the optionee's rights by will or the laws of descent and
distribution, but not later than one year after the date of death and not after
the expiration of the specific period fixed in the option grant or (2) the
optionee shall become disabled (within the meaning of section 105(d)(4) of the
Internal Revenue Code) while in our employ or the employ of one of
our subsidiaries and such optionee's employment shall terminate by reason of
such disability, in which case the options shall be exercisable, as and to the
extent exercisable at the time of the termination of his employment, within such
period as shall be set forth in the option grant, but only within one year after
the termination of the optionee's employment and not after the expiration of the
specific period fixed in the option grant as in effect at the time of the
termination of his employment. In the event of a termination of employment
associated with a Change in Control, as defined in the 2003 Performance and
Equity Incentive Plan, options granted pursuant to said plan shall vest or be
exercisable upon termination of an employee’s employment within 24 months from
the date of the Change in Control, but only to the extent determined by the
Board (or the Committee, as defined in such plan), unless the employee is
terminated for Cause or the employee resigns his employment without Good Reason
(as such terms are defined in the 2003 Performance and Equity Incentive
Plan).
45
DIRECTOR
COMPENSATION FOR 2010 FISCAL YEAR
The
following table sets forth compensation paid to our non-employee directors for
the fiscal year ended September 30, 2010:
|
Name
|
Fees Earned or
Paid in Cash
|
Option
Awards
|
Stock Awards
|
All Other
Compensation
|
Total
|
|||||||||||
|
Bernard
Herman
|
$
|
30,150
|
$
|
-
|
-
|
(1) |
$
|
-
|
$
|
30,150
|
||||||
|
Christopher
G. Payan
|
$
|
31,500
|
$
|
-
|
-
|
(2) |
$
|
-
|
$
|
31,500
|
||||||
|
Seymour
G. Siegel
|
$
|
40,500
|
$
|
-
|
-
|
(3) |
$
|
-
|
$
|
40,500
|
||||||
During
fiscal year 2010, each of Bernard Herman, Christopher G. Payan and Seymour G.
Siegel, each a non-employee director, received an annual retainer of $18,000,
paid in quarterly installments in advance, and $1,350 for every Board meeting
that he attended in person. Additionally, the Chairman of the
Audit Committee, Mr. Siegel, received an annual stipend of $9,000.
|
(1)
|
As
of September 30, 2010, Mr. Herman held options to purchase 50,000 shares
of the Company’s Common Stock and had awards of 8,994 shares of the
Company’s Common Stock outstanding.
|
|
(2)
|
As
of September 30, 2010, Mr. Payan held options to purchase 25,000 shares of
the Company’s Common Stock.
|
|
(3)
|
As
of September 30, 2010, Mr. Siegel held options to purchase 45,000 shares
of the Company’s Common Stock and had awards of 5,000 shares of the
Company’s Common Stock outstanding.
|
ITEM
12. SECURITY OWNERSHIP OF CERTAIN BENEFICIAL OWNERS AND MANAGEMENT
AND RELATED STOCKHOLDER MATTERS
Security
Ownership
The
following table sets forth, to our knowledge based solely upon records available
to us, certain information as of December 28, 2010 regarding the beneficial
ownership of our shares of common stock by (i) each person who we believe to be
the beneficial owner of more than 5% of our outstanding shares of common stock,
(ii) each current director, (iii) each of the named executive officers, and (iv)
all current executive officers and directors as a group.
46
|
Name and Address
of Beneficial Owner
|
Title of Class
|
Amount and Nature of
Beneficial
Ownership
|
Percent
of Class
|
|||||||
|
Kenneth
Plotkin
|
||||||||||
|
91
Cabot Court
|
||||||||||
|
Hauppauge,
N.Y. 11788
|
common
stock
|
851,085 | (1)(3)(4) | 8.44 | % | |||||
|
Laura
Aupperle
|
||||||||||
|
23
Sequoia Drive
|
||||||||||
|
Hauppauge,
N.Y. 11788
|
common
stock
|
705,892 | (2) | 7.00 | % | |||||
|
Dorothy
Plotkin
|
||||||||||
|
91
Cabot Court
|
||||||||||
|
Hauppauge,
N.Y. 11788
|
common
stock
|
551,660 | (1)(4) | 5.47 | % | |||||
|
John
Casey
|
||||||||||
|
91
Cabot Court
|
||||||||||
|
Hauppauge,
N.Y. 11788
|
common
stock
|
190,200 | (5) | 1.89 | % | |||||
|
Bernard
Herman
|
||||||||||
|
91
Cabot Court
|
||||||||||
|
Hauppauge,
N.Y. 11788
|
common
stock
|
68,994 | (6) | * | ||||||
|
Gerald
Tucciarone
|
||||||||||
|
91
Cabot Court
|
||||||||||
|
Hauppauge,
N.Y. 11788
|
common
stock
|
79,000 | (7) | * | ||||||
|
Christopher
G. Payan
|
||||||||||
|
91
Cabot Court
|
||||||||||
|
Hauppauge,
N.Y.
|
common
stock
|
35,000 | (8) | * | ||||||
|
Seymour
G. Siegel
|
||||||||||
|
91
Cabot Court
|
||||||||||
|
Hauppauge,
N.Y.
|
common
stock
|
60,000 | (9) | * | ||||||
|
All
executive officers and
|
||||||||||
|
directors
as a group (6) persons
|
common
stock
|
1,284,279 | (1)(3)(4)(5)(6)(7)(8)(9) | 12.74 | % | |||||
* Denotes
less than 1% percent
|
(1)
|
Dorothy Plotkin, wife of Kenneth
Plotkin, beneficially owns 551,660 shares of our common stock or 5.47% of
the outstanding shares of common stock. Ownership of shares of
our common stock by Mr. Plotkin does not include ownership of shares of
our common stock by Mrs. Plotkin. Likewise, ownership of shares
of our common stock by Mrs. Plotkin does not include ownership of shares
of our common stock by Mr.
Plotkin.
|
|
(2)
|
To our knowledge, based upon
Schedule 13G filed under the Securities Exchange Act of 1934, as amended,
and other information that is publicly available, Laura Aupperle, the
widow of Kenneth R. Aupperle, beneficially owns 705,892 shares of our
common stock, or 7.00% of the outstanding shares of our common
stock.
|
|
(3)
|
Includes 185,000 shares of our
common stock issuable upon the exercise of incentive stock options which
are currently exercisable or exercisable within 60 days. Does
not include 90,000 shares of our common stock issuable upon the
exercise of incentive stock options which are currently
unexercisable or not exercisable within 60
days.
|
|
(4)
|
Does not include 18,000 shares of
our common stock owned by the Plotkins' adult daughter. Does not include
4,000 shares of our common stock owned by the Plotkins' adult
son. Each of Mr. and Mrs. Plotkin disclaim beneficial ownership
of all such 22,000 shares of our common
stock.
|
47
|
(5)
|
Includes 80,000 shares of our
common stock issuable upon the exercise of incentive stock options which
are currently exercisable or exercisable within 60 days. Does not include
21,500 shares of our common stock issuable upon the exercise of incentive
stock options which are currently unexercisable or not exercisable within
60 days.
|
|
(6)
|
Includes 60,000 shares of our
common stock issuable upon the exercise of non-qualified stock options
which are currently exercisable or exercisable within 60 days and 5,000
shares of common stock issued in lieu of options on November 26,
2008.
|
|
(7)
|
Includes 72,500 shares of our
common stock issuable upon the exercise of incentive stock options which
are currently exercisable or exercisable within 60 days. Does not include
30,500 shares of our common stock issuable upon the exercise of incentive
stock options which are currently unexercisable or not exercisable within
60 days.
|
|
(8)
|
Includes 35,000 shares of our
common stock issuable upon the exercise of non-qualified stock options
which are currently
exercisable.
|
|
(9)
|
Includes 55,000 shares of our
common stock issuable upon the exercise of non-qualified stock options
which are currently exercisable or exercisable within 60 days and 5,000
shares of common stock issued in lieu of options on November 26,
2008.
|
ITEM
13. CERTAIN RELATIONSHIPS AND RELATED TRANSACTIONS, AND
DIRECTOR INDEPENDENCE
We occupy
a facility located at 91 Cabot Court, Hauppauge, New York 11788 (the
“Premises”) and use it for our executive offices and for the testing, storage
and shipping of our products. In February 1990, Hauppauge Computer
Works, Inc., one of our wholly-owned subsidiaries (“HCW”) entered into a lease
for said Premises with Ladokk Realty Co. (together with its
successor, Ladokk Realty Co., LLC, “Ladokk”), a real estate partnership
principally owned by Mr. Plotkin, the holder of approximately 8.44% of our
shares of common as of December 28, 2010; Mrs. Plotkin,
the holder of approximately 5.47% of shares of our common stock as
of December 28, 2010; and Ms. Aupperle, believed by us to be the
holder of approximately 7.00% of shares of our common stock as
of December 28, 2010.
The
current lease for the Premises commenced as of September 1, 2006 and ends on
August 31, 2011. The current rent is $337,656 per annum,
payable monthly, and is subject to an annual increase of 3% during the
term. The execution of the current lease was approved by our Board of
Directors, following the recommendation of our Audit Committee. Under
the current lease HCW is obligated to pay for utilities, repairs to the
premises, and taxes during the term.
HCW has
the option to renew the current lease for an additional 5-year term, upon
written notice to Ladokk six to twelve months prior to expiration of said
lease. Rent that is due during the first year of the renewal term
shall be equal to the market rate at the end of the current lease, but not less
than the rent paid during the last year of the current lease, and is subject to
increases for the second through fifth years of the renewal term by CPI plus 1%
per annum.
The
Company did not have any unpaid rent to this related party as of September 30,
2010. Rent expense to related parties totaled approximately
$329,979 and $318,270 for the fiscal years ended September 30, 2010 and
2009, respectively.
Director
Independence
Board
of Directors
Our Board
of Directors is currently comprised of Messrs. Kenneth Plotkin, Bernard
Herman, Christopher G. Payan and Seymour G. Siegel. Each
of Messrs. Herman, Payan and Siegel is currently an “independent director” based
on the definition of independence in Rule 5605(a)(2) of the listing
standards of The Nasdaq Stock Market.
48
Audit
Committee
The Audit
Committee of the Board of Directors is responsible for (i) recommending
independent registered public accountants to the Board, (ii) reviewing our
financial statements with management and the independent registered public
accountants, (iii) making an appraisal of our audit effort and the effectiveness
of our financial policies and practices and (iv) consulting with management and
our independent registered public accountants with regard to the adequacy of
internal accounting controls. The members of the Audit Committee
currently are Messrs. Herman, Payan and Siegel, each of whom is an "independent"
director based on the definition of independence in Rule 5605(a)(2) of the
listing standards of The Nasdaq Stock Market.
Nominating
Committee
The
purpose of the Nominating Committee of the Board of Directors is to assist the
Board of Directors in identifying and recruiting qualified individuals to become
Board members and select director nominees to be presented for Board and/or
stockholder approval. The members of the Nominating Committee
currently are Messrs. Herman, Payan and Siegel, each of whom is an "independent"
director based on the definition of independence in Rule 5605(a)(2) of the
listing standards of The Nasdaq Stock Market.
Compensation
Committee
The
Compensation Committee of the Board of Directors is responsible for providing
assistance to the Board of Directors in discharging the Board of Directors'
responsibilities relating to management organization, performance, compensation
and succession, including considering and authorizing the compensation
philosophy for the Company's personnel; making recommendations to the Board of
Directors with respect to the Company's employee benefit plans; administering
the Company's incentive, deferred compensation and equity based plans; reviewing
and approving corporate goals and objectives relevant to chief executive officer
and senior management compensation, evaluating chief executive officer and
senior management performance in light of those goals and objectives and, either
as a committee or together with other independent directors (as directed by the
Board of Directors), determining and approving chief executive officer and
senior management compensation based on this evaluation; and annually reviewing
and approving perquisites for the chief executive officer and senior
management.
The
members of the Compensation Committee currently are Messrs. Herman, Payan and
Siegel , each of whom is an "independent" director based on the definition of
independence in Rule 5605(a)(2) of the listing standards of The Nasdaq Stock
Market.
ITEM
14. PRINCIPAL ACCOUNTANT FEES AND SERVICES
The
following is a summary of the fees billed to us by BDO USA, LLP, our principal
independent registered public accountants, for professional services rendered
for the fiscal years ended September 30, 2010 and September 30, 2009,
respectively:
|
Fee Category
|
Fiscal 2010 Fees
|
Fiscal 2009 Fees
|
||||||
|
Audit
Fees (1)
|
$ | 181,000 | $ | 177,000 | ||||
|
Audit-Related
Fees (2)
|
- | 125,000 | ||||||
|
Tax
Fees (3)
|
18,000 | 23,000 | ||||||
|
All
Other Fees
|
- | - | ||||||
|
Total
Fees
|
$ | 199,000 | $ | 325,000 | ||||
|
(1)
|
Audit
Fees consist of aggregate fees billed for professional services rendered
for the audit of our annual financial statements and review of the interim
financial statements included in quarterly reports or services that are
normally provided by the independent registered public accountants in
connection with statutory and regulatory filings
(including Form S-8) or engagements for the fiscal years
ended September 30, 2010 and September 30, 2009,
respectively.
|
49
|
(2)
|
Audit-related
fees consist of $106,000 in aggregate fees billed for professional
services rendered for the audit of the PCTV business of Avid Technology,
Inc., which the Company acquired on December 24, 2008, $6,000
in aggregate fees billed for professional services rendered pertaining to
a comment letter from the Securities and Exchange Commission and $13,000
in aggregate fees billed for professional services rendered for a VAT
tax matter related to our Ireland
branch
|
|
(3)
|
Tax
fees consist of aggregate fees billed for tax compliance and tax
preparation for our federal and state tax filings. These fees
are related to the preparation of our federal and state tax
returns.
|
The Audit
Committee is responsible for the appointment, compensation and oversight of the
work of the independent registered public accountants and approves in
advance any services to be performed by the independent registered public
accountants, whether audit-related or not. The Audit Committee
reviews each proposed engagement to determine whether the provision of services
is compatible with maintaining the independence of the independent registered
public accountants. All of the fees shown above were pre-approved by
the Audit Committee.
50
PART IV
ITEM
15. EXHIBITS AND FINANCIAL STATEMENT SCHEDULES
(a)(1) Financial
Statements
The
following documents are included in Item 8 of this Annual Report on Form
10-K:
|
Page
|
||
|
Report
of Independent Registered Public Accounting Firm
|
F-2
|
|
|
Consolidated
Balance Sheets as of September 30, 2010 and 2009
|
F-3
|
|
|
Consolidated
Statements of Operations
|
||
|
for
the years ended September 30, 2010 and 2009
|
F-4
|
|
|
Consolidated
Statements of Other Comprehensive Loss
|
||
|
for
the years ended September 30, 2010 and 2009
|
F-5
|
|
|
Consolidated
Statements of Stockholders’ Equity for the years
|
||
|
ended
September 30, 2010 and 2009
|
F-6
|
|
|
Consolidated
Statements of Cash Flows for the
|
||
|
years
ended September 30, 2010 and 2009
|
F-7
|
|
|
Notes
to Consolidated Financial Statements
|
F-8
to
F23
|
(a)(2) Financial
Statement Schedules-N/A
(a)(3) Exhibits.
Exhibit
|
Number
|
Description
of Exhibit
|
|
2.1
|
Asset
Purchase Agreement, dated October 25, 2008, by and among Avid Technology,
Inc., Pinnacle Systems, Inc., Avid Technology GMBH, Avid Development GMBH,
Avid Technology International BV, and PCTV Corp.
(13)
|
|
2.1.1
|
Buyer
Parent Guaranty, dated October 25, 2008, by Hauppauge Digital
Inc. to and for the benefit of Avid Technology, Inc., Pinnacle Systems,
Inc., Avid Technology GMBH, Avid Development GMBH, and Avid Technology
International BV (13)
|
|
2.1.2
|
Amendment
No. 1 to Asset Purchase Agreement, dated December 24, 2008, by and among
Avid Technology, Inc., Pinnacle Systems, Inc., Avid Technology GMBH, Avid
Development GMBH, Avid Technology International BV, and PCTV Corp.
(17)
|
|
2.1.3
|
Secured
Promissory Note, dated December 24, 2008, made by PCTV Systems Sarl in
favor of Avid Technology, Inc. (17)
|
|
2.1.4
|
Transition
Services Agreement, dated December 24, 2008, by and among Hauppauge
Digital Europe Sarl, PCTV Systems Sarl, Hauppauge Computer Works, Inc.,
Avid Technology, Inc., Pinnacle Systems, Inc., Avid Technology GMBH, Avid
Development GMBH, and Avid Technology International BV.
(17)
|
|
2.1.5
|
Inventory
and Product Return Agreement, dated December 24, 2008, by and among Avid
Technology, Inc., Avid Technology International BV, Hauppauge Computer
Works, Inc. and Hauppauge Digital Europe Sarl
(17)
|
|
2.1.6
|
Intellectual
Property License Agreement, dated December 24, 2008, by and among Avid
Technology, Inc., Pinnacle Systems, Inc. and PCTV Systems Sarl
(17)
|
|
2.1.7
|
Audited
financial statements of the PCTV Business of Avid Technology, Inc. as of
September 30, 2008 and December 31, 2007 and un-audited pro
forma financial statement of operations of Hauppauge Digital Inc. and the
PCTV Business of Avid Technology, Inc. for the year
ended September 30,
2008. (18)
|
|
3.1
|
Certificate
of Incorporation (1)
|
51
|
3.1.1
|
Certificate
of Amendment of the Certificate of Incorporation, dated July 14, 2000
(15)
|
|
3.2
|
By-laws,
as amended to date (2)
|
|
4.1
|
Form
of Common Stock Certificate (1)
|
|
4.2
|
1994
Incentive Stock Option Plan (1)
|
|
4.3
|
1996
Non-Qualified Stock Option Plan (7)
|
|
4.4
|
1998
Incentive Stock Option Plan (7)
|
|
4.5
|
2000
Hauppauge Digital Inc. Performance and Equity Incentive Plan
(3)
|
|
4.6
|
Hauppauge
Digital Inc. Employee Stock Purchase Plan
(4)
|
|
4.7
|
Stockholder
Rights Agreement (5)
|
|
4.8
|
2003
Hauppauge Digital Inc. Performance and Equity Incentive Plan
(6)
|
|
4.9
|
Amendment
to 2003 Hauppauge Digital Inc. Performance and Equity Incentive Plan
(12)
|
|
4.10
|
Amendment
to the Hauppauge Digital Inc. Employee Stock Purchase Plan
(4)
|
|
4.11
|
Second
Amendment to the Hauppauge Digital Inc. Employee Stock Purchase Plan
(4)
|
|
4.12
|
Third
Amendment to the Hauppauge Digital Inc. Employee Stock Purchase Plan
(12)
|
|
10.1
|
Employment
Agreement, dated as of January 10, 1998, by and between Hauppauge Digital
Inc. and Kenneth Plotkin (7)
|
|
10.1.1
|
Amendment
to Employment Agreement with Kenneth Plotkin, dated April 10, 2008
(16)
|
|
10.2
|
Lease,
dated February 7, 1990, between Ladokk Realty Company and Hauppauge
Computer Works, Inc. (1)
|
|
10.2.1
|
Modification
made February 1, 1996 to lease dated February 7, 1990 between
Ladokk Realty Company and Hauppauge Computer Works,
Inc. (7)
|
|
10.2.2
|
Lease,
dated February 17, 2004, between Ladokk Realty Co., LLC and Hauppauge
Computer Works, Inc. (8)
|
|
10.2.3
|
Amendment
dated October 17, 2006 to lease dated February 17, 2004, between Ladokk
Realty Co., LLC and Hauppauge Computer Works,
Inc. (9)
|
|
10.3
|
Fourth
Amended and Restated Promissory Note, dated as of December 2, 2008, made
payable by Hauppauge Computer Works, Inc. to the order of JP Morgan Chase
Bank, N.A. in the original principal amount of Seven Hundred Thousand
($700,000) Dollars. (14)
|
|
10.3.1
|
Guaranty,
dated as of December 1, 2005, by Hauppauge Digital Inc.
in favor of JPMorgan Chase Bank, N.A.
(11)
|
|
10.3.2
|
Share
Pledge Agreement, dated as of December 1, 2005, among
Hauppauge Digital Inc., JPMorgan Chase Bank, N.A. and Hauppauge
Digital Europe Sarl (11)
|
|
10.3.3
|
Pledge
Security Agreement, dated as of December 2, 2008, by Hauppauge Computer
Works, Inc. and JP Morgan Chase Bank, N.A.
(14)
|
|
14
|
Code
of Ethics, as amended to date (10)
|
|
21
|
Subsidiaries
|
|
23
|
Consent
of BDO USA, LLP
|
|
31.1
|
Certification
of Chief Executive Officer pursuant to Rule 13a-14(a) or Rule 15d-14(a) as
adopted pursuant to Section 302 of the Sarbanes-Oxley Act of
2002
|
|
31.2
|
Certification
of the Chief Financial Officer pursuant to Rule 13a-14(a) or Rule
15d-14(a) as adopted pursuant to Section 302 of the Sarbanes-Oxley Act of
2002
|
|
32
|
Certification
of Chief Executive Officer and Chief Financial Officer pursuant to 18
U.S.C. Section 1350, as adopted pursuant to Section 906 of the
Sarbanes-Oxley Act of 2002
|
|
(1)
|
Denotes
document filed as an Exhibit to our Registration Statement on Form SB-2
(No. 33-85426), as amended, effective January 10, 1995 and incorporated
herein by reference.
|
|
(2)
|
Denotes
document filed as an Exhibit to our Form 8-K dated December 26, 2007 and
incorporated herein by reference.
|
|
(3)
|
Denotes
document filed as an Exhibit to our Registration Statement on Form S-8
(No. 333-46906), and incorporated herein by
reference.
|
|
(4)
|
Denotes
document filed as an Exhibit to our Registration Statement on Form S-8
(No. 333-46910), and as an annex to our Proxy Statement on Schedule 14A
dated September 18, 2006 and incorporated herein by
reference.
|
|
(5)
|
Denotes
document filed as an Exhibit to our Form 8-K dated July 20, 2001 (File
Number 001-13550, Film Number 1685278) and as an Exhibit to the our
Registration Statement on Form 8-A12G and incorporated herein by
reference.
|
|
(6)
|
Denotes
document filed as an Exhibit to our Registration Statement on Form S-8
(No. 333-109065), and as an annex to our Proxy Statement on Schedule 14A
dated September 18, 2006 and incorporated herein by
reference.
|
|
(7)
|
Denotes
document filed as an Exhibit to our Form 10-K for the period ended
September 30, 2003 (File Number: 001-13550, Film Number: 031073457) and
incorporated herein by
reference.
|
52
|
(8)
|
Denotes
document filed as an Exhibit to our Form 10-Q for the period ended March
31, 2004 (File Number: 001-13550, Film Number: 04809252) and incorporated
herein by reference.
|
|
(9)
|
Denotes
document filed as an Exhibit to our Form 8-K dated October 17, 2006 and
incorporated herein by reference.
|
|
(10)
|
Denotes
document filed as an Exhibit to our Form 8-K dated August 23, 2004 (File
Number: 001-13550, Film Number: 04995501) and incorporated herein by
reference.
|
|
(11)
|
Denotes
document filed as an Exhibit to our Form 8-K dated December 6, 2005 and
incorporated herein by reference.
|
|
(12)
|
Denotes
document filed as an Exhibit to our Form 8-K dated October 17, 2006 and
incorporated herein by reference.
|
|
(13)
|
Denotes
document filed as an Exhibit to our Form 8-K dated October 25, 2008 and
incorporated herein by reference.
|
|
(14)
|
Denotes
document filed as an Exhibit to our Form 8-K dated December 12, 2008 and
incorporated herein by reference.
|
|
(15)
|
Denotes
document filed as an Exhibit to our Form 10-K for the period ended
September 30, 2006, and incorporated herein by
reference.
|
|
(16)
|
Denotes
document filed as an Exhibit to our Form 8-K dated April 10, 2008, and
incorporated herein by reference.
|
|
(17)
|
Denotes
document filed as an Exhibit to our Form 8-K dated December 24, 2008, and
incorporated herein by reference.
|
|
(18)
|
Denotes
document filed as an Exhibit to our Form 8-K-A dated March 9, 2009, and
incorporated herein by reference.
|
53
INDEX
TO CONSOLIDATED FINANCIAL STATEMENTS
|
Page(s)
|
||
|
Report
of Independent Registered Public Accounting
Firm
|
F-2
|
|
|
Consolidated
Balance Sheets as of September 30, 2010 and 2009
|
F-3
|
|
|
Consolidated
Statements of Operations
|
||
|
for
the years ended September 30, 2010 and 2009
|
F-4
|
|
|
Consolidated
Statements of Other Comprehensive Loss
|
||
|
for
the years ended September 30, 2010
and 2009
|
F-5
|
|
|
Consolidated
Statements of Stockholders’ Equity for the years ended
|
||
|
September
30, 2010 and 2009
|
F-6
|
|
|
Consolidated
Statements of Cash Flows for the years ended
|
||
|
September
30, 2010 and 2009
|
F-7
|
|
|
Notes
to Consolidated Financial Statements
|
F-8
to
F-23
|
F-1
Report
of Independent Registered Public Accounting Firm
To the
Board of Directors and Stockholders of
Hauppauge
Digital Inc. and Subsidiaries
Hauppauge,
New York
We have
audited the accompanying consolidated balance sheets of Hauppauge Digital Inc.
and Subsidiaries as of September 30, 2010 and 2009 and the related consolidated
statements of operations, other comprehensive loss, stockholders' equity and
cash flows for the years then ended. These financial
statements are the responsibility of the management of Hauppauge Digital Inc.
Our responsibility is to express an opinion on these financial statements based
on our audits.
We
conducted our audits in accordance with the standards of the Public Company
Accounting Oversight Board (United States). Those standards require that we plan
and perform the audit to obtain reasonable assurance about whether the financial
statements are free of material misstatement. The Company is not
required to have, nor were we engaged to perform, an audit of its internal
control over financial reporting. Our audits included consideration of internal
control over financial reporting as a basis for designing audit procedures that
are appropriate in the circumstances, but not for the purpose of expressing an
opinion on the effectiveness of the Company’s internal control over financial
reporting. Accordingly, we express no such opinion. An audit also includes
examining, on a test basis, evidence supporting the amounts and disclosures in
the financial statements, assessing the accounting principles
used and significant estimates made by management, as well as evaluating the
overall presentation of the financial statements. We believe that our
audits provide a reasonable basis for our opinion.
In our
opinion, the consolidated financial statements referred to above present fairly,
in all material respects, the financial position of Hauppauge Digital Inc. and
Subsidiaries at September 30, 2010 and 2009 and the results of their operations
and their cash flows for the years then ended in conformity with
accounting principles generally accepted in the United States of
America.
|
/s/ BDO USA, LLP
|
|
|
BDO
USA, LLP
|
|
Melville,
New York
December
29, 2010
F-2
HAUPPAUGE
DIGITAL INC. AND SUBSIDIARIES
CONSOLIDATED
BALANCE SHEETS
|
September 30,
|
September 30,
|
|||||||
|
2010
|
2009
|
|||||||
|
ASSETS
|
||||||||
|
Current
Assets:
|
||||||||
|
Cash
and cash equivalents
|
$ | 7,057,904 | $ | 8,368,342 | ||||
|
Accounts
receivable, net of various allowances
|
4,403,194 | 9,770,584 | ||||||
|
Other
non trade receivables
|
2,355,834 | 4,116,392 | ||||||
|
Inventories
|
11,450,565 | 8,616,800 | ||||||
|
Deferred
tax asset-current
|
1,310,204 | 1,297,574 | ||||||
|
Prepaid
expenses and other current assets
|
980,087 | 928,680 | ||||||
|
Total
current assets
|
27,557,788 | 33,098,372 | ||||||
|
Intangible
assets, net
|
3,941,266 | 4,696,102 | ||||||
|
Property,
plant and equipment, net
|
544,959 | 757,488 | ||||||
|
Security
deposits and other non-current assets
|
106,241 | 108,088 | ||||||
|
Deferred
tax asset-non current
|
610,734 | 887,611 | ||||||
|
Total
assets
|
$ | 32,760,988 | $ | 39,547,661 | ||||
|
LIABILITIES
AND STOCKHOLDERS' EQUITY :
|
||||||||
|
Current
Liabilities:
|
||||||||
|
Accounts
payable
|
$ | 7,306,221 | $ | 12,478,625 | ||||
|
Accrued
expenses – fees
|
4,955,540 | 5,935,606 | ||||||
|
Accrued
expenses
|
10,266,495 | 7,949,203 | ||||||
|
Note
payable
|
0 | 625,045 | ||||||
|
Income
taxes payable
|
252,090 | 224,316 | ||||||
|
Total
current liabilities
|
22,780,346 | 27,212,795 | ||||||
|
Commitments
and contingencies
|
||||||||
|
Stockholders'
Equity
|
||||||||
|
Common
stock $.01 par value; 25,000,000 shares authorized,
|
||||||||
|
10,842,274
and 10,814,042 issued, respectively
|
108,423 | 108,140 | ||||||
|
Additional
paid-in capital
|
17,739,330 | 17,276,651 | ||||||
|
Retained
earnings (deficit)
|
(1,050,886 | ) | 795,674 | |||||
|
Accumulated
other comprehensive loss
|
(4,410,677 | ) | (3,441,262 | ) | ||||
|
Treasury
Stock at cost, 760,479 and 759,579 shares, respectively
|
(2,405,548 | ) | (2,404,337 | ) | ||||
|
Total
stockholders' equity
|
9,980,642 | 12,334,866 | ||||||
|
Total
liabilities and stockholders’ equity
|
$ | 32,760,988 | $ | 39,547,661 | ||||
See accompanying
notes to consolidated financial statements
F-3
HAUPPAUGE
DIGITAL INC. AND SUBSIDIARIES
CONSOLIDATED
STATEMENTS OF OPERATIONS
|
Years ended September 30,
|
||||||||
|
2010
|
2009
|
|||||||
|
Net
sales
|
$ | 56,918,617 | $ | 59,344,538 | ||||
|
Cost
of sales
|
38,486,848 | 46,557,904 | ||||||
|
Gross
profit
|
18,431,769 | 12,786,634 | ||||||
|
Selling,
general and administrative expenses
|
15,579,080 | 16,117,590 | ||||||
|
Research
and development expenses
|
4,458,915 | 4,421,935 | ||||||
|
Loss
from operations
|
(1,606,226 | ) | (7,752,891 | ) | ||||
|
Other
Income:
|
||||||||
|
Interest
income
|
5,373 | 14,217 | ||||||
|
Interest
expense
|
(4,340 | ) | (62,557 | ) | ||||
|
Foreign
currency
|
227,902 | 670,760 | ||||||
|
Total
other income
|
228,935 | 622,420 | ||||||
|
Loss
before tax provision
|
(1,377,291 | ) | (7,130,471 | ) | ||||
|
Deferred
tax expense (benefit)
|
264,247 | (164,501 | ) | |||||
|
Current
income tax expense
|
205,022 | 177,051 | ||||||
|
Net
loss
|
$ | (1,846,560 | ) | $ | (7,143,021 | ) | ||
|
Net
loss per share:
|
||||||||
|
Basic
and Diluted
|
$ | (0.18 | ) | $ | (0.71 | ) | ||
See
accompanying notes to consolidated financial statements
F-4
HAUPPAUGE
DIGITAL INC. AND SUBSIDIARIES
CONSOLIDATED
STATEMENTS OF OTHER COMPREHENSIVE LOSS
|
Years ended September 30,
|
||||||||
|
Other
comprehensive loss :
|
2010
|
2009
|
||||||
|
Net
loss
|
$ | (1,846,560 | ) | $ | (7,143,021 | ) | ||
|
Forward
exchange contracts marked to market
|
- | 16,545 | ||||||
|
Foreign
currency translation loss
|
(969,415 | ) | (94,937 | ) | ||||
|
Other
comprehensive loss
|
$ | (2,815,975 | ) | $ | (7,221,413 | ) | ||
See
accompanying notes to consolidated financial statements
F-5
HAUPPAUGE
DIGITAL INC. AND SUBSIDIARIES
CONSOLIDATED
STATEMENTS OF STOCKHOLDERS’ EQUITY
FOR THE
YEARS ENDED SEPTEMBER 30, 2010 AND 2009
|
Common Stock
|
Accumulated
|
|||||||||||||||||||||||||||
|
Number
|
Additional
|
Retained
|
Other
|
|||||||||||||||||||||||||
|
Of
|
Paid-in
|
Earnings
|
Comprehensive
|
Treasury
|
||||||||||||||||||||||||
|
Shares
|
Amount
|
Capital
|
(Deficit)
|
Income (Loss)
|
Stock
|
Total
|
||||||||||||||||||||||
|
BALANCE
AT SEPTEMBER 30, 2008
|
10,784,717 | $ | 107,847 | $ | 16,709,201 | $ | 7,938,695 | $ | (3,362,870 | ) | $ | (2,404,337 | ) | $ | 18,988,536 | |||||||||||||
|
Net
loss for the year ended September 30, 2009
|
- | - | - | (7,143,021 | ) | - | - | (7,143,021 | ) | |||||||||||||||||||
|
Stock
compensation
|
- | - | 538,685 | - | - | - | 538,685 | |||||||||||||||||||||
|
Foreign
currency translation loss
|
- | - | - | - | (94,937 | ) | - | (94,937 | ) | |||||||||||||||||||
|
Change
in fair value of forward contracts
|
- | - | - | - | 16,545 | - | 16,545 | |||||||||||||||||||||
|
Stock
issued through Employee Stock Purchase plan
|
29,325 | 293 | 28,765 | - | - | - | 29,058 | |||||||||||||||||||||
|
BALANCE
AT SEPTEMBER 30, 2009
|
10,814,042 | $ | 108,140 | $ | 17,276,651 | $ | 795,674 | $ | (3,441,262 | ) | $ | (2,404,337 | ) | $ | 12,334,866 | |||||||||||||
|
Net
loss for the year ended September 30, 2010
|
- | - | - | (1,846,560 | ) | - | - | (1,846,560 | ) | |||||||||||||||||||
|
Stock
compensation
|
- | - | 435,133 | - | - | - | 435,133 | |||||||||||||||||||||
|
Purchase
of treasury stock
|
- | - | - | - | (1,211 | ) | (1,211 | ) | ||||||||||||||||||||
|
Exercise
of stock options
|
13,625 | 136 | 16,023 | - | - | - | 16,159 | |||||||||||||||||||||
|
Foreign
currency translation loss
|
- | - | - | - | (969,415 | ) | - | (969,415 | ) | |||||||||||||||||||
|
Stock
issued through Employee Stock Purchase plan
|
14,607 | 147 | 11,523 | - | - | - | 11,670 | |||||||||||||||||||||
|
BALANCE
AT SEPTEMBER 30, 2010
|
10,842,274 | $ | 108,423 | $ | 17,739,330 | $ | (1,050,886 | ) | $ | (4,410,677 | ) | $ | (2,405,548 | ) | $ | 9,980,642 | ||||||||||||
See
accompanying notes to consolidated financial statements
F-6
HAUPPAUGE
DIGITAL INC. AND SUBSIDIARIES
CONSOLIDATED
STATEMENTS OF CASH FLOWS
|
Years
ended September 30,
|
||||||||
|
2010
|
2009
|
|||||||
|
Cash
Flows From Operating Activities:
|
||||||||
|
Net
loss
|
$ | (1,846,560 | ) | $ | (7,143,021 | ) | ||
|
Adjustments
to reconcile net loss to net cash
|
||||||||
|
provided
by (used in) operating activities:
|
||||||||
|
Depreciation
|
271,455 | 280,610 | ||||||
|
Amortization
of intangible assets
|
754,836 | 566,127 | ||||||
|
Inventory
reserve
|
290,000 | 360,000 | ||||||
|
Bad
debt expense
|
70,000 | 35,000 | ||||||
|
Sales
reserve-net
|
259,240 | 135,537 | ||||||
|
Stock
compensation expense-employees
|
435,133 | 538,685 | ||||||
|
Deferred
tax expense (benefit)
|
264,247 | (164,500 | ) | |||||
|
Other
non cash items
|
1,847 | (5,820 | ) | |||||
|
Changes
in current assets and liabilities:
|
||||||||
|
Accounts
receivable and other non trade receivables
|
5,360,314 | (5,219,333 | ) | |||||
|
Inventories
|
(2,346,246 | ) | 3,669,643 | |||||
|
Prepaid
expenses and other current assets
|
(73,461 | ) | 164,726 | |||||
|
Accounts
payable
|
(5,079,294 | ) | 1,978,439 | |||||
|
Accrued
expenses and income taxes
|
1,353,175 | 3,577,766 | ||||||
|
Total
adjustments
|
1,561,246 | 5,916,880 | ||||||
|
Net
cash used in operating activities
|
(285,314 | ) | (1,226,141 | ) | ||||
|
Cash
Flows From Investing Activities:
|
||||||||
|
Purchase
of PCTV assets
|
(511,332 | ) | (4,506,225 | ) | ||||
|
Purchases
of property, plant and equipment
|
(62,792 | ) | (41,679 | ) | ||||
|
Net
cash used in investing activities
|
(574,124 | ) | (4,547,904 | ) | ||||
|
Cash
Flows From Financing Activities:
|
||||||||
|
Proceeds
from employee stock purchases
|
27,829 | 29,058 | ||||||
|
Purchase
of treasury stock
|
(1,211 | ) | - | |||||
|
Net
cash provided by financing activities
|
26,618 | 29,058 | ||||||
|
Effect
of exchange rates on cash
|
(477,618 | ) | (78,392 | ) | ||||
|
Net
decrease in cash and cash equivalents
|
(1,310,438 | ) | (5,823,379 | ) | ||||
|
Cash
and cash equivalents, beginning of year
|
8,368,342 | 14,191,721 | ||||||
|
Cash
and cash equivalents, end of year
|
$ | 7,057,904 | $ | 8,368,342 | ||||
|
Supplemental
disclosures:
|
||||||||
|
Interest
paid
|
$ | 4,340 | $ | 62,557 | ||||
|
Income
taxes paid
|
$ | 163,091 | $ | 60,880 | ||||
|
Note
payable to Avid Technology, Inc.
|
- | $ | 2,500,000 | |||||
See
accompanying notes to consolidated financial statements
F-7
1.
Summary of Significant Accounting Policies
Principles
of Consolidation
The
consolidated financial statements include the accounts of Hauppauge Digital Inc.
(the “Company”) and its wholly-owned subsidiaries, Hauppauge Computer Works,
Inc., HCW Distributing Corp., Hauppauge Digital Inc. Taiwan, PCTV Systems Sarl,
its branch PCTV Systems GmbH, Hauppauge Digital Europe Sarl, its branch
Hauppauge Digital Europe Sarl Ireland and Hauppauge Digital Europe Sarl’s
wholly-owned subsidiaries, Hauppauge Digital Asia Pte Ltd, Hauppauge Computer
Works, GmbH, Hauppauge Computer Works, Ltd. and Hauppauge Computer Works Sarl.
All inter-company accounts and transactions have been eliminated.
Nature
of Business
Hauppauge
Digital Inc. is a developer of analog and digital TV tuner products for the
personal computer market. Through its Hauppauge Computer Works, Inc., Hauppauge
Digital Europe Sarl and PCTV subsidiaries, the Company designs, develops,
manufactures and markets analog, digital and other types of TV tuners that allow
PC users to watch television on a PC screen in a resizable window, and enables
the recording of TV shows to a PCs hard disk, digital video editing, video
conferencing, and the display of digital media stored on a computer to a TV set
via a home network. The Company, incorporated in Delaware in August 1994, is
headquartered in Hauppauge, New York. The Company has administrative offices in
Luxembourg, Ireland and Singapore and sales offices in Germany, London, Paris,
The Netherlands, Sweden, Italy, Spain, Singapore, Taiwan and California and
research and development centers in Hauppauge, New York, Braunschweig, Germany
and Taiwan.
.
The
Company’s products fall under three product categories:
|
|
·
|
Analog
TV tuners
|
|
|
·
|
Digital
TV tuners, and combination analog and digital TV
tuners
|
|
|
·
|
Other
non TV tuner products
|
The
Company’s analog and digital TV tuner products enable, among other things, a PC
user to watch TV in a resizable window on a PC.
The
Company’s other non TV tuner products enable, among other things, a PC user to
video conference, watch and listen to PC based videos, music and pictures on a
TV set through a home network, and record TV shows on a PC for playback on
portable video players.
Product
Segment and Geographic Information
The
Company operates in one business segment, which is the development, marketing
and manufacturing of analog and digital TV tuner products for the personal
computer market. The products are similar in function and share commonality of
component parts and manufacturing processes. The Company’s products are either
sold, or can be sold, by the same retailers and distributors in the Company’s
marketing channel. The Company also sells the Company’s TV tuner products
directly to PC manufacturers. The Company evaluates its product lines under the
functional categories of analog TV tuners, digital TV and combination digital
and analog TV tuners and other non TV tuner products. Sales by functional
category are as follows:
|
Twelve months ended September 30,
|
||||||||
|
2010
|
2009
|
|||||||
|
Product line sales
|
||||||||
|
Analog
sales
|
$ | 1,498,046 | $ | 1,829,752 | ||||
|
Digital
|
45,484,110 | 55,770,304 | ||||||
|
Other
non TV tuners products
|
9,936,461 | 1,744,482 | ||||||
|
Total
sales
|
$ | 56,918,617 | $ | 59,344,538 | ||||
The
Company sells its product through a domestic and international network of
distributors and retailers. Net sales to international and domestic customers
were approximately 54% and 46% and 52% and 48% of total sales for the years
ended September 30, 2010 and 2009, respectively.
F-8
Net sales
to customers by geographic location consist of:
|
Years ended September 30,
|
||||||||
|
Sales to:
|
2010
|
2009
|
||||||
|
The
Americas
|
46 | % | 48 | % | ||||
|
Northern
Europe
|
9 | % | 7 | % | ||||
|
Southern
Europe
|
15 | % | 17 | % | ||||
|
Central
and Eastern Europe
|
28 | % | 25 | % | ||||
|
Asia
|
2 | % | 3 | % | ||||
|
Total
|
100 | % | 100 | % | ||||
Net long
lived assets located in the United States, Europe and Asia locations were
approximately 54%, 39% and 7% of total net long lived assets, respectively, at
September 30, 2010, and 55%, 38% and 7%, respectively, at September 30,
2009.
Subsequent
Events
Management
has evaluated subsequent events after the balance sheet date through the
issuance of the financial statements for appropriate accounting and disclosure
through the filing date of our Form 10-K.
Use
of Estimates
In
preparing financial statements in conformity with accounting principles
generally accepted in the United
States of
America, management is required to make estimates and assumptions that affect
the reported amounts of assets and liabilities and the disclosure of contingent
assets and liabilities at the date of the financial statements and the reported
amounts of revenues and expenses during the reporting period. The Company
reviews all significant estimates affecting the financial statements on a
recurring basis and records the effect of any adjustments when
necessary.
Cash
and Cash Equivalents
For
purposes of the statement of cash flows, the Company considers all highly liquid
debt instruments purchased with an original maturity date of three months or
less to be cash equivalents.
Concentrations
of Credit Risk
Financial
instruments which potentially subject the Company to concentrations of credit
risk consist principally of cash and accounts receivable. At times such cash in
banks are in excess of the FDIC insurance limit. Concentration of credit risk
with respect to accounts receivable exists because the Company operates in one
industry (also see Note 10). Although the Company operates in one industry
segment, it does not believe that the Company has a material concentration of
credit risk either from an individual counter party or a group of counter
parties, due to the large and diverse user group for its products. The Company
performs ongoing credit evaluations of its customers and generally does not
require collateral. The Company maintains allowances to cover
potential or anticipated losses for uncollectible amounts.
Shipping
and Handling Costs
The
Company records all shipping and handling charges in Cost of Sales.
Revenue
Recognition
The
Company sells through a sales channel which is comprised of retailers, PC
manufacturers and distributors. The majority of the Company’s customers are
granted lines of credit. The product is shipped on account with the majority of
customers typically given 30 to 60 day payment terms. Those customers deemed as
large credit risks either pay in advance or issue the Company a letter of
credit.
F-9
The
Company requires the customer to submit a purchase order to the
Company. The product price and payment terms are fixed per the terms
of the purchase order. Upon shipment of the order to the customer,
the title to the goods is passed to the customer. The customer is legally
obligated to pay for the order within the payment terms stated on the customer’s
purchase order. The obligation to insure the boards and the cost of
any pilferage while in the customer’s possession is the responsibility of the
customer. The Company sells analog, hybrid video
recorders or digital computer boards that are stocked on the shelves
of retailers and are subject to the normal consumer
traffic that retail stores attract. Aside from normal store
promotions such as advertisements in the store’s circular, the
Company has no further obligation to assist in the resale of the
products.
The
Company offers some of its customers a right of return. The Company’s accounting
complies with FASB ASC 605-15 (SFAS 48) Revenue Recognition when
Right of Return Exists, as typically at the end of every quarter the Company,
based on historical data, evaluates its sales reserve level based on
the previous six months sales. Due to seasonal nature of
the business coupled with the changing economic environment, management
exercises some judgment with regard to the historical data when calculating the
reserve.
The
Company offers mail-in rebates on certain products at certain times as
determined by the Company. The rebates are recorded as a reduction to sales. The
Company also participates in limited cooperative advertising programs with retailers
and distributors and accounts for these in accordance with FASB ASC 605-50 (
EITF 01-09), “Accounting for Consideration Given by a Vendor to a Customer
(Including a Reseller of the Vendor’s Products)”.
Warranty
Policy
The
Company warrants that its products are free from defects in material and
workmanship for a period of one year from the date of initial retail purchase.
The warranty does not cover any losses or damage that occur as a result of
improper installation, misuse or neglect and repair or modification by anyone
other than the Company or its authorized repair agent. The Company accrues
anticipated warranty costs based upon historical percentages of items returned
for repair within one year of the initial sale. The Company’s repair
rate of product under warranty has been minimal and the warranty reserve has not
been material.
Inventories
Inventories
are valued at the lower of cost (principally average cost) or market. A reserve
has been provided to reduce obsolete and/or excess inventory to its net
realizable value.
Property,
Plant and Equipment
Depreciation
of office equipment and machinery and amortization of leasehold improvements is
provided for using both accelerated and straight line methods over the estimated
useful lives of the related assets as follows:
Office
Equipment and Machinery: 5 to 7 years
Leasehold
improvements: asset life or lease term, whichever is
shorter
Income
taxes
The
Company follows the liability method of accounting for income taxes. Deferred
income taxes are recorded to reflect the temporary differences in the tax bases
of the assets or liabilities and their reported amounts in the financial
statements. The Company recognizes deferred tax
assets and liabilities for the expected future tax consequences of events that
have been included in the Company’s financial statements or tax returns. Under
this method, deferred tax assets and liabilities are determined based on the
difference between the financial statement and tax basis of assets and
liabilities using enacted tax rates in effect for the year in which the
differences are expected to reverse. Valuation allowances are established when
necessary to reduce deferred tax assets to the amount currently estimated to be
realized. The Company adopted ASC 740-10 (Financial Accounting Standards Board
(“FASB”) Interpretation No. 48), “Accounting for Uncertainty in Income
Taxes — An Interpretation of FASB Statement No. 109” (“FIN 48”)
effective October 1, 2007. Under ASC740-10 ( FIN 48), tax
benefits are recognized only for tax positions that are more likely than not to
be sustained upon examination by tax authorities. The amount recognized is
measured as the largest amount of benefit that is greater than 50% likely to be
realized upon ultimate settlement. Unrecognized tax benefits are tax benefits
claimed in tax returns that do not meet these recognition and measurement
standards. As of September 30 2010 and 2009, the Company did not have any
uncertain tax positions, and the Company does not expect ASC 740-10
(FIN 48) to have a significant impact on its results of operations or
financial position during the next 12 months. As permitted by
ASC-740-10(FIN 48), the Company also adopted an accounting policy to
prospectively classify accrued interest and penalties related to any
unrecognized tax benefits in its income tax provision. Previously, the Company’s
policy was to classify interest and penalties as an interest expense in arriving
at pre-tax income.
F-10
Long-Lived
Assets
Long-lived
assets, such as property and equipment and intangible assets, are evaluated for
impairment when events or changes in circumstances indicate that the carrying
amount of the assets may not be recoverable through the estimated undiscounted
future cash flows from the use of these assets. When any such impairment exists,
the related assets will be written down to fair value. In accordance with ASC
360-10-35 (SFAS No. 144, “Accounting for Impairment or Disposal of
Long-Lived Assets” ASC 360-10-35 (“SFAS No. 144”), amortization of
intangible assets is provided using the straight-line method over the estimated
useful lives of the assets. Impairment indicators include, among
other conditions: cash flow deficits, a historic or anticipated decline in net
sales or operating profit, adverse legal or regulatory developments,
accumulation of costs significantly in excess of amounts originally expected to
acquire the asset, and a material decrease in the fair market value of some or
all of the assets. Assets are grouped at the lowest level for which there are
identifiable cash flows that are largely independent of the cash flows generated
by other asset groups.
Research
and Development
Expenditures
for research and development are charged to expense as incurred.
Foreign
Currency Translations and Transactions
The
Company’s Asian subsidiary reports its financial position and results of
operations in the reporting currency of the Company.
The
financial position and results of operations of the Company’s European
subsidiaries are determined using Euros as the functional
currency. Assets and liabilities of these subsidiaries are translated
at the exchange rate in effect at each period end. Income statement
accounts are translated at the average rate during the
year. Translation adjustments arising from the translation to
U.S. Dollars at differing exchange rates are included in the accumulated other
comprehensive income (loss) account in stockholders’ equity. Gains
and losses resulting from transactions that are denominated in
currencies other than Euros are included in earnings as a component of other
income. The Company had a translation loss of $3,441,262 recorded on
the balance sheet as of September 30, 2009. For the twelve months ended
September 30, 2010 the Company recorded on the balance sheet translation losses
of $969,415, resulting in an accumulated translation loss of $4,410,677 recorded
as a component of accumulated other comprehensive income as of September 30,
2010.
Derivatives
and Hedging Activities
For each
of the fiscal years ended September 30, 2010 and 2009, at least 40 % of the
Company’s sales were generated by its European subsidiary and were invoiced and
collected in local currency, which was primarily the Euro. On the supply side,
since the Company predominantly deals with North American and Asian suppliers
and contract manufacturers, approximately 95% of the Company’s inventory
required to support its European sales are purchased and paid in U.S. Dollars.
The combination of sales billed in Euros supported by inventory purchased in
U.S. dollars results in an absence of a natural local currency hedge.
Consequently, the Company’s financial results are subject to market risks
resulting from the fluctuations in the Euro to U.S. Dollar
exchange rates.
The
Company attempts to reduce these risks by entering into foreign exchange forward
contracts with financial institutions. The purpose of these forward contracts is
to hedge the foreign currency market exposures underlying the U.S. Dollar
denominated inventory purchases required to support its European
sales.
F-11
The
Company does not try to hedge against all possible foreign currency exposures
because of the inherent difficulty in estimating the volatility
of the Euro. The contracts the Company procures are specifically
entered into to as a hedge against forecasted or
existing foreign currency exposure. The Company does
not enter into contracts for speculative purposes. Although the Company
maintains these programs to reduce the short term impact of changes in currency
exchange rates, long term strengthening or weakening of the U.S.
Dollar against the Euro impacts the Company’s sales, gross
profit, operating income and retained earnings. Factors that could impact the
effectiveness of the Company’s hedging program are:
|
|
·
|
volatility
of the currency markets
|
|
|
·
|
availability
of hedging instruments
|
|
|
·
|
accuracy
of the Company’s inventory
forecasts
|
Additionally,
there is the risk that foreign exchange fluctuations will make the
Company’s products less competitive in foreign markets, which would
substantially reduce the Company’s sales.
As of
September 30, 2010 and 2009 the Company had no open contracts
outstanding.
The
Company’s accounting policies for these instruments designate such instruments
as cash flow hedging transactions. The Company does not enter into such
contracts for speculative purposes. The Company records all derivative gains and
losses on the balance sheet as a component of stockholders’ equity under the
caption “Accumulated other comprehensive loss,”.
Fair
Value of Financial Instruments
The
carrying amounts of certain financial instruments, including
cash, receivables and accounts payable, approximate fair value as of
September 30, 2010 and 2009 because of the relatively short term maturity of
these instruments. The Company believes that borrowings outstanding under its
note payable approximate fair value due to the short-term duration of the
loan.
Net
income (loss) per share
Basic net
income (loss) per share includes no dilution and is computed by dividing net
income (loss) by the weighted average number of shares of Common Stock
outstanding for the period. Diluted net income (loss) per share
reflect, in periods in which they have a dilutive effect, the dilution which
would occur upon the exercise of stock options. A
reconciliation of the shares used in calculating basic and diluted earnings
(loss) per share follows:
|
Years ended September 30,
|
||||||||
|
2010
|
2009
|
|||||||
|
Weighted
average Common Stock outstanding-basic
|
10,066,637 | 10,045,449 | ||||||
|
Common
Stock equivalents-stock options
|
- | - | ||||||
|
Weighted
average shares outstanding-diluted
|
10,066,637 | 10,045,449 | ||||||
Options
to purchase 1,454,442 and 1,522,394 shares of Common Stock at prices ranging
$1.05 to $7.45 and $1.08 to $8.75, respectively, were
outstanding as of September 30, 2010 and 2009, respectively, but were
not included in the computation of diluted net income per share of
Common Stock because they were anti-dilutive.
Stock
Based Compensation
The
Company follows FASB ASC-718 (SFAS No. 123R), “Share-Based
Payments” where the fair value of stock options are
determined using the Black-Scholes valuation model and such fair
value is recognized as an expense over the service period, net of estimated
forfeitures.
The
Company had as of September 30, 2010 options issued from four incentive option
plans and one non qualified option plan. These options typically vest over a
period of four to five years. Options granted have a contract term of
10 years and the fair value for these options was estimated at the
date of grant using a Black-Scholes option pricing model with the following
weighted average assumptions based on historical data of the Company’s
stock.
F-12
|
Stock option grant
assumptions:
|
2010
|
2009
|
||||||
|
Weighted
average fair value of grants
|
$ | 0.55 | $ | 0.70 | ||||
|
Risk
free interest rate
|
2.69 | % | 4.25 | % | ||||
|
Dividend
yield
|
- | - | ||||||
|
Expected
volatility
|
50 | % | 50 | % | ||||
|
Expected
life in years
|
7 | 7 | ||||||
As of
September 30, 2010, there was $501,671 of total unrecognized compensation
expense net of estimated forfeitures, related to non-vested share based
compensation arrangements which is expected to be recognized over a weighed
average period of 4 years. The total fair value of options vested during the
years ended September 30, 2010 and 2009 was $435,133 and
$538,685. For September 30, 2010 and 2009, stock compensation expense
of $278,549 and $347,069 have been recorded to SG&A expense and $156,584 and
$191,616 have been recorded to research and development expense.
In
recognition that stock compensation is a non-cash expense, the effect of
expensing options had no affect on the Company’s cash flow. However,
it was reflected in the Company’s cash flow statement as a non-cash item which
was added back in the determination of cash flows from operating
activities.
A summary
of the Company’s non-vested shares as of September 30, 2010 and changes during
the twelve months ended September 30, 2010 is presented below:
|
Weighted
|
||||||||
|
Grant
date
|
||||||||
|
Shares
|
Fair value
|
|||||||
|
Non-vested
as of October 1, 2009
|
465,000 | $ | 2.70 | |||||
|
Granted
|
195,250 | 0.55 | ||||||
|
Vested
|
(186,080 | ) | 2.34 | |||||
|
Forfeited
|
(84,524 | ) | 4.11 | |||||
|
Non-vested
as of September 30, 2010
|
389,646 | $ | 1.29 | |||||
Accrued
expenses- fees
The
Company uses technology licensed from third parties in certain
products. The Company enters into agreements to license this
technology, and in return for the use of the technology, the Company incurs a
license fee for each unit sold that includes the licensors’ technology. The
licensing amount per unit varies by licensor. The Company recognizes and
estimates the amount of fees owed to third parties based on products sold that
include software and technology purchased or licensed from these third
parties. The Company uses all available applicable information in
determining these estimates and thus the accrued amounts are subject to change
as new information is made available to the Company.
The
Company is obligated to provide the licensor with reports which quantify the
licenses used and in certain cases the Company is subject to periodic audits.
The licensing fees are accounted for as a component of product cost and are
charged to cost of sales.
Recent
Accounting Pronouncements
In
January 2010, the FASB issued an accounting standard update amending the
disclosure requirements for financial instruments under fair value. New
disclosures required include the amount of significant transfers in and out of
levels 1 and 2 fair value measurements and the reasons for the transfers. In
addition, the reconciliation for level 3 activity will be required on a gross
rather than net basis. The update provides additional guidance related to the
level of disaggregation in determining classes of assets and liabilities and
disclosures about inputs and valuation techniques. The Company does not expect
the adoption of this guidance to have a material impact on its consolidated
financial statements and disclosures.
F-13
In
September 2009, the FASB issued a standard which modifies the revenue
recognition guidance for arrangements that involve the delivery of multiple
elements, such as product, software, services or support, to a customer at
different times as part of a single revenue generating transaction. This
standard provides principles and application guidance to determine whether
multiple deliverables exist, how the individual deliverables should be separated
and how to allocate the revenue in the arrangement among those separate
deliverables. The standard also expands the disclosure requirements for multiple
deliverable revenue arrangements. The Company does not expect the adoption of
this guidance to have a material impact on its consolidated financial
statements.
Reclassifications
Certain
reclassifications have been made to the prior period consolidated financial
statements to conform to the current year presentation.
|
2.
|
Accounts
receivable
|
Receivables
consist of:
|
|
·
|
Trade
receivables from sales to customers
|
|
|
·
|
Receivables
pertaining to component parts purchased from the Company by its contract
manufacturers which are excluded from
sales
|
|
|
·
|
General
services tax (GST) and value added tax (VAT) reclaimable on
goods purchased by the Company’s Asian and European
locations
|
|
|
·
|
Allowances,
consisting of sales and bad debt
|
|
|
·
|
Other
minor non trade receivables
|
The
following is a listing by category of the Company’s accounts receivable as of
September 30, 2010 and 2009.
|
As
of September 30,
|
||||||||
|
Receivable detail:
|
2010
|
2009
|
||||||
|
Trade
receivables
|
$ | 9,123,726 | $ | 13,893,804 | ||||
|
Allowance
for doubtful accounts
|
(383,773 | ) | (823,220 | ) | ||||
|
Sales
reserve
|
(4,336,759 | ) | (3,300,000 | ) | ||||
|
Net
trade receivables
|
$ | 4,403,194 | $ | 9,770,584 | ||||
|
Receivable
from contract manufacturers
|
$ | 1,846,949 | $ | 2,933,918 | ||||
|
GST
and VAT taxes receivables
|
439,745 | 1,134,331 | ||||||
|
Other
|
69,140 | 48,143 | ||||||
|
Total
other non trade receivables
|
$ | 2,355,834 | $ | 4,116,392 | ||||
3. Inventories
Inventories consist of the
following:
|
September
30,
|
||||||||
|
2010
|
2009
|
|||||||
|
Component
Parts
|
$ | 3,565,643 | $ | 2,799,723 | ||||
|
Finished Goods
|
7,884,922 | 5,817,077 | ||||||
| $ | 11,450,565 | $ | 8,616,800 | |||||
4.
Property, Plant and Equipment
The
following is a summary of property, plant and equipment:
|
September
30,
|
||||||||
|
2010
|
2009
|
|||||||
|
Office
Equipment and Machinery
|
$ | 3,793,797 | $ | 3,780,398 | ||||
|
Leasehold
Improvements
|
150,870 | 115,870 | ||||||
| 3,944,667 | 3,896,268 | |||||||
|
Less:
Accumulated depreciation and amortization
|
(3,399,708 | ) | (3,138,780 | ) | ||||
| $ | 544,959 | $ | 757,488 | |||||
Depreciation
and amortization expense totaled $ 271,455 and $ 280,610 for the years ended
September 30, 2010 and 2009, respectively.
F-14
5.
Intangible Assets
The
following is a summary of intangible assets as of September 30, 2009 and
2010
|
Net
|
Weighted
|
|||||||||||||||
|
As of September 30, 2009
|
Purchase
|
Accumulated
|
Book
|
average remaining
|
||||||||||||
|
Asset description
|
cost
|
Amortization
|
Value
|
life (in years)
|
||||||||||||
|
Customer
relationships
|
$ | 1,644,353 | $ | (102,772 | ) | $ | 1,541,581 | 11.25 | ||||||||
|
Value
of technology
|
1,849,897 | (198,203 | ) | 1,651,694 | 6.25 | |||||||||||
|
Covenant not
to compete
|
1,767,979 | (265,152 | ) | 1,502,827 | 4.25 | |||||||||||
|
Total
intangible assets
|
$ | 5,262,229 | $ | (566,127 | ) | $ | 4,696,102 | 8.45 | ||||||||
|
Net
|
Weighted
|
|||||||||||||||
|
As of September 30, 2010
|
Purchase
|
Accumulated
|
Book
|
average remaining
|
||||||||||||
|
Asset description
|
cost
|
Amortization
|
Value
|
life (in years)
|
||||||||||||
|
Customer
relationships
|
$ | 1,644,353 | (239,801 | ) | $ | 1,404,552 | 10.25 | |||||||||
|
Value
of technology
|
1,849,897 | (462,474 | ) | 1,387,423 | 5.25 | |||||||||||
|
Covenant not
to compete
|
1,767,979 | (618,688 | ) | 1,149,291 | 3.25 | |||||||||||
|
Total
intangible assets
|
$ | 5,262,229 | $ | (1,320,963 | ) | $ | 3,941,266 | 7.64 | ||||||||
Amortization
expense totaled $754, 836 and $566,127 for the years ended September 30, 2010
and 2009. Amortization expense is expected to be approximately
$755,000 for each of the fiscal years ended September 30, 2011,
2012 and 2013 respectively, $490,000
for the fiscal year ended September 30, 2014 and $401,000
for the year ended September 30, 2015.
6. Accrued
Expenses –Fees
The
Company uses software and technology purchased or licensed from third parties in
certain of the Company’s products. The Company enters into agreements for
these technologies, and incurs a fee for each product sold that includes
the technology. The Company recognizes and estimates the amount of fees owed to
third parties based on products sold that include software and technology
purchased or licensed from these third parties. The Company uses all
available applicable information in determining these estimates and thus the
accrued amounts are subject to change as new information is made available to
the Company. In the third quarter of fiscal 2010, the Company reduced
its accrued expense fees by approximately $2,200,000 due to changes in estimates
and settlements. In the fourth quarter of fiscal 2010 the Company
corrected an error associated with prior periods. This correction resulted in a
reduction to accrued expense fees of approximately $382,000 and a corresponding
decrease to cost of sales. The Company did not deem this adjustment to be
material to any prior period based on both qualitative and quantitative
factors.
For
fiscal 2010 there was $1,705,067 in fees were charged to cost of sales net of
any changes in estimates reflected in the current year, and
$2,711,271 in fees were paid to various third parties. For
fiscal 2009 $2,694,648 in fees were charged to cost of sales and $2,545,587 in
fees were paid to various third parties. As of September 30,
2010 and September 30, 2009 the amount of Accrued expense fees amounted to
$4,955,540 and $5,935,606, respectively.
F-15
7. Accrued
Expenses
Accrued
expenses are for costs incurred for goods and services which are based on
estimates, charged as incurred to operations as period costs and for which no
invoice has been rendered. Included in accrued expenses are
accruals for product costs of $6,511,733 and $4,995,109 as of September 30, 2010
and 2009, respectively; accruals for sales costs relating to a sales
rebate program of $1,274,150 and $1,104,992 as
of September 30, 2010 and 2009, respectively;
accruals for freight and duty expenses
of $1,311,577 and $1,020,432 as of September
30, 2010 and 2009, respectively; accruals for compensation
costs of $291,789 and $343,325 as of September 30, 2010 and 2009,
respectively; accruals for warranty repair costs
of $276,520 and $283,507 as of September 30, 2010 and
2009, respectively and accruals for advertising and
marketing costs of $316,396 and $294,942 as of September
30, 2010 and 2009, respectively.
8.
Income Taxes
The
Company’s income tax provision consists of the following:
|
Years
ended September 30,
|
||||||||
|
2010
|
2009
|
|||||||
|
Current
tax expense:
|
||||||||
|
State
income taxes
|
$ | 40,000 | 40,000 | |||||
|
Foreign
income taxes
|
165,022 | 137,050 | ||||||
|
Total
current tax expense
|
205,022 | 177,050 | ||||||
|
Deferred
tax expense (benefit)
|
||||||||
|
Federal
|
236,432 | (147,184 | ) | |||||
|
State
|
27,815 | (17,316 | ) | |||||
|
Total
deferred tax expense (benefit)
|
264,247 | (164,500 | ) | |||||
|
Total
tax provision
|
$ | 469,269 | $ | 12,550 | ||||
Components
of deferred taxes
are as follows:
|
Years ended September 30,
|
||||||||
|
2010
|
2009
|
|||||||
|
Net
operating loss domestic
|
$ | 317,759 | $ | 388,989 | ||||
|
Net
operating loss foreign
|
475,693 | 475,693 | ||||||
|
Sales
reserve
|
426,630 | 328,119 | ||||||
|
Inventory
obsolescence
|
582,908 | 705,932 | ||||||
|
Allowance
for bad debts
|
145,834 | 312,824 | ||||||
|
Vacation
accrual
|
24,588 | 24,588 | ||||||
|
Warranty
reserve
|
9,158 | 9,158 | ||||||
|
263
A inventory capitalization
|
121,086 | 115,650 | ||||||
|
Depreciation
|
32,732 | 14,822 | ||||||
|
Goodwill
|
94,336 | 114,856 | ||||||
|
AMT
credit
|
177,704 | 170,247 | ||||||
|
R&D
credit
|
396,174 | 407,971 | ||||||
|
Subtotal
|
2,804,602 | 3,068,849 | ||||||
|
Valuation
allowance
|
(883,664 | ) | (883,664 | ) | ||||
|
Net
deferred tax assets
|
$ | 1,920,938 | $ | 2,185,185 | ||||
In
evaluating the future realization of our deferred tax asset and the
corresponding valuation allowance as of September 30, 2010, we took into
consideration:
|
|
·
|
the Company’s
domestic operations had taxable
income for four out of
the last five fiscal
years
|
|
|
·
|
including
royalties paid to the Company’s domestic operations by the
Company’s European subsidiary, the Company
anticipates taxable income for its domestic
operations for fiscal
2011
|
|
|
·
|
the
Company’s history of utilization
of prior domestic net operating
losses
|
After
evaluating the circumstances listed above, it was the Company’s opinion that its
net deferred tax asset net of $1,920,938 is realizable as of September 30,
2010.
F-16
As of
September 30, 2010 the Company had $836,208 in unrestricted domestic net
operating losses. As of September 30, 2010 the Company had tax credit
carry forwards for research and development expenses totaling $396,174 (which
expires between 2010 and 2014) which have a full valuation allowance recorded
against them. Our net deferred tax asset is primarily attributable to
our Hauppauge Computer Works Inc. domestic operations and consists of primarily
of timing differences. In addition there are foreign net
operating losses which have a full valuation allowance recorded against
them.
No
provision has been made for income taxes on substantially all of the
undistributed earnings of the Company’s foreign subsidiaries of approximately
$5,982,202 at September 30, 2010 as the Company intends to indefinitely reinvest
such earnings.
The
difference between the actual income tax provision (benefit) and the tax
provision computed by applying the Federal statutory income tax rate of 34% to
the income before income tax is attributable to the following:
|
Years ended September 30,
|
||||||||
|
2010
|
2009
|
|||||||
|
Income
tax expense at federal statutory rate
|
$ | (468,279 | ) | $ | (2,424,360 | ) | ||
|
Change
in estimate of prior year income taxes
|
(8,231 | ) | (178,025 | ) | ||||
|
Permanent
differences-life insurance
|
1,700 | 1,700 | ||||||
|
Permanent
differences-compensation expense
|
147,945 | 183,153 | ||||||
|
Permanent
differences-other
|
1,700 | 1,190 | ||||||
|
State
income taxes, net of federal benefit
|
54,215 | 9,084 | ||||||
|
Foreign earnings
taxed at rates other than the federal statutory rate
|
751,276 | 2,430,294 | ||||||
|
Other
|
(11,057 | ) | (10,486 | ) | ||||
|
Taxes
(benefit) on income (loss)
|
$ | 469,269 | $ | 12,550 | ||||
The
Company’s Luxembourg corporation functions as the entity which services the
Company’s European customers. The Company has separate domestic and foreign tax
entities, with the Luxembourg entity paying a royalty fee to the Company’s
domestic operation for use of the Hauppauge name.
Including
royalty fees charged to the Company’s European subsidiary, the Company’s
domestic operation incurred pretax income of $346,984 and $406,646 for the years
ended September 30, 2010 and 2009. The Company’s international
operations had pretax net loss including royalty fees of $ 1,724,275 and
$7,537,116 for the years ended September 30, 2010 and 2009.
9.
Stockholders’ Equity
a. Treasury
Stock
The
Company’s Board of Directors approved a stock repurchase program which allows
for the repurchase of 1,200,000 shares under the plan. As
of September 30, 2010, the Company held
760,479 treasury shares purchased for $2,405,548 at an average
purchase price of approximately $3.16 per share
b.
Stock Compensation Plans
On
December 14, 1995, the Board of Directors authorized the adoption of the 1996
Non-Qualified Stock Option Plan (the "1996 Non-Qualified Plan") which was
approved by the Company’s stockholders on March 5, 1996. The 1996
Non-Qualified Plan authorizes the grant of 500,000 shares of Common Stock,
subject to adjustment as provided in the plan. The plan expired on March 5, 2006
and no more options can be issued under this plan. This plan does not
qualify for treatment as an incentive stock option plan under the Internal
Revenue Code. As of September 30, 2010 and
2009, 138,000 and 181,400 options ranging in prices from
$1.08 to $4.13 were outstanding under the 1996 Non-Qualified
Plan.
F-17
On
December 17, 1997, the Company’s Board of Directors adopted and authorized a new
incentive stock option plan (“1997 ISO”) pursuant to section 422A of the
Internal Revenue Code. This plan was approved by the Company’s
stockholders at the Company’s March 12, 1998 annual stockholders’
meeting. The 1997 ISO plan as adopted authorizes the grant
of up to 700,000 shares of Common Stock, subject to adjustment as provided in
the plan. This plan terminated on December 16, 2007 and no further options can
be issued under this plan. As of September 30, 2010 and 2009, 154,267
and 168,360 options were outstanding with exercise price of $1.08 as of
September 30, 2010 and from $1.08 to $ 8.75 as of September 30,
2009.
The
Company’s Board of Directors, on May 9, 2000, adopted the 2000 Performance and
Equity Incentive Plan (the “2000 Plan”). This plan was approved by the
stockholders at the Company’s July 18, 2000 annual stockholders’ meeting. The
purpose of the 2000 Plan is to attract, retain and motivate key employees,
directors and non-employee consultants.
The 2000
Plan as adopted reserves 500,000 shares of Common Stock to be issued pursuant to
stock options grants or other awards, subject to adjustment for any merger,
reorganization, consolidation, recapitalization, stock dividend, stock split or
any other changes in corporate structure affecting the Common Stock. This plan
is to be administered by the Board of Directors. Grants of awards to
non-employee directors require the approval of the Board of
Directors.
The 2000
plan allows the granting of options as either incentive stock options or
non-qualified options. Non-employee directors and non-employee consultants may
only be granted Non-Qualified Stock Options. Incentive stock options
are priced at the market value at the time of grant and shall be exercisable no
more than ten years after the date of the grant. Incentive stock options granted
to employees who own 10% or more of the Company’s combined voting power cannot
be granted at less than 110% of the market value at the time of grant.
Non-qualified options shall be granted at a price determined by the Board of
Directors, or a committee thereof, and shall be exercisable no more than 10
years and one month after the grant. The aggregate fair market value of shares
subject to an incentive stock option granted to an optionee in any calendar year
shall not exceed $100,000. As of September 30, 2010 and 2009, 154,267
and 188,867 options were outstanding from this plan ranging in prices from $1.05
to $1.375 as of September 30, 201 0 and $1.05 to $ 5.78 as of September 30,
2009.
The
Company’s Board of Directors on May 16, 2003 adopted the 2003 Performance and
Equity Incentive Plan
(the
“2003 Plan”). This plan was approved by the stockholders at the Company’s
September 22, 2003 annual stockholders’ meeting. The purpose of the 2003 Plan is
to provide equity ownership opportunities and performance based incentives to
attract and retain the services of key employees, Directors and non-employee
consultants of the Company and to motivate such individuals to put forth maximum
efforts on behalf of the Company.
The 2003
Plan as adopted reserves up to 500,000 shares of Common Stock to be issued
pursuant to stock options grants or other awards, subject to adjustment for any
merger, reorganization, consolidation, recapitalization, stock
dividend, stock split or any other changes in corporate structure affecting the
Common Stock. All of the Common Stock which may be awarded
under the 2003 Plan may be subject to delivery through Incentive
Stock Option Plans. The 2003 Plan will be administered by the Board of Directors
or a Committee thereof composed of two or more members who are non-employee
Directors (the “Committee”). Grants of awards under the 2003 Plan to
non-employee Directors require the approval of the Board of Directors. On
September 5, 2006 the Company’s Board of Directors approved an amendment which
increased the number of shares of Common Stock authorized
and reserved for issuance under the plan by an additional 1,000,000 shares. The
amendment was approved by the Company’s stockholders at the
Company’s October 17, 2006 Annual Stockholders Meeting.
The Board
or the Committee may amend, suspend or discontinue the 2003 Plan or any portion
thereof at any time, but no amendment, suspension or discontinuation shall be
made which would impair the right of any holder without the holder’s
consent. Subject to the foregoing, the Board or the Committee has the
authority to amend the 2003 Plan to take into account changes in law and tax and
accounting rules, as well as other developments. The Board or the
Committee may institute loan programs to assist participants in financing
the exercise of options through full recourse interest bearing notes
not to exceed the cash consideration plus all applicable taxes in connection
with the acquisition of shares.
F-18
This plan
allows the granting of options as either incentive stock options or
non-qualified options. Non-employee directors and non-employee consultants may
only be granted Non-Qualified Stock Options. Incentive stock options are priced
at the market value at the time of grant and shall be exercisable no more than
ten years after the date of the grant. Incentive stock options granted to
employees who own 10% or more of the Company’s combined voting power cannot be
granted at less than 110% of the market value at the time of grant.
Non-qualified options shall be granted at a price determined by the Board of
Directors and shall be exercisable no more than 10 years and one month after the
grant. The aggregate fair market value of shares subject to an incentive stock
option granted to an optionee in any calendar year shall not exceed $100,000.
Any fair value at the time of grant that exceeds $100,000 in any calendar year
will not be deemed as incentive stock options. As of September 30, 2010 and
2009, 1,115,750 and 951,500 were outstanding from this plan ranging in prices
from $0.95 to $7.45 as of September 30, 2010 and $1.24 to $ 7.45 as of September
30, 2009.
The Board
or the Committee may grant options with a reload feature. A reload feature shall
only apply when the option price is paid by delivery of Common Stock held by the
optionee for at least 12 months. The agreement for options containing the reload
feature shall provide that the option holder shall receive, contemporaneously
with the payment of the option price in Common Stock, a reload stock option to
purchase the number of Common Stock equal to the number of Common Stock used to
exercise the option, and, to the extent authorized by the Board or the
Committee, the number of Common Stock used to satisfy any tax withholding
requirement incident to the underlying Stock Option. The exercise price of the
reload options shall be equal to the fair market value of the Common Stock on
the date of grant of the reload option and each reload option shall be fully
exercisable six months from the effective date of the grant of such reload
option. The term of the reload option shall be equal to the remaining term of
the option which gave rise to the reload option. No additional reload options
shall be granted to optionees when Stock Options are exercised following the
termination
of the optionee’s employment. Subject to the foregoing, the terms of the 2003
Plan applicable to the option shall be equally applicable to the reload
option.
Stock
Appreciation Rights may be granted in conjunction with all or part of any stock
option granted under the 2003 Plan or independent of a stock option grant. Stock
Appreciation Rights shall be subject to such terms and conditions as shall be
determined by the Board or the Committee. Upon the exercise of a Stock
Appreciation Right, a holder shall be entitled to receive an amount in cash,
Common Stock, or both, equal in value to the excess of the fair market value
over the option exercise price per Common Stock. Shares of Restricted Stock may
also be issued either alone or in addition to other amounts granted under the
2003 Plan. The Board or the Committee shall determine the officers, key
employees and non-employee consultants to whom and the time or times at which
grants of Restricted Stock will be made, the number of shares to be awarded, the
time or times within which such awards may be subject to forfeiture and any
other terms and conditions of the awards. Long term performance awards may be
awarded either alone or in addition to other awards granted under the 2003 Plan.
The Board or the Committee shall determine the nature, length, and starting date
of the performance
period which shall generally be at least two years. The maximum award for any
individual with respect to any one year of any applicable performance period
shall be 100,000 shares of Common Stock.
Upon a
Change in Control as defined in the 2003 Plan, but only to the extent determined
by the Board or the Committee, stock options, stock appreciation rights and long
term performance awards (the “Award”) will vest, provided that no award granted
to an employee of the Company shall vest or be exercisable unless the employee’s
employment is terminated within 24 months from the date of the Change in
Control, (as defined in the 2003 Plan) unless the employee is terminated for
Cause, as defined in the 2003 Plan or if the employee resigns his employment
without Good Reason, as defined in the 2003 Plan. Otherwise, the Award shall not
vest and be exercisable upon a Change in Control, unless otherwise determined.
The employee shall have 30 days from after his employment is terminated due to a
Change in Control to exercise all unexercised Awards. However, in the event of
the death or disability of the employee, all unexercised Awards must be
exercised within twelve (12) months after the death or disability of the
employee.
The
Company’s Board of Directors on May 9, 2000 adopted the Employee Stock Purchase
Plan. This plan was approved by the Company’s stockholders’ at the Company’s
July 18, 2000 annual stockholders’ meeting. This plan is intended to provide the
Company’s full- time employees an opportunity to purchase an ownership interest
in the Company through the purchase of Common Stock. The Company had reserved
100,000 shares of Common Stock for issuance under the plan. This plan is to be
administered by the Board of Directors. Employees who have completed six months
of employment and who work more than 20 hours per week for more than five months
in the year are eligible to participate in the plan. The employee may elect to
payroll deductions up to 10% per pay period. The purchase price shall either be
the lower of 85% of the closing price on the offering commencement date or the
offering termination date. No employee will be granted an option to purchase
shares of Common Stock if such employee would own shares or holds options to
purchase shares which would cause the employee to own more than 5% of the
combined voting power of all classes of stock. Non-employees are not eligible to
participate. The plan’s initial termination date was December 31, 2003. The
maximum number of shares that may be issued in any quarterly offering is 10,000,
plus un-issued shares from prior offerings whether offered or not. At the
Company’s September 6, 2002 stockholders’ meeting, the Company’s stockholders’
approved an increase in shares reserved under this plan to 180,000, and extended
the plan termination date to December 31, 2004. At the Company’s September 27,
2004 stockholders’ meeting the Company’s stockholders’ approved an increase in
shares reserved under this plan to 260,000, and extended the plan termination
date to December 31, 2006. On May 25, 2006 the Company’s Board of Directors
approved a third amendment to the plan increasing the number of shares available
to 420,000 and extending the expiration date of the plan to December 31, 2010.
The amendment was approved by the Company’s stockholders’ at the Company’s
October 17, 2006 annual stockholders’ meeting. As of September 30, 2010 and
2009, 218,896 and 204,289 shares of Common Stock were purchased under this
plan.
F-19
A summary
of the of the Company’s fixed options plans as of September 30, 2010 and 2009
and changes during the years ending those dates is presented
below:
|
Weighted
|
||||||||||||||||||||
|
Weighted
|
Weighted
|
average
|
||||||||||||||||||
|
Average
|
Average
|
contracted
|
Aggregate
|
|||||||||||||||||
|
Exercise
|
Non
|
Exercise
|
term
|
intrinsic
|
||||||||||||||||
|
ISO
|
Price
|
Qualified
|
Price
|
(years)
|
value
|
|||||||||||||||
|
Balance
at September 30, 2008
|
1,580,769 | $ | 3.99 | 186,975 | $ | 3.53 | ||||||||||||||
|
Granted
|
95,000 | 1.24 | - | - | ||||||||||||||||
|
Forfeited
|
(334,775 | ) | 3.85 | (5,575 | ) | 1.08 | ||||||||||||||
|
Balance
at September 30, 2009
|
1,340,994 | $ | 3.77 | 181,400 | $ | 3.64 | ||||||||||||||
|
Granted
|
195,250 | 0.55 | 0 | 0.00 | ||||||||||||||||
|
Forfeited
|
(206,177 | ) | 4.19 | (43,400 | ) | 4.67 | ||||||||||||||
|
Exercised
|
(13,625 | ) | 1.27 | 0 | 1.08 | |||||||||||||||
|
Balance
at September 30, 2010
|
1,316,442 | $ | 3.32 | 138,000 | $ | 3.31 |
6.53
|
-
|
||||||||||||
|
Options
exercisable at September 30, 2010
|
863,942 | $ | 3.91 | 138,000 | $ | 3.31 |
5.68
|
-
|
||||||||||||
The
aggregate intrinsic value of options exercised during the year ended September
30, 2010 was approximately $22,000. There were no options exercised
during fiscal 2009.
c. Stockholders’
Rights Agreements
On July
19, 2001, the Company’s Board of Directors adopted a stockholder rights plan, as
set forth in the Rights Agreement, dated as of July 20, 2001 (the "Rights
Agreement") between the Company and North American Transfer
Company as Rights Agent. Pursuant to the Rights Agreement, one Right was issued
for each share of Common Stock of the Company outstanding as of August 5, 2001.
Each of the Rights entitles the registered holder to purchase from the Company
one share of Common Stock at a price of $11.00 per share, subject to adjustment.
The Rights generally will not become exercisable unless and until, among other
things, any person acquires 10% to 12% or more of the outstanding Common Stock
or makes a tender offer to acquire 10% or more of the outstanding Common Stock.
The 10% threshold will not be applicable to institutional investors who stay
below a 20% ownership level and who report their ownership on a Schedule 13G
under the Securities Exchange Act of 1934. In addition, stockholders of more
than 10% of the Common Stock as of July 19, 2001 were grandfathered at their
then current level plus 1% unless they later fall below the 10% threshold. The
Rights are redeemable under certain circumstances at $0.001 per Right and will
expire, unless earlier redeemed or extended, on July 19, 2011.
10. Significant Customer
Information
For
fiscal 2010 there was no one customer that accounted for over 10% of our net
sales. For fiscal 2009, the Company had one customer, D&H Distributing, that
accounted for approximately 12% of our net sales.
11. Related Party
Transactions
The
Company occupies a facility located in Hauppauge, New York for its executive
offices and for the testing, storage and shipping of its products. Hauppauge
Computer Works, Inc., (“HCW”) leases the premises (the “1990 Lease”), from
Ladokk Realty Co., a real estate partnership which is principally owned by
Kenneth Plotkin, the Company’s President, Chairman of the Board, Chief Executive
Officer and Chief Operating Officer and a stockholder of the Company, Dorothy
Plotkin, the wife of Kenneth Plotkin and a stockholder of the Company and Laura
Aupperle, the widow of Kenneth Aupperle, a founder and former President of the
Company. The Company is obligated to pay real estate taxes and operating costs
of maintaining the premises subject to the 1990 Lease.
F-20
The Lease
ends on August 31, 2011 and calls for base rent in the first year of
the term of $300,000, payable monthly in the amount of $25,000. Rent is subject
to an annual increase of 3% over the term. The execution of the Lease Amendment
was approved by our Board of Directors, following the recommendation of our
Audit Committee. HCW is obligated to pay for utilities, repairs to the Premises,
and taxes during the term.
12. Litigation
In the
normal course of business the Company is party to various claims and/or
litigation. To the best of its knowledge management believes that
there is currently no material litigation which, considered in the aggregate
would have a material adverse effect on the Company’s financial position and
results of operations.
13. Acquisition
of PCTV Assets from Avid Technology, Inc.
Effective
December 24, 2008, pursuant to an Asset Purchase Agreement, dated as of October
25, 2008, as amended by that certain Amendment No. 1 to the Asset Purchase
Agreement (the “Amendment”) (together with the Amendment, the “Asset Purchase
Agreement”), PCTV Systems, Sarl, a Luxembourg company (“Buyer”)
and the Company’s wholly-owned
subsidiary, acquired certain assets and properties (the “Acquired
Assets”) of Avid Technology, Inc. (“Avid”), a Delaware corporation, Pinnacle
Systems, Inc., a California corporation (“Pinnacle”), Avid Technology GmbH, a
limited liability company organized under the laws of Germany, Avid Development
GmbH, a limited liability company organized under the laws of Germany, and Avid
Technology International BV (collectively, the “Sellers”). The
Acquired Assets were used by the Sellers in the business of, among other things,
the development, manufacture and sale of personal devices containing a
television tuner for receiving over-the-air, satellite and/or cable television
signals that are used in conjunction with personal computers for personal
television viewing. The potential increase in the Company’s
customer base, the potential absorption of the PCTV operations into the existing
Hauppauge infrastructure with minimal incremental costs plus the acquisition of
the seller’s technology, reference designs and product line were among the
attributes that were considered in the Company’s decision to complete the
acquisition.
The
purchase price consisted of $2,238,000 payable in cash; $2,500,000 payable
pursuant to Promissory Note, dated December 24, 2008, made payable by the Buyer
to Avid (the “Note”) and the assumption of certain liabilities. The
principal amount due pursuant to the Note was payable in 12 equal
monthly installments of $208,333. The first such payment was due and paid on
January 24, 2009 and the last payment was made on December 23,
2009. Interest on the outstanding principal amount of the Note
was payable at a rate equal to (i) from December 24, 2008 until the Maturity
Date (as defined in the Note), five percent (5%), (ii) from and after the
Maturity Date, or during the continuance of an Event of Default (as defined in
the Note), at seven percent (7%).
The
$4,738,000 paid to the seller, Avid Technology, Inc., consisted of $2,238,000
paid at the closing and $2,500,000 paid pursuant to a note
payable. As of September 30, 2009, the note payable
to Avid Technologies Inc. was $625,045. The note was paid in full on December
24, 2009. The interest paid on the note was $3,968 and $62,557 for
twelve months ended September 30, 2010 and 2009.
The purchase
price and the allocation of the purchase price is presented below.
|
Purchase Price Paid
|
||||
|
Cash
paid to seller
|
$ | 4,738,000 | ||
|
Warranty
liability assumed
|
262,000 | |||
|
Direct
acquisition costs paid
|
486,578 | |||
|
Total
purchase price
|
$ | 5,486,578 | ||
|
Allocation of Purchase
Price
|
||||
|
Identifiable
intangible assets
|
$ | 5,262,229 | ||
|
Fixed
assets
|
224,349 | |||
|
Total
allocation of purchase price
|
$ | 5,486,578 | ||
F-21
The
values allocated to identifiable intangible assets in the acquisition are
expected to be deductible for income tax purposes. Because the
acquisition was completed on December 24, 2008, results from the operations of
the PCTV business effectively started on January 1, 2009.
The
following unaudited pro forma results assume the acquisition occurred on October
1, 2008. The pro forma results do not purport to represent what the
Company’s results of operations actually would have been if the transactions set
forth above had occurred on the date indicated or what the Company’s results of
operations will be in future periods. The financial results for the
periods prior to the acquisition were based on internal financial statements as
provided by the Sellers.
|
Twelve months
|
||||
|
ended
|
||||
|
Sept 30,
|
||||
|
Pro forma statements:
|
2009
|
|||
|
Revenue
|
$ | 70,367,528 | ||
|
Net loss
|
$ | (7,841,031 | ) | |
|
Net loss
per share:
|
||||
|
Basic
and Diluted net loss per share
|
$ | (0.78 | ) | |
In
connection with the transactions contemplated by the Asset Purchase Agreement,
the Buyer, Hauppauge Digital Europe Sarl (“HDES”), and Hauppauge Computer Works,
Inc. (“HCW”), each a wholly-owned subsidiary of the Company (collectively, the
“Subsidiaries”) and the Sellers entered into a Transition Services Agreement,
dated December 24, 2008 (the “TSA”), pursuant to which, among other things, the
parties agreed to provide each other with certain services relating to
infrastructure and systems, order processing and related matters and systems
transition and related matters (the “Services”), as set forth in detail in the
TSA. The fees for such Services are set forth in the TSA. The
Transition Services Agreement was terminated as of April 30, 2009.
Further,
Avid and Avid Technology International BV (collectively, the
“Consignor”), and HCW and HDES (collectively, the “Consignee”) entered into an
Inventory and Product Return Agreement, dated December 24, 2008 (the “Inventory
Agreement”). Pursuant to the terms of the Inventory Agreement, the
Consignor is obligated to deliver the Consigned Inventory (as defined in the
Inventory Agreement) to the Consignee and the Consignee is obligated to, as
applicable, fill orders from products held as Consigned Inventory before filling
any such orders with products or inventory other than the Consigned
Inventory. Upon the sale of Consigned Inventory by the Consignee, the
Consignee has agreed to pay the Consignor for such Consigned Inventory as
follows: (i) if Consignee sells Consigned Inventory for a price equal to or
greater than Consignor’s Cost (as defined in the Inventory Agreement) for such
Consigned Inventory, then Consignee has agreed to pay Consignor an amount equal
to one hundred percent (100%) of the Consignor Cost for such Consigned
Inventory; or (ii) if Consignee sells Consigned Inventory for a price less than
the Consignor Cost for such Consigned Inventory, then Consignee has agreed to
pay Consignor an amount equal to eighty percent (80%) of the sales price for
such Consigned Inventory. The Inventory Agreement expired on June 24,
2010.
In
connection with the transactions contemplated by the Asset Purchase Agreement,
Avid, Pinnacle and the Buyer also entered into an Intellectual Property License
Agreement, dated December 24, 2008 (the “IP Agreement”). Pursuant to
the terms of the IP Agreement, Avid and Pinnacle have granted the Buyer certain
irrevocable, personal, non-exclusive, worldwide, fully paid, royalty-free and
non-transferable licenses to certain copyrights and other intellectual property
rights owned by Avid, Pinnacle and their respective subsidiaries, subject to
certain termination provisions as set forth in the IP Agreement.
14.
Commitments and Contingencies
The
Company occupies space from both a related party and non related parties.
Rent expense to related parties and non related third parties totaled
approximately $726,000 and $730,000 for the years ended September 30, 2010
and 2009 respectively. The Company pays the real estate taxes and it is
responsible for normal building maintenance.
F-22
Minimum
annual lease payments to related parties and unrelated third parties are as
follows:
Years Ended September
30,
|
|
||||
|
2011
|
$ | 725,810 | ||
|
2012
|
242,030 | |||
|
2013
|
117,876 | |||
|
2014
|
58,938 | |||
|
Total
|
$ | 1,144,654 | ||
15. Fair
Value Measurements
ASC Topic
820, “Fair Value Measurements and Disclosures”, establishes a framework for
measuring fair value, and expands the related disclosure requirements. The ASC
indicates, among other things, that a fair value measurement assumes a
transaction to sell an asset or transfer a liability occurs in the principal
market for the asset or liability or, in the absence of a principal market, the
most advantageous market for the asset or liability. The Company also adopted
the provisions of ASC 820-10 with respect to its non-financial assets and
liabilities during the first quarter of fiscal 2010. In order to
increase consistency and comparability in fair value measurements, ASC 820-10
establishes a hierarchy for observable and unobservable inputs used to measure
fair value into three broad Levels, which are described below:
• Level
1: Quoted prices (unadjusted) in active markets that are accessible at the
measurement date for assets or liabilities. The fair value hierarchy gives the
highest priority to Level 1 inputs.
• Level
2: Observable prices that are based on inputs not quoted on active markets, but
corroborated by market data.
• Level
3: Unobservable inputs are used when little or no market data is available. The
fair value hierarchy gives the lowest priority to Level 3 inputs.
In
determining fair value, the Company utilizes valuation techniques that maximize
the use of observable inputs and minimize the use of unobservable inputs to the
extent possible as well as considers counterparty credit risk in its assessment
of fair value.
As of
September 30, 2010 and 2009 the Company had no open contracts
outstanding.
Additionally,
on a nonrecurring basis, the Company uses fair value measures when analyzing
asset impairment. Long-lived assets and certain identifiable
intangible assets are reviewed for impairment whenever events or changes in
circumstances indicate that the carrying amount of an asset may not be
recoverable. If it is determined such indicators are present and the review
indicates that the assets will not be fully recoverable, based on undiscounted
estimated cash flows over the remaining amortization periods, their carrying
values are reduced to estimated fair value. Measurements based on undiscounted
cash flows are considered to be Level 3 inputs.
The
carrying amount of cash, accounts receivables and accounts payables and other
short-term financial instruments approximate their fair value due to their
short-term nature.
F-23
SIGNATURES
Pursuant
to the requirements of Section 13 or 15(d) of the Securities Exchange Act of
1934, the registrant has duly caused this report to be signed on its behalf by
the undersigned, thereunto duly authorized.
|
HAUPPAUGE
DIGITAL INC.
|
||
|
By:
|
/s/ Kenneth
Plotkin
|
Date:
December 29,
2010
|
|
KENNETH
PLOTKIN
|
||
|
President,
Chairman of the Board, Chief Executive Officer and
Chief
|
||
|
Operating
Officer (Principal Executive Officer)
|
||
|
By:
|
/s/ Gerald
Tucciarone
|
Date:
December 29,
2010
|
|
GERALD
TUCCIARONE
|
||
|
Treasurer,
Chief Financial Officer and Secretary (Principal
Financial
|
||
|
And
Accounting
Officer)
|
||
Pursuant
to the requirements of the Securities Exchange Act of 1934, this report has been
signed below by the following persons on behalf of the registrant and in the
capacities and on the dates indicated.
|
By:
|
/s/ Kenneth
Plotkin
|
Date:
December 29,
2010
|
|
KENNETH
PLOTKIN
|
||
|
President,
Chairman of the Board, Chief Executive Officer and
Chief
|
||
|
Operating
Officer (Principal Executive Officer) and Director
|
||
|
By:
|
/s/ Gerald
Tucciarone
|
Date:
December 29,
2010
|
|
GERALD
TUCCIARONE
|
||
|
Treasurer,
Chief Financial Officer and Secretary (Principal
Financial
|
||
|
And
Accounting Officer)
|
||
|
By:
|
/s/Seymour G.
Siegel
|
Date:
December 29,
2010
|
|
SEYMOUR
G. SIEGEL
|
||
|
Director
|
||
|
By:
|
/s/ Bernard
Herman
|
Date:
December 29,
2010
|
|
BERNARD
HERMAN
|
||
|
Director
|
||
|
By:
|
/s/ Christopher G.
Payan
|
Date:
December 29,
2010
|
|
CHRISTOPHER
G. PAYAN
|
||
|
Director
|
||