Attached files
| file | filename |
|---|---|
| EX-31.2 - CERTIFICATION - UTG INC | exhibit312.htm |
| EX-32.2 - CERTIFICATION - UTG INC | exhibit322.htm |
| EX-31.1 - CERTIFICATION - UTG INC | exhibit311.htm |
| EX-32.1 - CERTIFICATION - UTG INC | exhibit321.htm |
UNITED STATES
SECURITIES AND EXCHANGE COMMISSION
Washington, D.C. 20549
FORM 10-Q/A
(Amendment No. 1)
(Mark One)
|
[X]
|
QUARTERLY REPORT PURSUANT TO SECTION 13 AND 15(d) OF THE SECURITIES EXCHANGE ACT
|
|
OF 1934
|
For the quarterly period ended March 31, 2010
OR
|
[ ]
|
TRANSITION REPORT PURSUANT TO SECTION 13 OR 15(d) OF THE SECURITIES EXCHANGE ACT
|
|
OF 1934
|
For the transition period from _____________ to ____________
Commission File No. 0-16867
|
UTG, INC.
|
||
|
(Exact name of registrant as specified in its charter)
|
||
|
Delaware
|
20-2907892
|
|
|
(State or other jurisdiction of
|
(I.R.S. Employer
|
|
|
incorporation or organization)
|
Identification No.)
|
|
|
5250 SOUTH SIXTH STREET
|
||
|
P.O. BOX 5147
|
||
|
SPRINGFIELD, IL 62705
|
||
|
(Address of principal executive offices) (Zip Code)
|
||
Registrant's telephone number, including area code: (217) 241-6300
Indicate by check mark whether the registrant (1) has filed all reports required to be filed by Section 13 or 15(d) of the Securities Exchange Act of 1934 during the preceding 12 months (or for such shorter period that the registrant was required to file such reports), and (2) has been subject to such filing requirements for the past 90 days. Yes [X] No [ ]
Indicate by check mark whether the registrant is a large accelerated filer, an accelerated filer, a non-accelerated filer or a small reporting company. See definitions of “large accelerated filer”, “accelerated filer” and “smaller reporting company” in Rule 12b-2 of the Exchange Act. (Check one):
|
Large accelerated filer [ ]
|
Accelerated filer [ ]
|
Non-accelerated filer [ ]
|
Smaller reporting company [X]
|
|
Indicate by check mark whether the registrant is a shell company.
|
Yes [ ]
|
No [X]
|
The number of shares outstanding of the registrant’s common stock as of April 30, 2010, was 3,880,871.
UTG, INC. AND SUBSIDIARIES
(The “Company”)
TABLE OF CONTENTS
|
PART 1. FINANCIAL INFORMATION…………………………………………………………………………..…........................................................................
|
3
|
|
ITEM 1. FINANCIAL STATEMENTS...……………………………………………………………………..............................................................………..……
|
3
|
|
Consolidated Balance Sheets of March 31, 2010 and December 31, 2009………….……………………..….................................................................…
|
3
|
|
Consolidated Statements of Operations for three months ended March 31, 2010 and 2009…………………...........................................................…..
|
4
|
|
Consolidated Statement of Changes in Equity and Comprehensive Income
|
|
|
For the three months ended March 31, 2010…..………..……………………………………………………...............................................................…….
|
5
|
|
Consolidated Statements of Cash Flows for the three months ended March 31, 2010 and 2009.........….........................................................................
|
6
|
|
Notes to Consolidated Financial Statements……………………………………………………………………..............................................................……
|
7
|
|
ITEM 2. MANAGEMENT’S DISCUSSION AND ANALYSIS OF FINANCIAL CONDITION AND
|
|
|
RESULTS OF OPERATIONS…………………………………..………………………………………………….................................................................….…..
|
19
|
|
ITEM 3. QUANTITATIVE AND QUALITATIVE DISCLOSURES ABOUT MARKET RISK.……………….........................................................…...……
|
25
|
|
ITEM 4. CONTROLS AND PROCEDURES..…………………………………………………………….……...................................................................……….
|
26
|
|
PART II. OTHER INFORMATION…..……………………….…………………………………………………..............................................................………….
|
27
|
|
ITEM 1. LEGAL PROCEEDINGS…………………………………………………………….…..................................................................……………………….
|
27
|
|
ITEM 1A. RISK FACTORS………………………………………………………………………………................................................................………………..
|
27
|
|
ITEM 2. UNREGISTERED SALES OF EQUITY SECURITIES AND USE OF PROCEEDS…………......................................................................……...……
|
27
|
|
ITEM 3. DEFAULTS UPON SENIOR SECURITIES……………………………………………………...................................................................……………..
|
27
|
|
ITEM 4. SUBMISSION OF MATTERS TO A VOTE OF SECURITY HOLDERS……………………..................................................................……………..
|
27
|
|
ITEM 5. OTHER INFORMATION...……………………………………………………………………….................................................................……………..
|
27
|
|
ITEM 6. EXHIBITS AND REPORTS ON FORM 8-K...…………………………………………………...................................................................……………..
|
27
|
|
SIGNATURES...…………………………………………………………………………………………………….................................................................…………
|
28
|
|
EXHIBIT INDEX...………………………………………………………………………………………………….................................................................………....
|
29
|
|
PART 1. FINANCIAL INFORMATION
|
||||||||
|
Item 1. Financial Statements
|
||||||||
|
UTG, Inc.
|
||||||||
|
AND SUBSIDIARIES
|
||||||||
|
Consolidated Balance Sheets (Unaudited)
|
||||||||
|
March 31,
|
December 31,
|
|||||||
|
ASSETS
|
2010
|
2009*
|
||||||
|
Investments:
|
||||||||
|
Investments available for sale:
|
||||||||
|
Fixed maturities, at market (amortized $148,195,362 and $138,680,398)
|
$
|
150,973,962
|
$
|
139,704,693
|
||||
|
Equity securities, at market (cost $14,129,576 and $14,316,463)
|
12,898,840
|
13,323,322
|
||||||
|
Trading securities, at market (cost $32,865,095 and $19,043,448)
|
33,724,684
|
19,613,472
|
||||||
|
Mortgage loans on real estate at amortized cost
|
65,467,046
|
61,271,384
|
||||||
|
Investment real estate, at cost, net of accumulated depreciation
|
44,499,770
|
45,556,811
|
||||||
|
Policy loans
|
14,234,652
|
14,343,606
|
||||||
|
Short-term investments
|
0
|
700,000
|
||||||
|
321,798,954
|
294,513,288
|
|||||||
|
Cash and cash equivalents
|
10,052,113
|
37,492,843
|
||||||
|
Investment in unconsolidated affiliate, at market (cost $5,000,000 and $5,000,000)
|
5,090,253
|
5,057,762
|
||||||
|
Accrued investment income
|
1,394,012
|
1,577,199
|
||||||
|
Reinsurance receivables:
|
||||||||
|
Future policy benefits
|
67,920,112
|
68,615,385
|
||||||
|
Policy claims and other benefits
|
5,986,291
|
5,131,031
|
||||||
|
Cost of insurance acquired
|
15,070,829
|
15,402,012
|
||||||
|
Deferred policy acquisition costs
|
614,384
|
647,526
|
||||||
|
Property and equipment, net of accumulated depreciation
|
1,480,934
|
1,485,253
|
||||||
|
Income taxes receivable
|
0
|
500,305
|
||||||
|
Other assets
|
1,810,359
|
1,096,368
|
||||||
|
$
|
431,218,241
|
$
|
431,518,972
|
|||||
|
Total assets
|
||||||||
|
LIABILITIES AND SHAREHOLDERS' EQUITY
|
||||||||
|
Liabilities:
|
||||||||
|
Policy liabilities and accruals:
|
||||||||
|
Future policy benefits
|
$
|
311,919,574
|
$
|
313,798,199
|
||||
|
Policy claims and benefits payable
|
3,869,610
|
3,248,521
|
||||||
|
Other policyholder funds
|
939,215
|
940,357
|
||||||
|
Dividend and endowment accumulations
|
14,144,200
|
14,182,516
|
||||||
|
Income taxes payable
|
410,019
|
0
|
||||||
|
Deferred income taxes
|
11,340,959
|
11,950,254
|
||||||
|
Notes payable
|
13,194,554
|
14,402,889
|
||||||
|
Trading securities, at market (proceeds $12,329,216 and $10,590,552)
|
13,227,485
|
11,671,911
|
||||||
|
Other liabilities
|
7,458,392
|
7,265,586
|
||||||
|
Total liabilities
|
376,504,008
|
377,460,233
|
||||||
|
Shareholders' equity:
|
||||||||
|
Common stock - no par value, stated value $.001 per share
|
||||||||
|
Authorized 7,000,000 shares - 3,881,539 and 3,884,445 shares issued
|
|
|
||||||
|
after deducting treasury shares of 413,744 and 410,838
|
3,881
|
3,885
|
||||||
|
Additional paid-in capital
|
41,759,029
|
41,782,274
|
||||||
|
Retained earnings (accumulated deficit)
|
(926,312)
|
(1,261,503)
|
||||||
|
Accumulated other comprehensive income
|
573,518
|
322,156
|
||||||
|
Noncontrolling interest
|
13,304,117
|
13,211,927
|
||||||
|
Total shareholders' equity
|
54,714,233
|
54,058,739
|
||||||
|
Total liabilities and shareholders' equity
|
$
|
431,218,241
|
$
|
431,518,972
|
||||
|
* Balance sheet audited at December 31, 2009.
|
||||||||
|
UTG, Inc.
|
||||
|
AND SUBSIDIARIES
|
||||
|
Consolidated Statements of Operations (Unaudited)
|
||||
|
Three Months Ended
|
||||
|
March 31,
|
March 31,
|
|||
|
2010
|
2009
|
|||
|
Revenues:
|
||||
|
Premiums and policy fees
|
$
|
4,122,858
|
$
|
5,162,397
|
|
Reinsurance premiums and policy fees
|
(966,091)
|
(963,826)
|
||
|
Net investment income
|
4,322,949
|
3,443,283
|
||
|
Other income
|
466,382
|
517,880
|
||
|
Realized investment gains (losses), net:
|
||||
|
Other-than-temporary impairments
|
(477,386)
|
(700,804)
|
||
|
Other-than-temporary impairments transferred
|
||||
|
to other comprehensive loss
|
0
|
0
|
||
|
Other realized investment gains, net
|
214,936
|
573,936
|
||
|
Total realized investment (losses), net
|
(262,450)
|
(126,868)
|
||
|
|
7,683,648
|
8,032,866
|
||
|
Benefits and other expenses:
|
||||
|
Benefits, claims and settlement expenses:
|
||||
|
Life
|
6,011,656
|
7,261,725
|
||
|
Reinsurance benefits and claims
|
(1,755,831)
|
(941,876)
|
||
|
Annuity
|
165,668
|
305,188
|
||
|
Dividends to policyholders
|
167,923
|
263,487
|
||
|
Commissions and amortization of deferred
|
||||
|
policy acquisition costs
|
(117,374)
|
127,078
|
||
|
Amortization of cost of insurance acquired
|
331,183
|
1,102,031
|
||
|
Operating expenses
|
1,971,570
|
1,809,819
|
||
|
Interest expense
|
96,684
|
138,836
|
||
|
|
6,871,479
|
10,066,288
|
||
|
Income (loss) before income taxes
|
812,169
|
(2,033,422)
|
||
|
Income tax benefit (expense)
|
(312,529)
|
483,987
|
||
|
Net income (loss)
|
499,640
|
(1,549,435)
|
||
|
Net income (loss) attributable to noncontrolling interest
|
(164,449)
|
279,926
|
||
|
Net income (loss) attributable to common shareholders
|
$
|
335,191
|
$
|
(1,269,509)
|
|
Basic income (loss) per share
|
$
|
0.09
|
$
|
(0.33)
|
|
Diluted income (loss) per share
|
$
|
0.09
|
$
|
(0.33)
|
|
Basic weighted average shares outstanding
|
3,883,020
|
3,838,409
|
||
|
Diluted weighted average shares outstanding
|
3,883,020
|
3,838,409
|
||
|
UTG, Inc.
|
|||||||
|
AND SUBSIDIARIES
|
|||||||
|
Consolidated Statement of Changes in Equity and Comprehensive Income
|
|||||||
|
(Unaudited)
|
|||||||
|
Three Months Ended
|
|||||||
|
Common stock
|
March 31, 2010
|
||||||
|
Balance, beginning of year
|
$
|
3,885
|
|||||
|
Issued during year
|
0
|
||||||
|
Treasury shares acquired and retired
|
(4)
|
||||||
|
Balance, end of period
|
3,881
|
||||||
|
Additional paid-in capital
|
|||||||
|
Balance, beginning of year
|
41,782,274
|
||||||
|
Issued during year
|
0
|
||||||
|
Treasury shares acquired and retired
|
(23,245)
|
||||||
|
Balance, end of period
|
41,759,029
|
||||||
|
Retained earnings (accumulated deficit)
|
|||||||
|
Balance, beginning of year
|
(1,261,503)
|
||||||
|
Net income attributable to common shareholders
|
335,191
|
||||||
|
Balance, end of period
|
(926,312)
|
||||||
|
Accumulated other comprehensive income
|
|||||||
|
Balance, beginning of year
|
322,156
|
||||||
|
Other comprehensive income
|
|||||||
|
Unrealized holding gains on securities net of
|
|||||||
|
noncontrolling and reclassification adjustment
|
|||||||
|
and taxes
|
251,362
|
||||||
|
Balance, end of period
|
573,518
|
||||||
|
Noncontrolling interest
|
|||||||
|
Balance, beginning of year
|
13,211,927
|
||||||
|
Contributions
|
0
|
||||||
|
Distributions
|
0
|
||||||
|
Gain attributable to noncontrolling interest
|
92,190
|
||||||
|
Balance, end of year
|
13,304,117
|
||||||
|
Total shareholders' equity, end of period
|
$
|
54,714,233
|
|||||
|
Comprehensive income
|
|||||||
|
Net income attributable to common shareholders
|
$
|
335,191
|
|||||
|
Unrealized holding gains on securities net of
|
|||||||
|
noncontrolling and reclassification adjustment
|
|||||||
|
and taxes
|
251,362
|
||||||
|
Total comprehensive income
|
$
|
586,553
|
|||||
See accompanying notes.
|
UTG, Inc.
|
|||||||
|
AND SUBSIDIARIES
|
|||||||
|
Consolidated Statements of Cash Flows (Unaudited)
|
|||||||
|
Three Months Ended
|
|||||||
|
March 31,
|
March 31,
|
||||||
|
|
2010
|
2009
|
|||||
|
Cash flows from operating activities:
|
|||||||
|
Net income (loss) attributable to common shares
|
$ 335,191
|
$ (1,269,509)
|
|||||
|
Adjustments to reconcile net income (loss) to net cash
|
|||||||
|
used in operating activities net of changes in assets
|
|||||||
|
and liabilities resulting from the sales and purchases
|
|||||||
|
of subsidiaries:
|
|||||||
|
Amortization/accretion of fixed maturities
|
31,091
|
11,456
|
|||||
|
Realized investment gains
|
262,450
|
126,868
|
|||||
|
Non-cash trading activity included in income
|
(643,348)
|
0
|
|||||
|
Amortization of deferred policy acquisition costs
|
33,142
|
41,486
|
|||||
|
Amortization of cost of insurance acquired
|
331,183
|
1,102,031
|
|||||
|
Depreciation
|
318,795
|
698,069
|
|||||
|
Net income (loss) attributable to noncontrolling interest
|
164,449
|
(279,926)
|
|||||
|
Change in accrued investment income
|
183,187
|
(374,590)
|
|||||
|
Change in reinsurance receivables
|
(159,987)
|
882,197
|
|||||
|
Change in policy liabilities and accruals
|
(1,080,084)
|
(508,213)
|
|||||
|
Charges for mortality and administration of
|
|||||||
|
universal life and annuity products
|
(2,034,801)
|
(2,043,696)
|
|||||
|
Interest credited to account balances
|
1,474,820
|
1,546,884
|
|||||
|
Change in income taxes receivable/payable
|
(1,628,284)
|
(475,046)
|
|||||
|
Change in other assets and liabilities, net
|
(590,396)
|
(4,882,371)
|
|||||
|
Net cash used in operating activities
|
(3,002,592)
|
(5,424,360)
|
|||||
|
Cash flows from investing activities:
|
|||||||
|
Proceeds from investments sold and matured:
|
|||||||
|
Fixed maturities available for sale
|
10,790,333
|
18,027,892
|
|||||
|
Equity securities
|
186,798
|
25,128,906
|
|||||
|
Trading securities
|
61,510,025
|
0
|
|||||
|
Mortgage loans
|
12,724,608
|
1,580,863
|
|||||
|
Real estate
|
870,000
|
27,850
|
|||||
|
Policy loans
|
940,143
|
1,005,165
|
|||||
|
Short-term
|
700,000
|
0
|
|||||
|
Total proceeds from investments sold and matured
|
87,721,907
|
45,770,676
|
|||||
|
Cost of investments acquired:
|
|||||||
|
Fixed maturities available for sale
|
(20,480,862)
|
(28,228,243)
|
|||||
|
Equity securities
|
0
|
(18,826,433)
|
|||||
|
Trading securities
|
(72,910,979)
|
0
|
|||||
|
Mortgage loans
|
(16,920,270)
|
0
|
|||||
|
Real estate
|
(97,020)
|
(715,865)
|
|||||
|
Policy loans
|
(831,189)
|
(946,355)
|
|||||
|
Total cost of investments acquired
|
(111,240,320)
|
(48,716,896)
|
|||||
|
Purchase of investment in unconsolidated affiliate
|
0
|
(1,000,000)
|
|||||
|
Purchase of property and equipment
|
(31,212)
|
(17,403)
|
|||||
|
Net cash used in investing activities
|
(23,549,625)
|
(3,963,623)
|
|||||
|
Cash flows from financing activities:
|
|||||||
|
Policyholder contract deposits
|
1,792,937
|
1,964,487
|
|||||
|
Policyholder contract withdrawals
|
(1,449,866)
|
(1,756,952)
|
|||||
|
Payments on notes payable
|
(1,208,335)
|
(1,188,484)
|
|||||
|
Purchase of treasury stock
|
(23,249)
|
(73,376)
|
|||||
|
Net cash used in financing activities
|
(888,513)
|
(1,054,325)
|
|||||
|
Net decrease in cash and cash equivalents
|
(27,440,730)
|
(10,442,308)
|
|||||
|
Cash and cash equivalents at beginning of period
|
37,492,843
|
39,995,875
|
|||||
|
Cash and cash equivalents at end of period
|
$ 10,052,113
|
$ 29,553,567
|
|||||
See accompanying notes.
UTG, INC. AND SUBSIDIARIES
Notes to Consolidated Financial Statements
|
1.
|
BASIS OF PRESENTATION
|
The accompanying consolidated financial statements have been prepared by UTG, Inc. (“UTG”) and its consolidated subsidiaries (“Company”) pursuant to the rules and regulations of the Securities and Exchange Commission. Although the Company believes the disclosures are adequate to make the information presented not be misleading, it is suggested that these consolidated financial statements be read in conjunction with the consolidated financial statements and the notes thereto presented in the Company’s Annual Report on Form 10-K filed with the Securities and Exchange Commission for the year ended December 31, 2009.
The information furnished reflects, in the opinion of the Company, all adjustments (which include only normal and recurring accruals) necessary for a fair presentation of the results of operations for the periods presented. Operating results for interim periods are not necessarily indicative of operating results to be expected for the year or of the Company’s future financial condition.
This document at times will refer to the Registrant’s largest shareholder, Mr. Jesse T. Correll and certain companies controlled by Mr. Correll. Mr. Correll holds a majority ownership of First Southern Funding LLC (“FSF”), a Kentucky corporation, and First Southern Bancorp, Inc. (“FSBI”), a financial services holding company. FSBI operates through its 100% owned subsidiary bank, First Southern National Bank (“FSNB”). Banking activities are conducted through multiple locations within south-central and western Kentucky. Mr. Correll is Chief Executive Officer and Chairman of the Board of Directors of UTG and is currently UTG’s largest shareholder through his ownership control of FSF, FSBI and affiliates. At March 31, 2010, Mr. Correll owns or controls directly and indirectly approximately 53% of UTG’s outstanding stock.
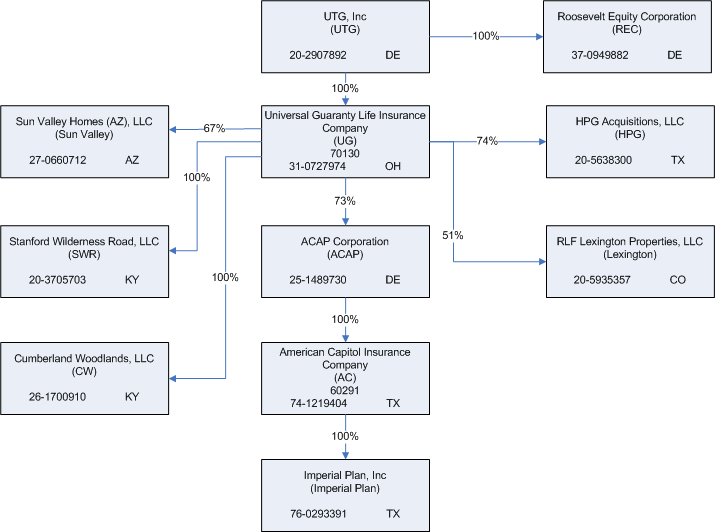
UTG, INC. AND SUBSIDIARIES
Notes to Consolidated Financial Statements - Continued
At March 31, 2010 consolidated subsidiaries of UTG, Inc. were as depicted on the following organizational chart:
|
2.
|
INVESTMENTS
|
|
A.
|
Available for Sale Securities
|
As of March 31, 2010 and December 31, 2009, fixed maturities available for sale represented 47% of total invested assets. The Company’s insurance subsidiaries are regulated by insurance statutes and regulations as to the type of investments they are permitted to make, and the amount of funds that may be used for any one type of investment. In light of these statutes and regulations, and the Company’s business and investment strategy, the Company generally seeks to invest in United States government and government agency securities and other high quality low risk investments. Some insurance companies have suffered significant losses in their investment portfolios in the last few years; however because of the Company’s conservative investment philosophy, the Company has avoided such significant losses.
At March 31, 2010, the carrying value of fixed maturity securities in default as to principal or interest was immaterial in the context of consolidated assets, shareholders’ equity or results from operations. The Company has identified securities it may sell and classified them as “investments available for sale”. Investments available for sale are carried at market, with changes in market value directly charged to shareholders’ equity. To provide additional flexibility and liquidity, the Company has categorized all fixed maturity investments as “investments available for sale”.
The amortized cost and estimated market values of investments in securities including investments held for sale are as follows:
|
Original or
|
Gross
|
Gross
|
||||||
|
March 31, 2010
|
Amortized
|
Unrealized
|
Unrealized
|
Market
|
||||
|
Cost
|
Gains
|
Losses
|
Value
|
|||||
|
Investments held for sale:
|
||||||||
|
Fixed maturities
|
||||||||
|
U.S. Government and govt.
|
||||||||
|
agencies and authorities
|
$
|
89,567,479
|
$
|
2,049,507
|
$
|
(1,740,276)
|
$
|
89,876,710
|
|
States, municipalities and
|
||||||||
|
political subdivisions
|
430,000
|
14,986
|
0
|
444,986
|
||||
|
Collateralized mortgage
|
||||||||
|
obligations
|
17,986,410
|
856,481
|
(20,731)
|
18,822,160
|
||||
|
Public utilities
|
905,574
|
71,199
|
0
|
976,773
|
||||
|
All other corporate bonds
|
39,305,899
|
1,884,261
|
(336,827)
|
40,853,333
|
||||
|
148,195,362
|
4,876,434
|
(2,097,834)
|
150,973,962
|
|||||
|
Equity securities
|
14,129,576
|
26,620
|
(1,257,356)
|
12,898,840
|
||||
|
Total
|
$
|
162,324,938
|
$
|
4,903,054
|
$
|
(3,355,190)
|
$
|
163,872,802
|
|
Securities of affiliate
|
$
|
5,000,000
|
$
|
90,253
|
$
|
0
|
$
|
5,090,253
|
|
December 31, 2009
|
Original or
Amortized
Cost
|
Gross
Unrealized
Gains
|
Gross
Unrealized
Losses
|
Market
Value
|
||||
|
Investments held for sale:
|
||||||||
|
Fixed maturities
|
||||||||
|
U.S. Government and govt.
agencies and authorities
|
$
|
73,298,975
|
$
|
1,773,136
|
$
|
(1,375,073)
|
$
|
73,697,038
|
|
States, municipalities and
political subdivisions
|
2,567,650
|
44,274
|
(192,776)
|
2,419,148
|
||||
|
Collateralized mortgage
obligations
|
17,992,385
|
829,076
|
0
|
18,821,461
|
||||
|
All other corporate bonds
|
44,821,388
|
1,443,401
|
(1,497,743)
|
44,767,046
|
||||
|
138,680,398
|
4,089,887
|
(3,065,592)
|
139,704,693
|
|||||
|
Equity securities
|
14,316,463
|
29,000
|
(1,022,141)
|
13,323,322
|
||||
|
Total
|
$
|
152,996,861
|
$
|
4,118,887
|
$
|
(4,087,733)
|
$
|
153,028,015
|
|
Securities of affiliate
|
$
|
5,000,000
|
$
|
57,762
|
$
|
0
|
$
|
5,057,762
|
The fair value of investments with sustained gross unrealized losses at March 31, 2010 and December 31, 2009 are as follows:
|
March 31, 2010
|
Less than 12 months
|
12 Months or longer
|
Total
|
|||||||||
|
Fair value
|
Unrealized
|
Fair value
|
Unrealized losses
|
Fair value
|
Unrealized losses
|
|||||||
|
losses
|
||||||||||||
|
U.S Government and govt. agencies and authorities
|
63,078,005
|
(1,740,275)
|
0
|
0
|
63,078,005
|
(1,740,275)
|
||||||
|
$
|
||||||||||||
|
Collateralized mortgage obligations
|
0
|
0
|
126,277
|
(20,731)
|
126,277
|
(20,731)
|
||||||
|
All other corporate bonds
|
10,424,166
|
(16,515)
|
2,163,752
|
(320,312)
|
12,587,918
|
(336,827)
|
||||||
|
Total fixed maturity
|
73,502,171
|
(1,756,790)
|
2,290,029
|
(341,043)
|
75,792,200
|
(2,097,833)
|
||||||
|
$
|
||||||||||||
|
Equity securities
|
0
|
0
|
4,481,827
|
(1,257,605)
|
4,481,827
|
(1,257,605)
|
||||||
|
$
|
||||||||||||
|
December 31, 2009
|
Less than 12 months
|
12 Months or longer
|
Total
|
||||||
|
Fair value
|
Unrealized
losses
|
Fair value
|
Unrealized losses
|
Fair value
|
Unrealized losses
|
||||
|
U.S Government and govt. agencies and authorities
|
$
|
46,581,332
|
(1,375,073)
|
0
|
0
|
46,581,332
|
(1,375,073)
|
||
|
States, municipalities and political subdivisions
|
0
|
0
|
1,247,224
|
(192,776)
|
1,247,224
|
(192,776)
|
|||
|
All other corporate bonds
|
12,305,039
|
(215,636)
|
2,514,618
|
(1,282,107)
|
14,819,657
|
(1,497,743)
|
|||
|
Total fixed maturity
|
$
|
58,886,371
|
(1,590,709)
|
3,761,842
|
(1,474,883)
|
62,648,213
|
(3,065,592)
|
||
|
Equity securities
|
$
|
908,010
|
(244,095)
|
4,474,508
|
(778,046)
|
5,382,518
|
(1,022,141)
|
||
The unrealized losses of fixed maturity investments were primarily due to financial market participants perception of increased risks associated with the current market environment, resulting in higher interest rates. The contractual terms of those investments do not permit the issuer to settle the securities at a price less than the amortized cost of the investment. The unrealized losses of equity investments were primarily caused by normal market fluctuations in publicly traded securities.
The publicly traded securities have had sustained unrealized losses ranging in time from just under fifteen months to approximately eighteen months. Publicly traded securities can remain undervalued for extended periods of time caused by market participant’s short-term perceptions. At those times, market price can significantly differ from underlying business fundamentals. Management takes into consideration such things as earnings performance, financial strength, business prospects, cash flows and other such items in evaluating equity investments on an individual basis. Based on our extensive review of each individual security, management expects to achieve a positive return on the securities as the market assigns a valuation more in line with company fundamentals over time. Taking these items into consideration, along with being long-term investors with the ability and intent to hold such securities; management does not consider these investments to be other-than-temporarily impaired.
The Company regularly reviews its investment portfolio for factors that may indicate that a decline in fair value of an investment is other than temporary. Based on an evaluation of the issues, including, but not limited to, intentions to sell or ability to hold the fixed maturity and equity securities with unrealized losses for a period of time sufficient for them to recover; the length of time and amount of the unrealized loss; and the credit ratings of the issuers of the investments, the Company held three fixed maturity investments as other-than-temporarily impaired at March 31, 2010 and December 31, 2009. Other-than-temporary impairments of $477,386 and $2,007,174 were taken in the first three months of 2010 and during the twelve months ended December 31, 2009, respectively. The other-than-temporary impairments during 2009 and 2010 were due to changes in expected future cash flows of investments in bonds backed by trust preferred securities of banks.
|
March 31, 2010
|
Beginning Amortized Cost
|
OTTI Credit Loss
|
Ending Amortized Cost
|
Unrealized Loss
|
Carrying Value
|
|
Lehman Brothers
|
$0
|
N/A
|
$0
|
N/A
|
$0
|
|
Preferred Term Securities I
|
$416,157
|
$(4,067)
|
$412,090
|
$(102,203)
|
$309,877
|
|
Preferred Term Securities II
|
$2,161,808
|
$(473,319)
|
$1,688,489
|
$(1,613,662)
|
$74,827
|
|
December 31, 2009
|
Beginning Amortized Cost
|
OTTI Credit Loss
|
Ending Amortized Cost
|
Unrealized Loss
|
Carrying Value
|
|
Lehman Brothers
|
$0
|
N/A
|
$0
|
N/A
|
$0
|
|
Preferred Term Securities I
|
$508,816
|
$(92,659)
|
$416,157
|
$(99,998)
|
$316,159
|
|
Preferred Term Securities II
|
$4,076,323
|
$(1,914,515)
|
$2,161,808
|
$(1,115,670)
|
$1,046,138
|
The amortized cost and estimated market value of debt securities at March 31, 2010, by contractual maturity, is shown below. Expected maturities will differ from contractual maturities because borrowers may have the right to call or prepay obligations with or without call or prepayment penalties.
|
Fixed Maturities Held for Sale
March 31, 2010
|
Amortized
Cost
|
Estimated
Market
Value
|
||
|
Due in one year or less
|
$
|
1,217,582
|
$
|
1,230,390
|
|
Due after one year through five years
|
14,605,752
|
15,488,171
|
||
|
Due after five years through ten years
|
38,680,056
|
41,020,712
|
||
|
Due after ten years
|
75,189,219
|
73,844,079
|
||
|
Collateralized mortgage obligations
|
18,502,753
|
19,390,610
|
||
|
Total
|
$
|
148,195,362
|
$
|
150,973,962
|
|
B.
|
Trading Securities
|
Securities designated as trading securities are reported at fair value, with gains or losses resulting from changes in fair value recognized in other income on the consolidated statements of operations. Trading securities include exchange-traded equities and exchange-traded equity options. The fair value of trading securities included in assets was $33,724,684 and $19,613,472 as of March 31, 2010 and December 31, 2009, respectively. The fair value of trading securities included in liabilities was $(13,227,485) and $(11,671,911) as of March 31, 2010 and December 31, 2009, respectively. Trading securities’ unrealized gains were $859,588 and $570,024 as of March 31, 2010 and December 31, 2009, respectively. Unrealized losses due to trading securities were $(898,269) and $(1,081,360) as of March 31, 2010 and December 31, 2009, respectively. Trading securities carried as liabilities are securities sold short. A gain, limited to the price at which the security was sold short, or a loss, potentially unlimited in size, will be recognized upon the termination of the short sale. Realized gains (losses) from trading securities were $(340,909) and $525,000 as of March 31, 2010 and December 31, 2009, respectively. Trading securities are classified in cash flows from operating activities. Trading revenue charged to net income from trading securities was:
|
Trading Revenue Included in Other Income
|
||
|
March 31, 2010
|
December 31, 2009
|
|
|
Type of Instrument
|
Net Realized and Unrealized
Gains (Losses)
|
Net Realized and Unrealized
Gains (Losses)
|
|
Equity
|
$(379,590)
|
$13,667
|
|
C.
|
Derivatives
|
As of March 31, 2010, the Company held derivative instruments in the form of exchange-traded equity options. The Company currently does not designate derivatives as hedging instruments. Exchange-traded equity options are combined with exchange-traded equity securities in the Company’s trading portfolio, with the primary objective of generating a fair return while reducing risk. These derivatives are carried at fair value, with unrealized gains and losses recognized in other income. The fair value of derivatives included in trading security assets and trading security liabilities as of March 31, 2010 was $868,763 and $(7,606,740), respectively. Realized gains (losses) due to derivatives were $(340,909) and $525,000 as of March 31, 2010 and December 31, 2009, respectively. Unrealized gains (losses) included in trading security assets due to derivatives were $(10,440) and $110,013 as of March 31, 2010 and December 31, 2009, respectively. Unrealized losses included in trading security liabilities due to derivatives were $(313,281) and $(432,720) as of March 31, 2010 and December 31, 2009, respectively.
|
D.
|
Mortgages
|
The Company held mortgage loans on real estate in the amount of $65,467,046 and $61,271,384 at March 31, 2010 and December 31, 2009, respectively. Included in the amounts are discounted commercial mortgage loans with a carrying value of $45,388,746 and $35,224,022 with contractually required payments receivable of $153,781,441 and $118,368,661 at March 31, 2010 and December 31, 2009, respectively. Carrying value and fair value are considered approximately equal as these loans were purchased recently in arm’s length transactions. At March 31, 2010 and December 31, 2009, $90,777,492 and $70,448,044 in cash flows were expected to be collected. The Company currently accounts for discounted commercial mortgage loans on a cash basis until a reasonable history is established. Management is currently analyzing the effects of ASC 310-30 as it relates to discounted mortgage loans. The amortization of the discount is immaterial.
|
3.
|
NOTES PAYABLE
|
At March 31, 2010 and December 31, 2009, the Company had $13,194,554 and $14,402,889 of long-term debt outstanding, respectively.
On December 8, 2006, UTG borrowed funds from First Tennessee Bank National Association through execution of an $18,000,000 promissory note. The note is secured by the pledge of 100% of the common stock of UG. The promissory note carries a variable rate of interest based on the 3 month LIBOR rate plus 180 basis points. Interest is payable quarterly. Principal is payable annually beginning at the end of the second year in five installments of $3,600,000. The loan matures on December 7, 2012. The Company borrowed $0 and has made $0 in principal payments in 2010. At March 31, 2010 the outstanding principal balance on this debt was $10,491,762. The next required principal payment on this debt is due in December of 2010.
In addition to the above promissory note, First Tennessee Bank National Association also provided UTG, Inc. with a $5,000,000 revolving credit note. This note is for a one-year term and may be renewed by consent of both parties. The credit note is to provide operating liquidity for UTG, Inc. and replaces a previous line of credit provided by Southwest Bank. Interest bears the same terms as the above promissory note. The collateral held on the above note also secures this credit note. During 2010, the Company had no borrowings from the note. At March 31, 2010, the Company had no outstanding balance attributable to this note.
In November 2007, UG became a member of the Federal Home Loan Bank (“FHLB”). This membership allows the Company access to additional credit up to a maximum of 50% of the total assets of UG. To be a member of the FHLB, the Company was required to purchase shares of common stock of FHLB. Borrowing capacity is based on 50 times each dollar of stock acquired in FHLB above the “base membership” amount. The Company’s current LOC with the FHLB is $15,000,000. During 2010, the Company had no borrowings against this LOC. At March 31, 2010 the Company had no outstanding balance attributable to this LOC.
In January 2007, UG became a 51% owner of the newly formed RLF Lexington Properties LLC (“Lexington”). The entity was formed to hold, for investment purposes, certain investment real estate acquired. As part of the purchase price of the real estate owned by Lexington, the seller provided financing through the issuance of five promissory notes of $1,200,000 each totaling $6,000,000. The notes bear interest at the fixed rate of 5%. The notes came due beginning on January 5, 2008, and each January 5 thereafter until 2012 when the final note is repaid. As of March 31, 2010 the outstanding balance was $2,400,000.
On February 7, 2007, HPG Acquisitions (“HPG”), a 74% owned affiliate of the Company, borrowed funds from First National Bank of Midland, through execution of a $373,862 promissory note. The note is secured by real estate owned by HPG. The note bears interest at a fixed rate of 5%. The first payment was due January 15, 2008. There will be 119 regular payments of $3,965 followed by one irregular last payment estimated at $44,125. At March 31, 2010, the outstanding balance on this debt was $302,792.
The consolidated scheduled principal reductions on the notes payable for the next five years are as follows:
|
Year
|
Amount
|
|
|
2010
|
$
|
4,824,978
|
|
2011
|
4,827,008
|
|
|
2012
|
4,520,969
|
|
|
2013
|
31,586
|
|
|
2014
|
34,154
|
|
4.
|
CAPITAL STOCK TRANSACTIONS
|
|
A.
|
Stock Repurchase Program
|
On June 5, 2001, the Board of Directors of UTG authorized the repurchase in the open market or in privately negotiated transactions of up to $1 million of UTG's common stock. On June 16, 2004, an additional $1 million was authorized for repurchasing shares. On April 18, 2006, an additional $1 million was authorized for repurchasing shares. Repurchased shares are available for future issuance for general corporate purposes. This program can be terminated at any time. Open market purchases are generally limited to a maximum per share price of $8.00. Through April 2010, UTG has spent $2,886,163 in the acquisition of 414,412 shares under this program.
|
B.
|
Earnings Per Share Calculations
|
Earnings per share are based on the weighted average number of common shares outstanding during each period, retroactively adjusted to give effect to all stock splits, in accordance with Statement of Financial Accounting Standards No. 128 (see FASB Codification 200-10-Sections 5, 10, 15, 45, 55, and 60.) At March 31, 2010, diluted earnings per share were the same as basic earnings per share since the Company had no dilutive instruments outstanding.
|
5.
|
COMMITMENTS AND CONTINGENCIES
|
The insurance industry has experienced a number of civil jury verdicts which have been returned against life and health insurers in the jurisdictions in which the Company does business involving the insurers' sales practices, alleged agent misconduct, failure to properly supervise agents, and other matters. Some of the lawsuits have resulted in the award of substantial judgments against the insurer, including material amounts of punitive damages. In some states, juries have substantial discretion in awarding punitive damages in these circumstances. In the normal course of business, the Company is involved from time to time in various legal actions and other state and federal proceedings. Management is of the opinion that the ultimate disposition of the matters will not have a materially adverse effect on the Company’s results of operations or financial position.
Under the insurance guaranty fund laws in most states, insurance companies doing business in a participating state can be assessed up to prescribed limits for policyholder losses incurred by insolvent or failed insurance companies. Although the Company cannot predict the amount of any future assessments, most insurance guaranty fund laws currently provide that an assessment may be excused or deferred if it would threaten an insurer's financial strength. Mandatory assessments may be partially recovered through a reduction in future premium tax in some states. The Company does not believe such assessments will be materially different from amounts already provided for in the financial statements, though the Company has no control over such assessments.
UG had an unresolved dispute with one of its outside reinsurers. The issue related to reinsurance premiums. The reinsurer claimed UG owed for years 2005 through 2007 in the amount of $987,000. In early 2008, the reinsurer billed UG for these amounts, providing no information or explanation. The related treaty was originally with another outside reinsurer and was acquired by the current reinsurer in a reinsurance block acquisition. The treaty is a yearly renewable term (“YRT”) cession based treaty. UG maintained it had no liability relating to the back billed premium. UG initiated arbitration according to the treaty to bring resolution to this matter. UG established a contingent liability of $550,000 relating to this matter to cover costs including legal and arbitration costs. On April 21, 2010, the arbitration panel rendered its decision relating to the above dispute. The panel’s decision is final and binding. The net effect to the financial statements of the Company will be an additional expense of $26,836. Both parties have been given 30 days from the ruling date to complete the cash transfers relative to this matter.
As part of the Texas Imperial Life Insurance Company sale, the Company remains contingently liable for certain costs pending the outcome of an ongoing race-based audit on Texas Imperial Life Insurance Company by the Texas Department of Insurance. Under the agreement, the Company is responsible for 100% of the first $50,000 of costs, 90% of the next $50,000, 75% of the third $50,000 and 50% of the costs above $150,000. Management has conservatively estimated the Company’s exposure and other costs at $50,000 based on information provided to date from the examination team and has established a contingent liability in its financial statements of this amount.
|
6.
|
OTHER CASH FLOW DISCLOSURE
|
On a cash basis, the Company paid $93,508 and $161,537 in interest expense during the first three months of 2010 and 2009, respectively. The Company paid $0 in federal income tax during the first three months of 2010 and 2009, respectively.
|
7.
|
CONCENTRATION OF CREDIT RISK
|
The Company maintains cash balances in financial institutions that at times may exceed federally insured limits. The Company maintains its primary operating cash accounts with First Southern National Bank, an affiliate of the largest shareholder of UTG, Mr. Jesse Correll, the Company’s CEO and Chairman. The Company has not experienced any losses in such accounts and believes it is not exposed to any significant credit risk on cash and cash equivalents.
|
8.
|
COMPREHENSIVE INCOME
|
|
Tax
|
|||||||
|
Before-Tax
|
(Expense)
|
Net of Tax
|
|||||
|
March 31, 2010
|
Amount
|
or Benefit
|
Amount
|
||||
|
Unrealized holding gains during
|
|||||||
|
period
|
$
|
790,480
|
$
|
(276,668)
|
$
|
513,812
|
|
|
Less: reclassification adjustment
|
|||||||
|
for losses realized in net income
|
(403,769)
|
141,319
|
(262,450)
|
||||
|
Change in other comprehensive income
|
$
|
386,711
|
$
|
(135,349)
|
$
|
251,362
|
|
9.
|
FAIR VALUE MEASUREMENTS
|
Effective January 1, 2008, the Company adopted SFAS 157 which requires enhanced disclosures of assets and liabilities carried at fair value. (See FASB Codification 820-10 Sections 5, 15, 30, 35, 50, 55, and 65) SFAS 157 established a hierarchical disclosure framework based on the priority of the inputs to the respective valuation technique. The fair value hierarchy gives the highest priority to quoted prices in active markets for identical assets or liabilities (Level 1) and the lowest priority to unobservable inputs (Level 3). An asset or liability’s classification within the fair value hierarchy is based on the lowest level of significant input to its valuation. SFAS 157 defines the input levels as follows:
Level 1 – Unadjusted quoted prices in active markets for identical assets or liabilities. U.S. treasuries are in Level 1 and valuation is based on unadjusted quoted prices for identical assets in active markets that the Company can access. Equity securities and options that are actively traded and exchange listed in the U.S. are also included in Level 1. Equity security valuation is based on unadjusted quoted prices for identical assets in active markets that the Company can access.
Level 2 - Quoted prices in markets that are not active or inputs that are observable either directly or indirectly. Level 2 inputs include quoted prices for similar assets or liabilities other than quoted prices in Level 1; quoted prices in markets that are not active; or other inputs that are observable or can be derived principally from or corroborated by observable market data for substantially the full term of the assets or liabilities. Level 2 assets consist of fixed income investments valued based on quoted prices for identical or similar assets in markets that are not active and investments carried as equity securities that do not have an actively traded market that are valued based on their audited GAAP book value.
Level 3 - Unobservable inputs that are supported by little or no market activity and are significant to the fair value of the assets or liabilities. Unobservable inputs reflect the reporting entity’s own assumptions about the assumptions that market participants would use in pricing the asset or liability. Level 3 assets and liabilities include financial instruments whose values are determined using pricing models, discounted cash flow methodologies, or similar techniques, as well as instruments for which the determination of fair value requires significant management judgment or estimation. The Company does not have any Level 3 financial assets or liabilities.
The following table presents the level within the hierarchy at which the Company’s financial assets and financial liabilities are measured on a recurring basis as of March 31, 2010.
|
Level 1
|
Level 2
|
Level 3
|
Total
|
|||||
|
Assets
|
||||||||
|
Fixed Maturities, available for sale
|
$
|
6,831,564
|
$
|
144,142,398
|
$
|
0
|
$
|
150,973,962
|
|
Equity Securities, available for sale
|
15,467,269
|
2,521,824
|
0
|
17,989,093
|
||||
|
Trading Securities
|
33,724,684
|
0
|
0
|
33,724,684
|
||||
|
Total Financial Assets
Carried at Fair Value
|
$
|
56,023,517
|
$
|
146,664,222
|
$
|
0
|
$
|
202,687,739
|
|
Level 1
|
Level 2
|
Level 3
|
Total
|
|||||
|
Liabilities
|
||||||||
|
Trading Securities
|
$
|
13,227,485
|
$
|
0
|
$
|
0
|
$
|
13,227,485
|
The financial statements include various estimated fair value information at March 31, 2010 and December 31, 2009, as required by Statement of Financial Accounting Standards 107, Disclosure about Fair Value of Financial Instruments (SFAS 107, See FASB Codification 825-10 Sections 50, 55, 60). Such information, which pertains to the Company's financial instruments, is based on the requirements set forth in that Statement and does not purport to represent the aggregate net fair value of the Company.
The following methods and assumptions were used to estimate the fair value of each class of financial instrument required to be valued by SFAS 107 (see FASB Codification 825-10 Sections 50, 55, 60) for which it is practicable to estimate that value:
(a) Cash and cash equivalents
The carrying amount in the financial statements approximates fair value because of the relatively short period of time between the origination of the instruments and their expected realization.
(b) Fixed maturities and investments available for sale
The Company utilized a pricing service to estimate fair value measurements for its fixed maturities and public common and preferred stocks. The pricing service utilizes market quotations for securities that have quoted market prices in active markets. Since fixed maturities other than U.S. Treasury securities generally do not trade on a daily basis, the pricing service prepares estimates of fair value measurements using relevant market data, benchmark curves, sector groupings and matrix pricing. As the fair value estimates of most fixed maturity investments are based on observable market information rather than market quotes, the estimates of fair value other than U.S. Treasury securities are included in Level 2 of the hierarchy. U.S. Treasury securities are included in the amount disclosed in Level 1 as the estimates are based on unadjusted prices. The Company’s Level 2 investments include obligations of U.S. government agencies, municipal bonds, corporate debt securities and other mortgage backed securities.
(c) Trading securities
Securities designated as trading securities are reported at fair value, with gains or losses resulting from changes in fair value recognized in earnings. Trading securities include exchange-traded equities and exchange-traded equity options.
(d) Mortgage loans on real estate
The fair values of mortgage loans are estimated using discounted cash flow analyses and interest rates being offered for similar loans to borrowers with similar credit ratings.
(e) Policy loans
It is not practical to estimate the fair value of policy loans as they have no stated maturity and their rates are set at a fixed spread to related policy liability rates. Policy loans are carried at the aggregate unpaid principal balances in the consolidated balance sheets, and earn interest at rates ranging from 4% to 8%. Individual policy liabilities in all cases equal or exceed outstanding policy loan balances.
(f) Short-term investments
Quoted market prices, if available, are used to determine the fair value. If quoted market prices are not available, management estimates the fair value based on the quoted market price of a financial instrument with similar characteristics.
(g) Notes payable
For borrowings subject to floating rates of interest, carrying value is a reasonable estimate of fair value. For fixed rate borrowings fair value is determined based on the borrowing rates currently available to the Company for loans with similar terms and average maturities.
The estimated fair values of the Company's financial instruments required to be valued by SFAS 107 (See Codification 825-10 Sections 50, 55, 60) are as follows as of March 31:
|
2010
|
2009
|
||||||||||||||
|
Assets
|
Carrying
Amount
|
Estimated
Market
Value
|
Carrying
Amount
|
Estimated
Market
Value
|
|||||||||||
|
Fixed maturities available for sale
|
$
|
150,973,962
|
$
|
150,973,962
|
$
|
139,704,693
|
$
|
139,704,693
|
|||||||
|
Equity securities
|
12,898,840
|
12,898,840
|
13,323,322
|
13,323,322
|
|||||||||||
|
Trading securities
|
33,724,684
|
33,724,684
|
19,613,472
|
19,613,472
|
|||||||||||
|
Securities of affiliate
|
5,090,253
|
5,090,253
|
5,057,762
|
5,057,762
|
|||||||||||
|
Mortgage loans on real estate
|
65,467,046
|
65,837,725
|
61,271,384
|
61,618,488
|
|||||||||||
|
Policy loans
|
14,234,652
|
14,234,652
|
14,343,606
|
14,343,606
|
|||||||||||
|
Liabilities
|
|||||||||||||||
|
Notes payable
|
13,194,554
|
13,100,899
|
14,402,889
|
14,267,364
|
|||||||||||
|
Trading securities
|
13,227,485
|
13,227,485
|
11,671,911
|
11,671,911
|
|||||||||||
|
10.
|
NEW ACCOUNTING STANDARDS
|
||||||||||||||
Recently there has been an increase in the number of modifications of acquired loans that fall under the scope of the FASB Accounting Standards Codification TM Subtopic 310-30, Receivables—Loans and Debt Securities Acquired with Deteriorated Credit Quality. Subtopic 310-30 provides guidance on accounting for acquired loans that have evidence of credit deterioration upon acquisition. Paragraph 310-30-15-6 allows acquired assets with common risk characteristics to be accounted for in the aggregate as a pool. Upon establishment of the pool, the pool becomes the unit of accounting. When loans are accounted for as a pool, the purchase discount is not allocated to individual loans; thus, all of the loans in the pool accrete at a single pool rate (based on cash flow projections for the pool). Under Subtopic 310-30, the impairment analysis also is performed on the pool as a whole as opposed to each individual loan. Paragraphs 310-40-15-4 through 15-12 establish the criteria for evaluating whether a loan modification should be classified as a troubled debt restructuring. Specifically, paragraph 310-40-15-5 states that “a restructuring of a debt constitutes a troubled debt restructuring for purposes of this Subtopic if the creditor, for economic or legal reasons related to the debtor’s financial difficulties, grants a concession to the debtor that it would not otherwise consider”. Diversity in practice has developed on whether a loan that is part of a pool of loans accounted for as a single asset should be removed from that pool upon a modification that would constitute a troubled debt restructuring. In the view of certain entities, accounting for troubled debt restructuring does not apply to individual loans within a pool, and modified loans should remain within the pool. In the view of other entities, each modified loan should be evaluated against the troubled debt restructuring criteria, and if the loan modification is a troubled debt restructuring, the modified loan should be removed from the pool and accounted for as a separate asset. The objective of the amendments in this Update is to address the diversity in practice regarding such modifications. Management has determined that this Statement will not result in a change to current practice.
The Financial Accounting Standards Board (“FASB”) issued the Accounting Standards Update (“ASU”) No. 2010-10 Consolidation (Topic 810), Amendments for Certain Investment Funds. The amendments to the consolidation requirements of Topic 810 resulting from the issuance of Statement 167 are deferred for a reporting entity’s interest in an entity (1) that has all the attributes of an investment company or (2) for which it is industry practice to apply measurement principles for financial reporting purposes that are consistent with those followed by investment companies. The deferral does not apply in situations in which a reporting entity has the explicit or implicit obligation to fund losses of an entity that could potentially be significant to the entity. The deferral also does not apply to interests in securitization entities, asset-backed financing entities, or entities formerly considered qualifying special purpose entities. In addition, the deferral applies to a reporting entity’s interest in an entity that is required to comply or operate in accordance with requirements similar to those in Rule 2a-7 of the Investment Company Act of 1940 for registered money market funds. An entity that qualifies for the deferral will continue to be assessed under the overall guidance on the consolidation of variable interest entities in Subtopic 810-10 (before the Statement 167 amendments) or other applicable consolidation guidance, such as the guidance for the consolidation of partnerships in Subtopic 810-20. The amendments in this Update also clarify that for entities that do not qualify for the deferral, related parties should be considered when evaluating each of the criteria in paragraph 810-10-55-37, as amended by Statement 167, for determining whether a decision maker or service provider fee represents a variable interest. In addition, the requirements for evaluating whether a decision maker’s or service provider’s fee is a variable interest are modified to clarify the Board’s intention that a quantitative calculation should not be the sole basis for this evaluation. The amendments in this update are effective as of the beginning of a reporting entity’s first annual period that begins after November 15, 2009, and for interim periods within that first annual reporting period. Management has determined that this Statement will not result in a change to current practice.
In February 2010, Financial Accounting Standards Board ("FASB") issued Accounting Standards Update ("ASU") 2010-09, Subsequent Events (Topic 855) Amendments to Certain Recognition and Disclosure Requirements, which amends disclosure requirements within Subtopic 855-10. An entity that is an SEC filer is not required to disclose the date through which subsequent events have been evaluated. This change alleviates potential conflicts between Subtopic 855-10 and the SEC's requirements. ASU 2010-09 is effective upon issuance. The adoption of ASU 2010-09 did not have a material impact on the Company's consolidated financial statements.
In January 2010, FASB issued ASU 2010-06, Improving Disclosures about Fair Measurements, which provides amendments to subtopic 820-10 that require separate disclosure of significant transfers in and out of Level 1 and Level 2 fair value measurements and the presentation of separate information regarding purchases, sales, issuances and settlements for Level 3 fair value measurements. Additionally, ASU 2010-06 provides amendments to subtopic 820-10 that clarify existing disclosures about the level of disaggregation and inputs and valuation techniques. ASU 2010-06 is effective for financial statements issued for interim and annual periods ending after December 15, 2009, except for the disclosures about purchases, sales, issuances and settlements in the rollforward of activity in Level 3 fair value measurements, which are effective for interim and annual periods ending after December 15, 2010. The Company does not expect the adoption of ASU 2010-06 to have a material impact on its consolidated financial statements.
In January 2010, FASB issued ASU 2010-02, Accounting and Reporting for Decreases in Ownership of a Subsidiary- a Scope Clarification, which addresses the accounting for noncontrolling interests and changes in ownership interests of a subsidiary. ASU 2010-02 is effective for the interim or annual reporting periods ending on or after December 15, 2009, and must be applied retrospectively to interim or annual reporting periods beginning on or after December 15, 2008. The adoption of ASU 2010-02 did not have an impact on the Company's consolidated financial statements.
|
11.
|
SUBSEQUENT EVENT
|
On April 21, 2010, the arbitration panel rendered its decision relating to a dispute with an outside reinsurer regarding back billed reinsurance premiums. The panel’s decision is final and binding. The net effect to the financial statements of the Company is an additional expense of $26,836. Both parties have been given 30 days from the ruling date to complete the cash transfers relative to this matter.
ITEM 2. MANAGEMENT'S DISCUSSION AND ANALYSIS OF FINANCIAL CONDITION AND RESULTS OF OPERATIONS
The purpose of this section is to discuss and analyze the Company's consolidated results of operations, financial condition and liquidity and capital resources. This analysis should be read in conjunction with the consolidated financial statements and related notes that appear elsewhere in this report. The Company reports financial results on a consolidated basis. The consolidated financial statements include the accounts of UTG and its subsidiaries at March 31, 2010.
Cautionary Statement Regarding Forward-Looking Statements
Any forward-looking statement contained herein or in any other oral or written statement by the Company or any of its officers, directors or employees is qualified by the fact that actual results of the Company may differ materially from any such statement due to the following important factors, among other risks and uncertainties inherent in the Company's business:
|
1.
|
Prevailing interest rate levels, which may affect the ability of the Company to sell its products, the market value of the Company's investments and the lapse ratio of the Company's policies, notwithstanding product design features intended to enhance persistency of the Company's products.
|
|
|
2.
|
Changes in the federal income tax laws and regulations which may affect the relative tax advantages of the Company's products.
|
|
|
3.
|
Changes in the regulation of financial services, including bank sales and underwriting of insurance products, which may affect the competitive environment for the Company's products.
|
|
|
4.
|
Other factors affecting the performance of the Company, including, but not limited to, market conduct claims, insurance industry insolvencies, insurance regulatory initiatives and developments, stock market performance, an unfavorable outcome in pending litigation, and investment performance.
|
Update on Critical Accounting Policies
In our Form 10-K for the year ended December 31, 2009, we identified the accounting policies that are critical to the understanding of our results of operations and our financial position. They relate to deferred acquisition costs (DAC), cost of insurance acquired, assumptions and judgments utilized in determining if declines in fair values of investments are other-than-temporary, and valuation methods for investments that are not actively traded.
We believe that these policies were applied in a consistent manner during the first three months of 2010.
Results of Operations
|
(a)
|
Revenues
|
The Company experienced a decrease of approximately $1,042,000 in premiums and policy fee revenues, net of reinsurance premiums and policy fees, when comparing the first three months of 2010 to the same period in 2009. Unless the Company acquires a block of in-force business management expects premium revenue to continue to decline on the existing block of business at a rate consistent with prior experience.
The Company’s primary source of new business production comes from internal conservation efforts. Several of the customer service representatives of the Company are also licensed insurance agents, allowing them to offer other products within the Company’s portfolio to existing customers. Additionally, efforts continue to be made in policy retention through more personal contact with the customer including telephone calls to discuss alternatives and reasons for a customer’s request to surrender their policy.
Net investment income increased approximately 25% when comparing the first three months of 2010 to the same period in 2009. During 2008 and 2009, management took steps to avoid catastrophic future losses by culling its investment portfolio. As part of this portfolio evaluation process, certain investments were subsequently sold, particularly during the third and fourth quarters of 2008 and early 2009. This resulted in a higher cash balance earning extremely low rates of interest which had an immediate impact on income. With preservation of capital being of utmost concern, Management sat on this large cash balance waiting for the dust to settle and for opportunities with margin of safety to appear. This patience has been rewarded and the Company began to deploy cash into investments deemed appropriate during the latter part of 2009. The majority of this money has been invested in fixed maturity investments and discounted mortgage loans. With the economy reeling, bankruptcies soaring and general credit drying-up, the banking industry has been under well-known pressure. As bank failures increased dramatically, their loan portfolios have been auctioned off, sometimes at deep discounts. The Company held approximately $35,000,000 of these loans at the end of 2009, primarily purchased during the fourth quarter of 2009. With excess cash being invested, management believes the Company is well positioned and investment income should continue to improve during 2010.
During the fourth quarter of 2009, the Company began purchasing discounted commercial mortgage loans. As of December 31, 2009, the Company had acquired approximately $118,000,000 of mortgage loans at a total cost of about $35,000,000, representing an average purchase price to outstanding loan of almost 30%. As of December 31, 2009, the Company had already recorded approximately $1,000,000 in income from this loan activity. As of March 31, 2010, the Company held almost $154,000,000 of these loans at a total cost of about $45,000,000, representing an average purchase price to outstanding loan of about 29%. During the first three months of the year, the Company has received approximately $2,500,000 in income from these loans. Management has extensive background and experience in the analysis and valuation of commercial real estate and believes there are significant opportunities currently available in this arena. Experienced personnel of FSNB have also been utilized in the analysis phase. This experience dates back to discounted loans during the Resolution Trust days where such loans were being sold from defunct savings and loans in the early 1990’s. The discounted loans are available through the FDIC sale of assets of closed banks and from banks wanting to reduce their loan portfolios. The loans are available on a loan by loan bid process. Prior to placing a bid, each loan is reviewed to determine interest level utilizing such information as type of collateral, location of collateral, interest rate, current loan status and available cash flows or other sources of repayment. Once it is determined interest in the loan remains, the collateral is physically inspected. Following physical inspection, if interest still remains, a bid price is determined and a bid is submitted.
The Company's investments are generally managed to match related insurance and policyholder liabilities. The comparison of investment return with insurance or investment product crediting rates establishes an interest spread. The Company monitors investment yields, and when necessary adjusts credited interest rates on its insurance products to preserve targeted interest spreads, ranging from 1% to 2%. Interest crediting rates on adjustable rate policies have been reduced to their guaranteed minimum rates, and as such, cannot lower them any further. Policy interest crediting rate changes and expense load changes become effective on an individual policy basis on the next policy anniversary. Therefore, it takes a full year from the time the change was determined for the full impact of such change to be realized. If interest rates decline in the future, the Company won’t be able to lower rates and both net investment income and net income will be impacted negatively.
The Company had net realized investment losses of $(262,450) in the first three months of 2010 compared to net realized investment losses of $(126,868) for the same period in 2009. At the end of 2009, the Company held a fixed income investment backed with trust preferred securities that had an other-than-temporary impairment. During the first quarter of 2010, an additional impairment was recognized on this security of approximately $(477,000). The investment losses for the first quarter of 2009 were the result of a portfolio evaluation process, which resulted in selling investments deemed too risky for the weakened economic environment.
Management continues to view the Company’s investment portfolio with utmost priority. Significant time has been spent internally researching the Company’s risk and communicating with outside investment advisors about the current investment environment and ways to ensure preservation of capital and mitigate any losses. Management has put extensive efforts into evaluating the investment holdings. Additionally, members of the Company’s board of directors and investment committee have been solicited for advice and provided with information. Management has reviewed the Company’s entire portfolio on a security level basis to be sure all understand our holdings, potential risks and underlying credit supporting the investments. Management intends to continue its close monitoring of its bond holdings and other investments for additional deterioration or market condition changes. Future events may result in Management’s determination certain current investment holdings may need to be sold which could result in gains or losses in future periods. Such future events could also result in other than temporary declines in value that could result in future period impairment losses.
There are a number of significant risks and uncertainties inherent in the process of monitoring impairments and determining if impairment is other-than-temporary. These risks and uncertainties related to management’s assessment of other than temporary declines in value include but are not limited to: the risk that Company's assessment of an issuer's ability to meet all of its contractual obligations will change based on changes in the credit characteristics of that issuer; the risk that the economic outlook will be worse than expected or have more of an impact on the issuer than anticipated; the risk that fraudulent information could be provided to the Company's investment professionals who determine the fair value estimates.
Other income primarily represented revenues received relating to the performance of administrative work as a TPA for unaffiliated life insurance companies, which has remained consistent over the periods presented. The Company receives monthly fees based on policy in force counts and certain other activity indicators such as number of policies issued. The Company has not had any substantial change in its TPA client base or activity related fees of existing clients during the periods presented in the financial statements. Management remains committed to the pursuit of additional TPA clients and believes this area continues to show potential for growth.
|
(b)
|
Expenses
|
Life benefits, claims and settlement expenses net of reinsurance benefits and claims, decreased approximately 33% in the first three months of 2010 compared to the same period in 2009. Policy claims vary from period to period and therefore, fluctuations in mortality are to be expected and are not considered unusual by management. Overall, reserves continue to increase on in-force policies as the average age of the insured increases.
Commissions and amortization of deferred policy acquisition costs decreased approximately $244,000 in the first three months of 2010 compared to the same period in 2009. AC reinsurance agreements that are in place with outside companies drive the majority of this number. Another significant factor is attributable to the Company paying fewer commissions since the Company writes very little new business and renewal premiums on existing business continue to decline. Most of the Company’s agent agreements contained vesting provisions, which provide for continued compensation payments to agents upon their termination subject to certain minimums and often limited to a specific period of time. Another factor is attributable to normal amortization of the deferred policy acquisition costs asset. The Company reviews the recoverability of the asset based on current trends and known events compared to the assumptions used in the establishment of the original asset. No impairments were recorded in any of the periods presented.
Amortization of cost of insurance acquired decreased approximately 70%, or $771,000, in the first quarter comparison. AC’s cost of insurance acquired balance decreased approximately 23% at the end of 2009 due to the sale of its then wholly owned subsidiary Texas Imperial Life Insurance Company. UG’s cost of insurance acquired fully amortized at the end of 2009. UG’s amortization during the first quarter of 2009 was approximately $638,000.
Operating expenses increased approximately 9% in the first three months of 2010 compared to the same period in 2009. A large portion of this increase was due to travel expenses related to the purchase of discounted commercial loans.
Interest expense decreased approximately 30% in the first three months of 2010 compared to the same period in 2009 due to the general decline in interest rates. The interest rate is variable on the majority of the Company’s debt and was 2.19% and 3.66% during the first three months of 2010 and 2009, respectively.
|
(c)
|
Net Income
|
The Company had net income of $335,191 in the first three months of 2010 compared to a net loss of $(1,269,509) for the same period in 2009. The net income compared to net loss last year is mainly attributable to higher investment income, lower claims, and lower amortizations.
Financial Condition
Total shareholders’ equity increased approximately $655,000 as of March 31, 2010 compared to December 31, 2009. The increase is primarily attributable to net income.
Investments represent approximately 75% and 68% of total assets at March 31, 2010 and December 31, 2009, respectively. Accordingly, investments are the largest asset group of the Company. The Company's insurance subsidiaries are regulated by insurance statutes and regulations as to the type of investments that they are permitted to make and the amount of funds that may be used for any one type of investment. In light of these statutes and regulations, the majority of the Company’s investment portfolio is invested in high quality, low risk investments.
As of March 31, 2010, the carrying value of fixed maturity securities in default as to principal or interest was immaterial in the context of consolidated assets, shareholders’ equity or results from operations. To provide additional flexibility and liquidity, the Company has identified all fixed maturity securities as "investments held for sale". Investments held for sale are carried at market, with changes in market value charged directly to shareholders' equity.
Liquidity and Capital Resources
The Company has three principal needs for cash - the insurance companies' contractual obligations to policyholders, the payment of operating expenses and debt service. Cash and cash equivalents as a percentage of total assets were approximately 2% and 9% as of March 31, 2010, and December 31, 2009, respectively. Fixed maturities as a percentage of total assets were approximately 35% and 32% as of March 31, 2010 and December 31, 2009, respectively.
The Company currently has access to funds for operating liquidity. UTG has a $5,000,000 revolving credit note with First Tennessee Bank National Association. UG is a member of the FHLB which allows UG access to credit. UG’s current line of credit with the FHLB is $15,000,000. At March 31, 2010, there were no outstanding borrowings attributable to the lines of credit.
Future policy benefits are primarily long-term in nature and therefore, the Company's investments are predominantly in long-term fixed maturity investments such as bonds and mortgage loans which provide sufficient return to cover these obligations.
Many of the Company's products contain surrender charges and other features which reward persistency and penalize the early withdrawal of funds. With respect to such products, surrender charges are generally sufficient to cover the Company's unamortized deferred policy acquisition costs with respect to the policy being surrendered.
Net cash used in operating activities was $(3,002,592) and $(5,424,360) for the three months ending March 31, 2010 and 2009, respectively.
Net cash used in investing activities was $(23,549,625) and $(3,963,623) for the three month period ending March 31, 2010 and 2009, respectively. During the first quarter excess cash was invested, primarily into fixed maturity investments and discounted commercial mortgage loans. The Company’s trading portfolio involved frequent activity and also accounted for a large portion of investing activity. The trading portfolio is designed to provide a reasonable return with an emphasis on risk management.
Net cash used in financing activities was $(888,513) and $(1,054,325) for the three month period ending March 31, 2010 and 2009, respectively.
At March 31, 2010, the Company had $13,194,554 of long-term debt outstanding. At December 31, 2009, the Company had $14,402,889 of debt outstanding. The debt is mainly attributable to the acquisition of ACAP at the end of 2006.
UTG is a holding company that has no day-to-day operations of its own. Funds required to meet its expenses, generally costs associated with maintaining the company in good standing with states in which it does business and the servicing of its debt, are primarily provided by its subsidiaries. On a parent only basis, UTG's cash flow is dependent on management fees received from its insurance subsidiaries, stockholder dividends from its subsidiaries and earnings received on cash balances. At March 31, 2010, substantially all of the consolidated shareholders equity represents net assets of its subsidiaries. The Company's insurance subsidiaries have maintained adequate statutory capital and surplus. The payment of cash dividends to shareholders by UTG is not legally restricted. However, the state insurance department regulates insurance company dividend payments where the company is domiciled. No dividends were paid to shareholders in 2009 or the first three months of 2010.
UG is an Ohio domiciled insurance company, which requires five days prior notification to the insurance commissioner for the payment of an ordinary dividend. Ordinary dividends are defined as the greater of: a) prior year statutory earnings or b) 10% of statutory capital and surplus. At December 31, 2009 UG statutory shareholders' equity was $27,349,870. At December 31, 2009, UG statutory net income was $203,629. Extraordinary dividends (amounts in excess of ordinary dividend limitations) require prior approval of the insurance commissioner and are not restricted to a specific calculation. There were no dividends paid during 2010.
AC is a Texas domiciled insurance company, which requires eleven days prior notification to the insurance commissioner for the payment of an ordinary dividend. Ordinary dividends are defined as the greater of: a) prior year statutory earnings or b) 10% of statutory capital and surplus. At December 31, 2009 AC statutory shareholders' equity was $9,781,305. At December 31, 2009, AC statutory net income was $4,070,586. Extraordinary dividends (amounts in excess of ordinary dividend limitations) require prior approval of the insurance commissioner and are not restricted to a specific calculation. There were no dividends paid during 2010.
Management believes the overall sources of liquidity available will be sufficient to satisfy the Company’s financial obligations.
Accounting Developments
Recently there has been an increase in the number of modifications of acquired loans that fall under the scope of the FASB Accounting Standards Codification TM Subtopic 310-30, Receivables—Loans and Debt Securities Acquired with Deteriorated Credit Quality. Subtopic 310-30 provides guidance on accounting for acquired loans that have evidence of credit deterioration upon acquisition. Paragraph 310-30-15-6 allows acquired assets with common risk characteristics to be accounted for in the aggregate as a pool. Upon establishment of the pool, the pool becomes the unit of accounting. When loans are accounted for as a pool, the purchase discount is not allocated to individual loans; thus, all of the loans in the pool accrete at a single pool rate (based on cash flow projections for the pool). Under Subtopic 310-30, the impairment analysis also is performed on the pool as a whole as opposed to each individual loan. Paragraphs 310-40-15-4 through 15-12 establish the criteria for evaluating whether a loan modification should be classified as a troubled debt restructuring. Specifically, paragraph 310-40-15-5 states that “a restructuring of a debt constitutes a troubled debt restructuring for purposes of this Subtopic if the creditor, for economic or legal reasons related to the debtor’s financial difficulties, grants a concession to the debtor that it would not otherwise consider”. Diversity in practice has developed on whether a loan that is part of a pool of loans accounted for as a single asset should be removed from that pool upon a modification that would constitute a troubled debt restructuring. In the view of certain entities, accounting for troubled debt restructuring does not apply to individual loans within a pool, and modified loans should remain within the pool. In the view of other entities, each modified loan should be evaluated against the troubled debt restructuring criteria, and if the loan modification is a troubled debt restructuring, the modified loan should be removed from the pool and accounted for as a separate asset. The objective of the amendments in this Update is to address the diversity in practice regarding such modifications.
The Financial Accounting Standards Board (“FASB”) issued the Accounting Standards Update (“ASU”) No. 2010-10 Consolidation (Topic 810), Amendments for Certain Investment Funds. The amendments to the consolidation requirements of Topic 810 resulting from the issuance of Statement 167 are deferred for a reporting entity’s interest in an entity (1) that has all the attributes of an investment company or (2) for which it is industry practice to apply measurement principles for financial reporting purposes that are consistent with those followed by investment companies. The deferral does not apply in situations in which a reporting entity has the explicit or implicit obligation to fund losses of an entity that could potentially be significant to the entity. The deferral also does not apply to interests in securitization entities, asset-backed financing entities, or entities formerly considered qualifying special purpose entities. In addition, the deferral applies to a reporting entity’s interest in an entity that is required to comply or operate in accordance with requirements similar to those in Rule 2a-7 of the Investment Company Act of 1940 for registered money market funds. An entity that qualifies for the deferral will continue to be assessed under the overall guidance on the consolidation of variable interest entities in Subtopic 810-10 (before the Statement 167 amendments) or other applicable consolidation guidance, such as the guidance for the consolidation of partnerships in Subtopic 810-20. The amendments in this Update also clarify that for entities that do not qualify for the deferral, related parties should be considered when evaluating each of the criteria in paragraph 810-10-55-37, as amended by Statement 167, for determining whether a decision maker or service provider fee represents a variable interest. In addition, the requirements for evaluating whether a decision maker’s or service provider’s fee is a variable interest are modified to clarify the Board’s intention that a quantitative calculation should not be the sole basis for this evaluation. The amendments in this update are effective as of the beginning of a reporting entity’s first annual period that begins after November 15, 2009, and for interim periods within that first annual reporting period. Management has determined that this Statement will not result in a change to current practice.
In February 2010, Financial Accounting Standards Board ("FASB") issued Accounting Standards Update ("ASU") 2010-09, Subsequent Events (Topic 855) Amendments to Certain Recognition and Disclosure Requirements, which amends disclosure requirements within Subtopic 855-10. An entity that is an SEC filer is not required to disclose the date through which subsequent events have been evaluated. This change alleviates potential conflicts between Subtopic 855-10 and the SEC's requirements. ASU 2010-09 is effective upon issuance. The adoption of ASU 2010-09 did not have a material impact on the Company's consolidated financial statements.
In January 2010, FASB issued ASU 2010-06, Improving Disclosures about Fair Measurements, which provides amendments to subtopic 820-10 that require separate disclosure of significant transfers in and out of Level 1 and Level 2 fair value measurements and the presentation of separate information regarding purchases, sales, issuances and settlements for Level 3 fair value measurements. Additionally, ASU 2010-06 provides amendments to subtopic 820-10 that clarify existing disclosures about the level of disaggregation and inputs and valuation techniques. ASU 2010-06 is effective for financial statements issued for interim and annual periods ending after December 15, 2009, except for the disclosures about purchases, sales, issuances and settlements in the rollforward of activity in Level 3 fair value measurements, which are effective for interim and annual periods ending after December 15, 2010. The Company does not expect the adoption of ASU 2010-06 to have a material impact on its consolidated financial statements.
In January 2010, FASB issued ASU 2010-02, Accounting and Reporting for Decreases in Ownership of a Subsidiary- a Scope Clarification, which addresses the accounting for noncontrolling interests and changes in ownership interests of a subsidiary. ASU 2010-02 is effective for the interim or annual reporting periods ending on or after December 15, 2009, and must be applied retrospectively to interim or annual reporting periods beginning on or after December 15, 2008. The adoption of ASU 2010-02 did not have an impact on the Company's consolidated financial statements.
ITEM 3. QUANTITATIVE AND QUALITATIVE DISCLOSURES ABOUT MARKET RISK
Market risk relates, broadly, to changes in the value of financial instruments that arise from adverse movements in interest rates, equity prices and foreign exchange rates. The Company is exposed principally to changes in interest rates, which affect the market prices of its fixed maturities available for sale. The Company’s exposure to equity prices and foreign currency exchange rates is immaterial. The information presented below is in U.S. dollars, the Company’s reporting currency.
Interest rate risk
The Company’s exposure to interest rate changes results from a significant holding of fixed maturity investments and mortgage loans on real estate, all of which comprised approximately 67% of the investment portfolio as of March 31, 2010. These investments are mainly exposed to changes in treasury rates. The fixed maturities investments include U.S. government bonds, securities issued by government agencies, mortgage-backed bonds and corporate bonds. Approximately 60% of the fixed maturities owned at March 31, 2010 are instruments of the United States government or are backed by U.S. government agencies or private corporations carrying the implied full faith and credit backing of the U.S. government.
To manage interest rate risk, the Company performs periodic projections of asset and liability cash flows to evaluate the potential sensitivity of the investments and liabilities. Management assesses interest rate sensitivity with respect to the available-for-sale fixed maturities investments using hypothetical test scenarios that assume either upward or downward 100-basis point shifts in the prevailing interest rates. The following tables set forth the potential amount of unrealized gains (losses) that could be caused by 100-basis point upward and downward shifts on the available-for-sale fixed maturities investments as of March 31, 2010:
|
Decreases in Interest Rates
|
Increases in Interest Rates
|
|
200 Basis
Points
|
100 Basis
Points
|
100 Basis
Points
|
200 Basis
Points
|
|
$ 28,836,000
|
$ 13,286,000
|
$ (11,474,000)
|
$ (21,287,000)
|
While the test scenario is for illustrative purposes only and does not reflect our expectations regarding future interest rates or the performance of fixed-income markets, it is a near-term change that illustrates the potential impact of such events. The Company attempts to mitigate its exposure to adverse interest rate movements through staggering the maturities of its fixed maturity investments and through maintaining cash and other short term investments to assure sufficient liquidity to meets its obligations and to address reinvestment risk considerations. Due to the composition of the Company’s book of insurance business, Management believes it is unlikely that the Company would encounter large surrender activity due to an interest rate increase that would force the disposal of fixed maturities at a loss.
At March 31, 2010, $33,724,684 of assets and $13,227,485 of liabilities were classified as trading instruments carried at fair value. Included in these amounts are derivative investments with a fair value of $868,763 and $7,606,740 in trading security assets and trading security liabilities, respectively. At December 31, 2009, $19,613,472 of assets and $11,671,911 of liabilities were classified as trading instruments carried at fair value. Included in these amounts are derivative investments with a fair value of $1,054,965 and $4,753,525 in trading security assets and trading security liabilities, respectively.
The Company had no capital lease obligations, material operating lease obligations or purchase obligations outstanding as of March 31, 2010.
The Company currently has $13,194,554 of debt outstanding.
Equity risk
Equity risk is the risk that the Company will incur economic losses due to adverse fluctuations in a particular stock. As of March 31, 2010 and December 31, 2009, the fair value of our equity securities classified as available for sale was $12,898,840 and $13,323,322, respectively. As of March 31, 2010, a 10% decline in the value of the equity securities would result in an unrealized loss of $1,289,884, as compared to an estimated unrealized loss of $1,332,332 as of December 31, 2009. The selection of a 10% unfavorable change in the equity markets should not be construed as a prediction by the Company of future market events, but rather as an illustration of the potential impact of such an event.
ITEM 4. CONTROLS AND PROCEDURES
As of the end of the period covered by this Form 10-Q, an evaluation was performed under the supervision and with the participation of the Company's management, including the President and Chief Executive Officer (the "CEO") and the Chief Financial Officer (the "CFO"), of the effectiveness of the design and operation of the Company's disclosure controls and procedures. Based on that evaluation, the Company's management, including the CEO and CFO, concluded that the Company's disclosure controls and procedures were effective in alerting them on a timely basis to material information relating to the Company required to be included in the Company’s periodic reports filed or submitted under the Securities Exchange Act of 1934, as amended. There have been no significant changes in the Company's internal controls over financial reporting or in other factors that have materially affected, or are reasonably likely to materially affect, internal controls over financial reporting during this most recent quarter or subsequent to the date of the evaluation.
ITEM 4T. CONTROLS AND PROCEDURES
Not applicable at this time.
PART II. OTHER INFORMATION
ITEM 1. LEGAL PROCEEDINGS
NONE
ITEM 1A. RISK FACTORS
NONE
ITEM 2. UNREGISTERED SALES OF EQUITY SECURITIES AND USE OF PROCEEDS
NONE
ITEM 3. DEFAULTS UPON SENIOR SECURITIES
NONE
ITEM 4. SUBMISSION OF MATTERS TO A VOTE OF SECURITY HOLDERS
NONE
ITEM 5. OTHER INFORMATION
NONE
ITEM 6. EXHIBITS.
EXHIBITS
|
Exhibit Number
|
Description
|
|
31.1
|
Certification of Jesse T. Correll, Chief Executive Officer and Chairman of the Board of UTG, as
required pursuant to Section 302
|
|
31.2
|
Certification of Theodore C. Miller, Chief Financial Officer, Senior Vice President and Corporate Secretary of UTG, as required pursuant to Section 302
|
|
32.1
|
Certificate of Jesse T. Correll, Chief Executive Officer and Chairman of the Board of UTG, as required pursuant to 18 U.S.C. Section 1350
|
|
32.2
|
Certificate of Theodore C. Miller, Chief Financial Officer, Senior Vice President and Corporate Secretary of UTG, as required pursuant to 18 U.S.C. Section 1350
|
REPORTS ON FORM 8-K
None
SIGNATURES
Pursuant to the requirements of the Securities Exchange Act of 1934, the registrant has duly caused this report to be signed on its behalf by the undersigned thereunto duly authorized.
UTG, INC.
(Registrant)
|
Date:
|
December 15, 2010
|
By
|
/s/ James P. Rousey
|
|
|
James P. Rousey
|
||||
|
President, and Director
|
|
Date:
|
December 15, 2010
|
By
|
/s/ Theodore C. Miller
|
|
|
Theodore C. Miller
|
||||
|
Senior Vice President
|
||||
|
and Chief Financial Officer
|
EXHIBIT INDEX
|
Exhibit Number
|
Description
|
|
31.1
|
Certification of Jesse T. Correll, Chief Executive Officer and Chairman of the Board of UTG, as
required pursuant to Section 302
|
|
31.2
|
Certification of Theodore C. Miller, Chief Financial Officer, Senior Vice President and Corporate Secretary of UTG, as required pursuant to Section 302
|
|
32.1
|
Certificate of Jesse T. Correll, Chief Executive Officer and Chairman of the Board of UTG, as required pursuant to 18 U.S.C. Section 1350
|
|
32.2
|
Certificate of Theodore C. Miller, Chief Financial Officer, Senior Vice President and Corporate Secretary of UTG, as required pursuant to 18 U.S.C. Section 1350
|