Attached files
| file | filename |
|---|---|
| 8-K - TAIWAN FUND INC | v206153_8k.htm |
|
THE TAIWAN FUND, INC. (THE
'FUND')
|
|||||||
|
The
Martin Currie
|
IN
BRIEF
|
||||||
|
US$ return
|
|||||||
|
Net
asset value per share
|
US$18.90
|
At November 30, 2010
|
Fund*
|
TAIEX Index†
|
|||
|
Market
price
|
US$16.88
|
%
|
%
|
||||
|
Premium/(discount)
|
(10.69%)
|
One
month
|
1.6
|
1.5
|
|||
|
Fund
size
|
US$351.0m
|
Three
months
|
15.7
|
15.5
|
|||
|
One
year
|
22.8
|
16.6
|
|||||
|
Source:
State Street Bank and Trust Company.
|
Three
years % pa
|
0.6
|
1.1
|
||||
|
Shanghai
team
|
|
||||||
|
Past
performance is not a guide to future returns. Returns are annualized,
except for periods of less than one year.
|
|||||||
|
*Source:
State Street Bank and Trust Company. NAV performance.
|
|||||||
|
†Source
for index data: TWSE.
|
|||||||
|
MANAGER’S
COMMENTARY
|
|||||||
|
The
month ended with municipal elections in Taiwan. The result – the KMT won
three of the five main cities – was taken well by the market. But the KMT
only won 44.9% of the total vote versus the DPP’s 49.8%, which means that
the KMT must improve policy execution, especially in the DPP’s strongholds
in southern Taiwan, if President Ma is to secure re-election in
2012.
|
|||||||
|
The
Fund gained 1.6% over the month. We benefited from our participation in
Gourmet Master’s IPO, where the stock rose from NT$168 to NT$348 on the
first day. Gourmet Master is a great example of how Taiwanese enterprises
can extend their competitive advantages and business scope to China; the
company aims to expand its 85C Cafes by at least 100 stores per year, with
a target of 1,000 stores in China from the current 154 over the next five
years. The stock is now trading at more than 30 times price/earnings, with
estimated earnings growth of 40% for 2011 – even higher than famous
electronics names such as Acer, HTC and Largan. The listing is forcing
Taiwanese investors to re-assess their love affair with technology stocks
and to start seeing China’s domestic market as a convincing
story.
|
|||||||
|
Meanwhile,
cross-strait relations are warming up. The sixth ‘Chiang–Chen’ meeting, in
which Taiwan and Chinese representatives meet to negotiate further
free-trade agreements across the straits, takes place on 15 December and
will discuss medical cooperation. Taiwanese medical-device-makers (we own
ST Shine Optical, Excelsior Medical and Pacific Hospital Supply) may be
the early beneficiaries of tariff cuts or mutual acceptance of
certification. Centaline Property, the well-established Hong Kong property
agent, aims to set up a branch in Taipei to market luxury real estate to
Chinese buyers. Chinese tourists’ contribution to GDP is estimated to
reach NT$65 billion for 2010. Taiwan intends to accept individual tourists
soon. An increasing number of mainland companies are now listing shares in
Taiwan; the latest was leading electronics distributor and software
developer Digital China. There are now 25 stocks in the TDR (Taiwan
Depositary Receipts) market, of which 17 were issued since last
December.
|
|||||||
|
Taiwan’s
third-quarter GDP once more came in ahead of expectations (+9.8%), causing
the Directorate General of Budget, Accounting and Statistics official GDP
forecast to be revised up again to 10% for 2010 and 4.5% for
2011.
|
|||||||
|
INVESTMENT
STRATEGY
|
|||||||
|
The
Fund is 99.2% invested with holdings in 59 companies. Our exposure to the
electronics sector is just 28.6%.
|
|||||||
|
We
bought Taiwan High Speed
Rail, which is enjoying good growth in both customer numbers and
average ticket prices. The catalyst, however, is the likely extension of
its 30-year build/operate/transfer contract, which will reduce the heavy
depreciation burden. We also bought back into the solar-inverter-maker
Powercom and added
Test-Rite
International, which operates the B&Q DIY chain in Taiwan and
the Hola home décor chain in both Taiwan and mainland China. We remain
positive on the recovering banking sector in Taiwan and invested in the
improving Union Bank of
Taiwan.
|
|||||||
| On the sell side, we locked in profits by reducing the holding in Synnex Technology International on valuation grounds, as its cheaper rival Digital China issued Taiwan depository receipts. We completed our sale of Hon Hai Precision Industry, expecting the labor-intensive China assembly business model to remain under pressure from rising costs. We took a quick profit on the IPO of touch-panel-maker TPK Holding. | |||||||
|
Chris
Ruffle, Martin Currie Inc*
|
|||||||
|
*Martin
Currie Ltd and Heartland Capital Management Ltd (HCML) have established MC
China Ltd (MCCL), as a joint venture company, to provide investment
management or investment advisory services to the range of China
investment products managed by Martin Currie.
|
|||||||
|
MCCL
has appointed Martin Currie Investment Management Ltd (MCIM), or its
affiliates, as investment manager of Martin Currie’s China investment
products. HCML has seconded both Chris Ruffle and Shifeng Ke to MCIM, or
its affiliates, on a full time basis with the same roles and
responsibilities as if they were full time employees.
|
|||||||
|
Martin
Currie Inc took over management of the Fund on May 8,
2010.
|
|||||||
|
NOVEMBER 30, 2010
|
||||||||
|
FUND DETAILS
|
PERFORMANCE
|
(US$ RETURNS)
|
||||||
|
Market
cap
|
US$313.5m
|
NAV
|
Market
price
|
|||||
|
Shares
outstanding
|
18,575,112
|
%
|
%
|
|||||
|
Exchange
listed
|
NYSE
|
One
month
|
1.6
|
(1.4)
|
||||
|
Listing
date
|
1986
|
Three
months
|
15.7
|
15.1
|
||||
|
Listed
and direct investment manager
|
Martin
Currie Inc
|
Three
years % pa
|
0.6
|
0.0
|
||||
|
Source:
State Street Bank and Trust Company.
|
Past
performance is not a guide to future returns. Returns are annualized,
except for periods of less than one year. Source: State Street Bank and
Trust
Company.
|
|||||||
|
SECTOR
ALLOCATION
|
||
|
Fund*
|
Benchmark†
|
|
|
Electronics
|
28.6%
|
52.5%
|
|
Finance
|
15.5%
|
12.2%
|
|
Wholesale
and retail
|
13.5%
|
5.3%
|
|
Construction
|
6.4%
|
2.1%
|
|
Plastics
|
5.4%
|
8.3%
|
|
Foods
|
4.3%
|
1.6%
|
|
Textiles
|
3.9%
|
2.1%
|
|
Electric
and machinery
|
3.2%
|
1.0%
|
|
Chemicals
|
3.2%
|
2.1%
|
|
Healthcare
|
2.8%
|
—
|
|
Others
|
2.8%
|
2.0%
|
|
Steel
and iron
|
2.7%
|
2.8%
|
|
Transportation
|
2.4%
|
2.8%
|
|
Glass
and ceramics
|
2.2%
|
0.4%
|
|
Rubber
|
1.6%
|
1.2%
|
|
Cement
|
0.7%
|
1.1%
|
|
Automobile
|
—
|
1.1%
|
|
Electrical
appliance & cable
|
—
|
0.6%
|
|
Tourism
|
—
|
0.4%
|
|
Paper
and pulp
|
—
|
0.4%
|
|
Other
assets and liabilities
|
0.8%
|
—
|
*Source:
State Street Bank and Trust Company.
†Source
for TAIEX index data: TWSE.
|
15
LARGEST HOLDINGS (43.0%)
|
||
|
%
of net assets
|
||
|
Taiwan
Semiconductor Manufacturing
|
Electronics
|
3.6%
|
|
Wah
Lee Industrial
|
Electronics
|
3.5%
|
|
Far
Eastern Department Stores
|
Wholesale
and retail
|
3.4%
|
|
China
Petrochemical Development
|
Plastics
|
3.3%
|
|
President
Chain Store
|
Wholesale
and retail
|
3.3%
|
|
Synnex
Technology International
|
Electronics
|
3.0%
|
|
SinoPac
Financial Holdings
|
Finance
|
2.8%
|
|
Chinatrust
Financial Holdings
|
Finance
|
2.7%
|
|
KGI
Securities
|
Finance
|
2.7%
|
|
Tung
Ho Steel Enterprise
|
Steel
and iron
|
2.7%
|
|
Uni-President
Enterprises
|
Foods
|
2.6%
|
|
Fubon
Financial Holding
|
Finance
|
2.5%
|
|
Prince
Housing & Development
|
Construction
|
2.3%
|
|
Yuanta
Financial Holding
|
Finance
|
2.3%
|
|
Test-Rite
International
|
Wholesale
and retail
|
2.3%
|
Source:
State Street Bank and Trust Company.
|
PERFORMANCE
|
(US$ RETURNS)
|
|||||||
|
One
|
Three
|
Calendar year
|
One
|
Three
|
Five
|
Ten
|
Since
|
|
|
month
|
months
|
to date
|
year
|
years
|
years
|
years
|
launch
|
|
|
%
|
%
|
%
|
%
|
% pa
|
% pa
|
% pa
|
% pa
|
|
|
The
Taiwan Fund, Inc.
|
1.6
|
15.7
|
14.8
|
22.8
|
0.6
|
8.7
|
5.4
|
9.5
|
|
TAIEX
Index
|
1.5
|
15.5
|
7.3
|
16.6
|
1.1
|
8.2
|
5.6
|
9.4
|
|
TAIEX
Total Return Index
|
1.5
|
15.6
|
11.2
|
20.8
|
5.1
|
12.4
|
na
|
na
|
|
MSCI
Taiwan Index
|
1.6
|
15.6
|
9.1
|
18.4
|
1.7
|
8.5
|
6.1
|
na
|
Past
performance is not a guide to future returns. Source: State Street Bank and
Trust Company. Launch date December 23, 1986. Returns for the Fund
presented above are historical total returns that reflect changes in net asset
value per share during each period and assume that dividends and capital gains,
if any, were reinvested. Actual returns to a Fund Shareholder will be based on
market price and reflect transaction costs and expenses. Returns are annualized,
except for periods of less than one year.
Source
for index data: MSCI for the MSCI Taiwan Index and TWSE for the TAIEX Total
Return Index and the TAIEX Index. For a full description of each index please
see the index descriptions section.
Returns
for the TAIEX Index are not total returns and reflect only changes in the share
price but do not assume that cash dividends, if any, were reinvested, and thus
are not strictly comparable to the Fund returns.
The TAIEX
Total Return Index commenced January 1, 2003.
|
THE
PORTFOLIO — IN FULL
|
NOVEMBER
30, 2010
|
||||
|
Sector
|
Company
|
Price
|
Holding
|
Value US$
|
% of net assets
|
|
(BGB ticker)
|
|||||
|
Electronics
|
28.6
|
||||
|
Taiwan
Semiconductor Manufacturing
|
2330
TT
|
NT$63.4
|
5,994,426
|
$
12,467,698
|
3.6
|
|
Wah
Lee Industrial
|
3010
TT
|
NT$57.0
|
6,644,000
|
$
12,423,784
|
3.5
|
|
Synnex
Technology International
|
2347
TT
|
NT$76.3
|
4,238,544
|
$
10,609,396
|
3.0
|
|
WT
Microelectronics
|
3036
TT
|
NT$47.3
|
5,056,000
|
$
7,845,446
|
2.2
|
|
WPG
Holdings
|
3702
TT
|
NT$56.7
|
4,129,725
|
$
7,681,634
|
2.2
|
|
Far
EasTone Telecommunications
|
4904
TT
|
NT$43.0
|
4,924,000
|
$
6,946,018
|
2.0
|
|
Tatung
|
2371
TT
|
NT$7.3
|
26,073,000
|
$
6,226,899
|
1.8
|
|
Longwell
|
6290
TT
|
NT$43.5
|
3,614,000
|
$
5,157,352
|
1.5
|
|
Powercom
|
3043
TT
|
NT$61.0
|
2,384,000
|
$
4,770,737
|
1.4
|
|
Syncmold
Enterprise
|
1582
TT
|
NT$50.4
|
2,678,000
|
$
4,427,826
|
1.3
|
|
Aurora
|
2373
TT
|
NT$52.9
|
2,196,000
|
$
3,810,987
|
1.1
|
|
Chunghwa
Telecom
|
2412
TT
|
NT$74.0
|
1,488,000
|
$
3,612,302
|
1.0
|
|
Avermedia
Technologies
|
2417
TT
|
NT$40.7
|
2,690,000
|
$
3,591,667
|
1.0
|
|
Clevo
|
2362
TT
|
NT$66.2
|
1,650,000
|
$
3,583,368
|
1.0
|
|
Taiwan
Surface Mounting Technology
|
6278
TT
|
NT$65.6
|
1,554,000
|
$
3,344,293
|
0.9
|
|
MPI
|
6223
TT
|
NT$90.1
|
1,098,000
|
$
3,274,279
|
0.9
|
|
Soft-World
International
|
5478
TT
|
NT$140.0
|
154,770
|
$
710,827
|
0.2
|
|
Finance
|
15.5
|
||||
|
SinoPac
Financial Holdings
|
2890
TT
|
NT$11.1
|
26,935,000
|
$
9,808,201
|
2.8
|
|
Chinatrust
Financial Holdings
|
2891
TT
|
NT$18.4
|
16,067,000
|
$
9,672,089
|
2.7
|
|
KGI
Securities
|
6008
TT
|
NT$14.1
|
20,740,000
|
$
9,559,485
|
2.7
|
|
Fubon
Financial Holding
|
2881
TT
|
NT$37.2
|
7,349,624
|
$
8,969,278
|
2.5
|
|
Yuanta
Financial Holding
|
2885
TT
|
NT$18.7
|
13,013,000
|
$
7,961,698
|
2.3
|
|
Jih
Sun Financial
|
5820
TT
|
NT$10.2
|
11,240,781
|
$
3,761,370
|
1.1
|
|
China
Life Insurance
|
2823
TT
|
NT$24.4
|
4,191,254
|
$
3,354,928
|
1.0
|
|
Union
Bank of Taiwan
|
2838
TT
|
NT$8.8
|
4,408,000
|
$
1,275,439
|
0.4
|
|
Wholesale
and retail
|
13.5
|
||||
|
Far
Eastern Department Stores
|
2903
TT
|
NT$42.0
|
8,794,500
|
$
12,102,986
|
3.4
|
|
President
Chain Store
|
2912
TT
|
NT$123.0
|
2,840,000
|
$
11,459,690
|
3.3
|
|
Test-Rite
International
|
2908
TT
|
NT$22.7
|
10,622,000
|
$
7,910,093
|
2.3
|
|
PC
Home Online
|
8044
TT
|
NT$189.0
|
922,125
|
$
5,717,432
|
1.6
|
|
Taiwan
Tea
|
2913
TT
|
NT$19.9
|
8,231,000
|
$
5,359,972
|
1.5
|
|
Mercuries
& Associates
|
2905
TT
|
NT$22.7
|
6,680,100
|
$
4,963,644
|
1.4
|
|
Construction
|
6.4
|
||||
|
Prince
Housing & Development
|
2511
TT
|
NT$25.2
|
9,899,760
|
$
8,184,170
|
2.3
|
|
Taiwan
Land Development
|
2841
TT
|
NT$15.0
|
14,586,183
|
$
7,177,651
|
2.0
|
|
Hung
Poo Real Estate Development
|
2536
TT
|
NT$42.0
|
3,061,000
|
$
4,212,546
|
1.2
|
|
Continental
Holdings
|
3703
TT
|
NT$12.4
|
7,468,000
|
$
3,025,664
|
0.9
|
|
Plastics
|
5.4
|
||||
|
China
Petrochemical Development
|
1314
TT
|
NT$30.4
|
11,711,000
|
$
11,679,305
|
3.3
|
|
Nan
Ya Plastics
|
1303
TT
|
NT$67.9
|
3,217,000
|
$
7,165,892
|
2.1
|
|
Foods
|
4.3
|
||||
|
Uni-President
Enterprises
|
1216
TT
|
NT$42.2
|
6,600,000
|
$
9,126,220
|
2.6
|
|
Lien
Hwa Industrial
|
1229
TT
|
NT$23.1
|
4,815,000
|
$
3,640,966
|
1.0
|
|
Gourmet
Master
|
2723
TT
|
NT$348.0
|
200,000
|
$
2,283,277
|
0.7
|
|
Textiles
|
3.9
|
||||
|
Li
Peng Enterprise
|
1447
TT
|
NT$15.0
|
9,847,000
|
$
4,845,567
|
1.4
|
|
Far
Eastern New Century
|
1402
TT
|
NT$45.1
|
3,121,200
|
$
4,612,813
|
1.3
|
|
Makalot
Industrial
|
1477
TT
|
NT$70.0
|
1,828,000
|
$
4,197,818
|
1.2
|
|
Electric
and machinery
|
3.2
|
||||
|
Yungtay
Engineering
|
1507
TT
|
NT$42.0
|
3,274,000
|
$
4,511,047
|
1.3
|
|
Depo
Auto Parts Industrial
|
6605
TT
|
NT$77.3
|
1,674,000
|
$
4,245,065
|
1.2
|
|
Awea
Mechantronic
|
1530
TT
|
NT$33.8
|
2,264,000
|
$
2,510,398
|
0.7
|
|
Chemicals
|
3.2
|
||||
|
China
Steel Chemical
|
1723
TT
|
NT$113.5
|
1,600,000
|
$
5,957,516
|
1.7
|
|
Excelsior
Medical
|
4104
TT
|
NT$105.0
|
1,507,729
|
$
5,193,522
|
1.5
|
|
THE PORTFOLIO — IN FULL (CONTINUED)
|
NOVEMBER
30, 2010
|
||||
|
Sector
|
Company
|
Price
|
Holding
|
Value US$
|
% of net assets
|
|
(BGB ticker)
|
|||||
|
Healthcare
|
2.8
|
||||
|
ST
Shine Optical
|
1565
TT
|
NT$400.0
|
392,000
|
$
5,143,935
|
1.4
|
|
Pacific
Hospital Supply
|
4126
TT
|
NT$136.0
|
1,099,948
|
$
4,907,502
|
1.4
|
|
Others
|
2.8
|
||||
|
Globe
Union Industrial
|
9934
TT
|
NT$30.1
|
5,128,000
|
$
5,063,653
|
1.5
|
|
Yem
Chio
|
4306
TT
|
NT$28.0
|
5,075,316
|
$
4,653,656
|
1.3
|
|
Steel
and iron
|
2.7
|
||||
|
Tung
Ho Steel Enterprise
|
2006
TT
|
NT$28.4
|
10,099,000
|
$
9,392,492
|
2.7
|
|
Transportation
|
2.4
|
||||
|
Eastern
Media International
|
2614
TT
|
NT$7.2
|
16,546,000
|
$
3,881,043
|
1.1
|
|
Farglory
F T Z Investment
|
5607
TT
|
NT$30.4
|
3,809,000
|
$
3,792,443
|
1.1
|
|
Taiwan
High Speed Rail
|
2633
TT
|
NT$5.0
|
3,984,000
|
$
653,490
|
0.2
|
|
Glass
and ceramics
|
2.2
|
||||
|
Taiwan
Glass Industrial
|
1802
TT
|
NT$35.6
|
6,534,320
|
$
7,620,605
|
2.2
|
|
Rubber
|
1.6
|
||||
|
TSRC
|
2103
TT
|
NT$57.9
|
3,057,000
|
$
5,806,620
|
1.6
|
|
Cement
|
0.7
|
||||
|
Wei
Mon Industry
|
8925
TT
|
NT$18.3
|
4,204,296
|
$
2,524,026
|
0.7
|
|
Other
assets and liabilities
|
$ 2,906,945
|
0.8
|
|||
|
THE
TAIWAN FUND, INC.
PREMIUM/DISCOUNT
|
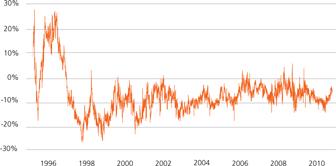
Source:
State Street Bank and Trust Company as of November 30, 2010.
|
INDEX
DESCRIPTIONS
|
MSCI
Taiwan Index
The MSCI
Total Return Taiwan Index is a free-float adjusted market capitalization index.
The index represents Taiwanese companies that are available to investors
worldwide. The index has a base date of December 31, 1987. As of June 24, 2010
it contained 117 constituents.
TAIEX
Index
The TWSE,
or TAIEX, Index is a capitalization-weighted index of all listed common shares
traded on the Taiwan Stock Exchange. The index was based in 1966.
TAIEX
Total Return Index
The TAIEX
Total Return Index is a capitalization-weighted index of all listed common
shares traded on the Taiwan Stock Exchange, based in 1966, which includes
re-invested dividends.
|
OBJECTIVE
|
The Fund
was launched on December 23, 1986 to allow US and other investors to access and
participate in the growth of the economy and the stock market in Taiwan, the
Republic of China. The Fund’s investment objective is to seek long-term capital
appreciation primarily through investments in equity securities listed in
Taiwan. The Fund is a diversified, closed-end management investment company
listed on the New York Stock Exchange (NYSE) under the symbol
'TWN'.
Taiwan,
with its global market leadership in high technology goods and its significant
investments throughout mainland China and Southeast Asian economies, is now an
integral economic player in the Asia Pacific Region as well as around the world.
Investing in Taiwan not only allows investors to capitalize on Taiwan’s dynamic
economy, but also allows investors to reap the growth and investment potential
of the mainland China and other emerging economies of the region.
|
CONTACTS
|
The
Taiwan Fund, Inc.
c/o State
Street Bank and Trust Company
2 Avenue
de Lafayette
PO Box
5049
Boston,
MA 02111
Tel: (1)
877-864-5056
www.thetaiwanfund.com
Important information: This
document is issued and approved by Martin Currie Inc (MC Inc), as investment
adviser of The Taiwan Fund, Inc. (the 'Fund'). MC Inc is authorised and
regulated by the Financial Services Authority (FSA) and incorporated under
limited liability in New York, USA. Registered in Scotland (No BR2575),
registered address Saltire Court, 20 Castle Terrace, Edinburgh, EH1 2ES.
Information herein is believed to be reliable but has not been verified by MC
Inc. MC Inc makes no representation or warranty and does not accept any
responsibility in relation to such information or for opinion or conclusion
which the reader may draw from this newsletter.
The Fund
is classified as a diversified investment company under the US Investment
Company Act of 1940 as amended. It meets the criteria of a closed ended US
mutual fund and its shares are listed on the New York Stock Exchange. MC Inc has
been appointed investment adviser to the Fund.
Investors
are advised that they will not generally benefit from the rules and regulations
of the United Kingdom Financial Services and Markets Act 2000 and the FSA for
the protection of investors, nor benefit from the United Kingdom Financial
Services Compensation Scheme, nor have access to the Financial Services
Ombudsman in the event of a dispute. Investors will also have no rights of
cancellation under the FSA's Conduct of Business Sourcebook of the United
Kingdom.
This
newsletter does not constitute an offer of shares. MC Inc, its ultimate and
intermediate holding companies, subsidiaries, affiliates, clients, directors or
staff may, at any time, have a position in the market referred to herein, and
may buy or sell securities, currencies, or any other financial instruments in
such markets. The information or opinion expressed in this newsletter should not
be construed to be a recommendation to buy or sell the securities, commodities,
currencies or financial instruments referred to herein.
The
information provided in this report should not be considered a recommendation to
purchase or sell any particular security. There is no assurance that any
securities discussed herein will remain in an account's portfolio at the time
you receive this report or that securities sold have not been
repurchased.
It should
not be assumed that any of the securities transactions or holdings discussed
here were or will prove to be profitable, or that the investment recommendations
or decisions we make in the future will be profitable or will equal the
investment performance of the securities discussed herein.
Investing
in the Fund involves certain considerations in addition to the risks normally
associated with making investments in securities. The value of the shares issued
by the Fund, and the income from them, may go down as well as up and there can
be no assurance that upon sale, or otherwise, investors will receive back the
amount originally invested. There can be no assurance that you will receive
comparable performance returns, or that investments will reflect the performance
of the stock examples contained in this document. Movements in foreign exchange
rates may have a separate effect, unfavorable as well as favorable, on the gain
or loss otherwise experienced on an investment. Past performance is not a
guide to future returns. Accordingly, the Fund is only suitable for investment
by investors who are able and willing to withstand the total loss of their
investment. In particular, prospective investors should consider the following
risks:
|
-›
|
it
should be noted that investment in the Fund is only suitable for
sophisticated investors who are aware of the risk of investing in Taiwan
and should be regarded as long term. Funds which invest in one country
carry a higher degree of risk than those with portfolios diversified
across a number of markets.
|
|
-›
|
investment
in the securities of smaller and unquoted companies can involve greater
risk than is customarily associated with investment in larger, more
established, companies. In particular, smaller companies often have
limited product lines, markets or financial resources and their management
may be dependent on a smaller number of key individuals. In addition, the
market for stock in smaller companies is often less liquid than that for
stock in larger companies, bringing with it potential difficulties in
acquiring, valuing and disposing of such stock. Proper information for
determining their value, or the risks to which they are exposed, may not
be available.
|
|
-›
|
investments
within emerging markets such as Taiwan can be of higher risk. Many
emerging markets, and the companies quoted on their stock exchanges, are
exposed to the risks of political, social and religious instability,
expropriation of assets or nationalization, rapid rates of inflation, high
interest rates, currency depreciation and fluctuations and changes in
taxation which may affect the Fund's income and the value of its
investments.
|
|
-›
|
the
marketability of quoted shares may be limited due to foreign investment
restrictions, wide dealing spreads, exchange controls, foreign ownership
restrictions, the restricted opening of stock exchanges and a narrow range
of investors. Trading volume may be lower than on more developed
stockmarkets, and equities are less liquid. Volatility of prices can also
be greater than in more developed stockmarkets. The infrastructure for
clearing, settlement and registration on the primary and secondary markets
may be undeveloped. Under certain circumstances, there may be delays in
settling transactions in some of the
markets.
|
Martin
Currie Inc, registered in Scotland (no BR2575)
Registered
office: Saltire Court, 20 Castle Terrace, Edinburgh EH1 2ES Tel: 44
(0) 131 229 5252 Fax: 44 (0) 131 228
5959 www.martincurrie.com North American office: 1350 Avenue of the
Americas, Suite 3010, New York, NY 10019, USA Tel: (1) 212 258
1900 Fax: (1) 212 258 1919
Authorised
and registered by the Financial Services Authority and incorporated with limited
liability in New York, USA.
Please
note: calls to the above numbers may be recorded.