Attached files
| file | filename |
|---|---|
| 8-K - HINES REIT THIRD QUARTER STOCKHOLDER PRESENTATION 8-K - HINES REAL ESTATE INVESTMENT TRUST INC | hr_q3stockholderpresentation.htm |

Hines Real Estate Investments, Inc., Member FINRA/SIPC, is the Dealer Manager. 9/10
Hines Real Estate Investment Trust, Inc. (Hines REIT) is closed to new investors.
Hines REIT Update
As of September 30, 2010

Jeffrey C. Hines and Gerald D. Hines
Hines History
Gerald D. Hines founded Hines Interests Limited
Partnership (Hines)1 upon a single premise: buildings
of superior quality and architectural merit backed by
responsive, professional management attract better
tenants; command higher rents; and retain their value
longer despite the ups and downs of real estate cycles.
He also imbued the organization with a constant quest
for excellence and an adherence to the highest tenets
of ethical behavior. This foundation, coupled with the
firm’s sound financial policies, has fueled Hines’
growth from a one-person endeavor to a fully
integrated, international real estate firm of
approximately 3,300 employees.
2
1. Hines REIT Investors do not receive an interest in Hines or its affiliates. The performance and experience of Hines may not be indicative of
future results for Hines REIT.
future results for Hines REIT.
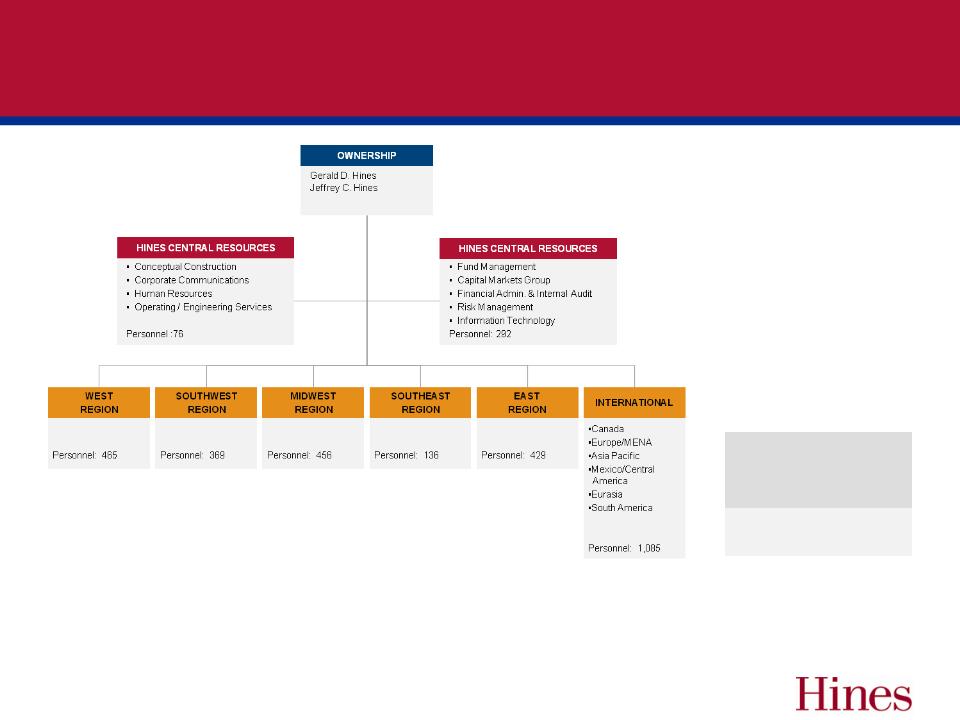
Ownership & Structure of Hines1
§ Hines personnel living
and working in 100 cities
worldwide
and working in 100 cities
worldwide
§ Local market knowledge
and expertise
and expertise
§ Fully integrated
– acquisitions
– development
– dispositions
– leasing
– finance
– asset management
– property management
|
TENURE OF HINES EXECUTIVES
WORLDWIDE |
||
|
TITLE
|
NO. OF
EMPLOYEES |
AVG.
TENURE (YEARS) |
|
EVP
|
10
|
31
|
|
SVP
|
43
|
22
|
|
VP
|
131
|
15
|
3
1. All data as of June 30, 2010.

4
Calgary
Seattle
Redmond
San Mateo
Emeryville
Palo Alto
Pleasanton
Sacramento
Roseville
San Jose
Tempe
Albuquerqu
e
e
Salt Lake
City
City
Denver
Broomfield
Aspen
Woodland Hills
Austin
Louisville
Kansas City
Richardson
Dallas
Irving
St. Augustine
Miami
Charlotte
Orlando
Alpharetta
Cincinnati
Minneapolis
Bloomington
Detroit
Southfield
Toledo
Bannockburn
Deerfield
Omaha
Cleveland
Hartford
Purchase
Queens
Rye
Boston
Wellesley
Washington, D.C.
Columbus
Richmond
Melville
Greenwich
Milford
Stamford
Toronto
Miami Beach
Oklahoma
City
City
Los Angeles
Torrance
San Diego
Phoenix
Irvine
Fountain Valley
|
§ 20 Officers / Avg. Tenure 20 yrs.
|
||
|
§ Office Established
|
1957
|
|
|
§ Total Personnel
|
369
|
|
|
|
SF (m)
|
SM (m)
|
|
§ Project Experience
|
95.5
|
8.9
|
|
§ Property Management
|
19.2
|
1.8
|
|
§ 43 Officers / Avg. Tenure 19 yrs.
|
||
|
§ Office Established
|
1957
|
|
|
§ Total Personnel
|
368
|
|
|
|
|
|
|
|
|
|
|
|
|
|
|
§ 11 Officers / Avg. Tenure 19 yrs.
|
||
|
§ Office Established
|
1982
|
|
|
§ Total Personnel
|
136
|
|
|
|
SF (m)
|
SM (m)
|
|
§ Project Experience
|
30.2
|
2.8
|
|
§ Property Management
|
6.3
|
0.6
|
MIDWEST REGION
CANADA
WEST REGION
|
§ 29 Officers / Avg. Tenure 19 yrs.
|
||
|
§ Office Established
|
1981
|
|
|
§ Total Personnel
|
429
|
|
|
|
SF (m)
|
SM (m)
|
|
§ Project Experience
|
34.8
|
3.2
|
|
§ Property Management
|
14.7
|
1.4
|
|
§ 1 Officer / 12 yrs. Tenure
|
||
|
§ Office Established
|
2004
|
|
|
§ Total Personnel
|
32
|
|
|
|
SF (m)
|
SM (m)
|
|
§ Project Experience
|
5.1
|
0.5
|
|
§ Property Management
|
1.0
|
0.1
|
|
§ 19 Officers / Avg. Tenure 21 yrs.
|
||
|
§ Office Established
|
1986
|
|
|
§ Total Personnel
|
456
|
|
|
|
SF (m)
|
SM (m)
|
|
§ Project Experience
|
51.2
|
4.8
|
|
§ Property Management
|
29.5
|
2.7
|
|
§ 11 Officers / Avg. Tenure 21 yrs.
|
||
|
§ Office Established
|
1979
|
|
|
§ Total Personnel
|
465
|
|
|
|
SF (m)
|
SM (m)
|
|
§ Project Experience
|
47.3
|
4.4
|
|
§ Property Management
|
28.2
|
2.6
|
EAST REGION
SOUTHWEST REGION
SOUTHEAST REGION
CENTRAL RESOURCES
Offices
Regional Offices
as of June 30, 2010
Project Experience: Projects completed, acquired, under development or in design (1957-06/30/10)
Property Management: Properties under management as of June 30, 2010
Property Management: Properties under management as of June 30, 2010
|
PROPERTY TYPES
|
|
Office
|
|
Retail
|
|
Industrial
|
|
Residential
|
|
Mixed-use
|
|
Land Development
|
LEADERSHIP
Name
Tenure w/Hines
(yrs)
Jeffrey C. Hines
28
C. Hastings Johnson
32
Charles M. Baughn
26
Thomas D. Owens
37
James C. Buie, Jr. (West)
30
Mark A. Cover (Southwest)
27
Christopher D. Hughes (East)
24
C. Kevin Shannahan (MW/SE)
28
Hines U.S./Canada Presence
Projects Completed, Acquired, Under Development, In Design and/or Under Management
Projects Completed, Acquired, Under Development, In Design and/or Under Management

5
Offices
as of June 30, 2010
Regional Offices
Project Experience: Projects completed, acquired, under development or in design (1957-6/30/10)
Property Management: Properties under management as of June 30, 2010
Property Management: Properties under management as of June 30, 2010
§ Approximately 3,300
employees worldwide
employees worldwide
§ Operations in 17 countries;
offices in 100 cities
offices in 100 cities
§ Local market knowledge and
expertise
expertise
LEADERSHIP
Name
Tenure w/Hines
(yrs)
Gerald D. Hines
54
Jeffrey C. Hines
28
C. Hastings Johnson
32
Charles M. Baughn
26
James C. Buie, Jr.
30
Mark A. Cover
27
Christopher D. Hughes
24
E. Staman Ogilvie
37
Thomas D. Owens
37
C. Kevin Shannahan
28
Michael J. G. Topham
35
|
TENURE OF HINES
|
||
|
TITLE
|
NO. OF
EMPLOYEES |
AVG.
TENURE (YEARS) |
|
EVP
|
10
|
31
|
|
SVP
|
43
|
22
|
|
VP
|
131
|
15
|
HINES CANADA
HINES EUROPE / MENA
HINES EURASIA
HINES MEXICO/CENTRAL AMERICA
HINES SOUTH AMERICA
HINES ASIA PACIFIC
|
§ Office Established
|
1992
|
|
|
§ Total Personnel
|
139
|
|
|
|
SF (m)
|
SM (m)
|
|
§ Project Experience
|
11.4
|
1.1
|
|
§ Property Management
|
9.5
|
0.88
|
|
§ Office Established
|
1991 / 2007
|
|
|
§ Total Personnel
|
219 / 18
|
|
|
|
SF (m)
|
SM (m)
|
|
§ Project Experience
|
22.0
|
2.0
|
|
§ Property Management
|
0.0
|
0.0
|
|
§ Office Established
|
2004
|
|
|
§ Total Personnel
|
32
|
|
|
|
SF (m)
|
SM (m)
|
|
§ Project Experience
|
5.1
|
0.5
|
|
§ Property Management
|
1.0
|
0.1
|
|
§ Office Established
|
1992
|
|
|
§ Total Personnel
|
313
|
|
|
|
SF (m)
|
SM (m)
|
|
§ Project Experience
|
8.3
|
0.8
|
|
§ Property Management
|
3.9
|
0.37
|
|
§ Office Established
|
1998
|
|
|
§ Total Personnel
|
158
|
|
|
|
SF (m)
|
SM (m)
|
|
§ Project Experience
|
18.8
|
1.7
|
|
§ Property Management
|
10.2
|
0.95
|
|
§ Office Established
|
1996
|
|
|
§ Total Personnel
|
206
|
|
|
|
SF (m)
|
SM (m)
|
|
§ Project Experience
|
10.6
|
1.0
|
|
§ Property Management
|
0.6
|
0.05
|
HINES USA
|
§ Office Established
|
1957
|
|
|
§ Total Personnel
|
2,223
|
|
|
|
SF (m)
|
SM (m)
|
|
§ Project Experience
|
259.0
|
24.1
|
|
§ Property Management
|
97.9
|
9.1
|
MOSCOW
GDANSK
WARSAW
LODZ
BERLIN
STUTTGART
BARCELONA
MILAN
PARIS
MUNICH
MARBELLA
MADRID
LONDON
LOUVEIRA
RIO DE JANEIRO
BELFORD ROXO
PANAMA CITY
MANAUS
LUXEMBOURG CITY
ABU DHABI
SHANGHAI
DELHI /
GURGAON
BEIJING
DALIAN
ISTANBUL
SÃO PAULO
CAJAMAR
CHICAGO
ATLANTA
HOUSTON
SAN FRANCISCO
NEW YORK
MONTERREY
QUERÉTARO
MEXICO CITY
GUADALAJARA
TOLUCA
ACAPULCO
HERMOSILLO
MERIDA
Hines Worldwide Operations
Projects Completed, Acquired, Under Development, In Design and/or Under Management
Projects Completed, Acquired, Under Development, In Design and/or Under Management

6
TENANT SATISFACTION
TENANT RETENTION
HIGHER OCCUPANCY
PROPERTY
OUTPERFORMANCE
OUTPERFORMANCE
|
TENURED HINES PROPERTY MANAGEMENT AND LEASING PERSONNEL
|
|
|
|
AVERAGE HINES
U.S. TENURE (YRS)1
|
|
Property Managers
|
9
|
|
Assistant Property Managers
|
3+
|
|
Chief Engineers (First Line Managers) and Engineering Managers
|
11+
|
|
Assistant Chief Engineers
|
7+
|
|
Building Engineers / Maintenance Technicians / Apprentice Engineers
|
5+
|
|
Marketing / Leasing Managers
|
6+
|
1. Average Hines U.S. Tenures as of 12/31/2009
Superior Property Management
Over 120 Million Square Feet Managed Daily by Hines
Over 120 Million Square Feet Managed Daily by Hines
U.S. OFFICE MARKET LEASED PERCENTAGE
Source: NCREIF, Hines

Hines REIT Portfolio*
* As of September 30, 2010.
Corporate Headquarters
Williams Tower
Houston, Texas
Houston, Texas
One North Wacker
Chicago, Illinois
Atrium on Bay
Toronto, Ontario
Toronto, Ontario
7

Hines REIT in Summary (as of September 30, 2010)
§ Holds a diversified portfolio of commercial real estate assets including:
– Primarily institutional-quality office properties
– Grocery-Anchored Retail
– Mixed-Use office
– Industrial
§ Invests through direct acquisitions and joint ventures
§ As of 9/30/10 owns directly or indirectly 59 properties:
– Over 29 million square feet
– Portfolio 90% leased
– Both domestic and international holdings:
§ 57 domestic assets totaling approximately 27.5 million square feet
§ 2 international assets totaling in excess of 1.7 million square feet
– Total real estate assets of $3.7 billion acquired
– Minimal near term rollover with an average annual lease roll of 7.2% through 2012
– Current leverage 59.7%
– Current refinancing exposure is approximately $45M in 2010 and 2011 and represents
approximately 3% of the fund’s total debt.
approximately 3% of the fund’s total debt.
§ Proceeds raised in excess of $2.5 billion
§ In excess of 58,000 shareholders
§ Delivered annualized distributions at a rate of 5.0% - 6.35% since inception in
November 2004 through September 2010*
November 2004 through September 2010*
*effective July 1, 2010, the dividend was lowered to 5% primarily as a result of lower occupancy and lower rental rates
8

9
San Diego
Houston
Chicago
San Francisco
Seattle
Atlanta
Los Angeles
Richmond
Sacramento
Charlotte
Dallas
Miami
East Bay
Toronto
Minneapolis
Phoenix
Kansas City
Denver
Orlando
San Antonio
Memphis
New York
Washington, D.C.
Raleigh
Rio de Janeiro
Chase Tower
Dallas, TX
1,246,652 Square Feet
Acquired 11/07
90% leased
Minneapolis Office/Flex
Portfolio
Portfolio
Minneapolis, MN
767,700 Square Feet
Acquired 9/07
83% leased
Williams Tower
Houston, TX
1,479,683 Square Feet
Acquired 05/08
87% leased
2555 Grand Blvd
Kansas City, MO
595,607 Square Feet
Acquired 2/08
100% leased
4050/4055 Corporate
Drive
Drive
Dallas, TX
643,429 Square Feet
Acquired 05/08
100% leased
Citymark
Dallas, TX
218,722 Square Feet
Acquired 8/05
95% leased
321 North Clark
Chicago, IL
888,837 Square Feet
Acquired 4/06
82% leased
Three Huntington
Quadrangle
Quadrangle
Long Island, NY
407,731 Square Feet
Acquired 7/07
73% leased
Airport Corporate
Center
Miami, FL
1,018,428 Square Feet
Acquired 1/06
83% leased
Hines REIT Portfolio
(as of September 30, 2010)
(as of September 30, 2010)

10
San Diego
Houston
Chicago
San Francisco
Seattle
Atlanta
Los Angeles
Richmond
Sacramento
Charlotte
Dallas
Miami
East Bay
Toronto
Minneapolis
Phoenix
Kansas City
Denver
Orlando
San Antonio
Memphis
New York
Washington, D.C.
Raleigh
Rio de Janeiro
Denver Industrial
Denver, CO
484,737 Square Feet
Acquired 12/08
85% leased
5th & Bell
Seattle, WA
197,135 Square Feet
Acquired 6/07
98% leased
Seattle Design Center
Redmond, WA
390,684 Square Feet
Acquired 6/07
75% leased
Daytona-Hart Portfolio
Redmond, WA
711,974 Square Feet
Acquired 12/06, 1/07
86% leased
1900/2000 Alameda
San Mateo, CA
253,187 Square Feet
Acquired 6/05
94% leased
1515 S Street
Sacramento, CA
351,745 Square Feet
Acquired 11/05
98% leased
3400 Data Drive
Sacramento, CA
149,703 Square Feet
Acquired 11/06
100% leased
2100 Powell
Emeryville, CA
344,433 Square Feet
Acquired 12/06
100% leased
One Wilshire
Los Angeles, CA
661,553 Square Feet
Acquired 8/07
96% leased
Hines REIT Portfolio
(as of September 30, 2010)
(as of September 30, 2010)

11
Atrium on Bay
Toronto, ON
1,077,496 Square Feet
Acquired 2/07
98% leased
Distribution Park Rio
Rio de Janeiro, Brazil
693,115 Square Feet
Acquired 07/07
100% leased
50%1
San Diego
Houston
Chicago
San Francisco
Seattle
Atlanta
Los Angeles
Richmond
Sacramento
Charlotte
Dallas
Miami
East Bay
Toronto
Minneapolis
Phoenix
Kansas City
Denver
Orlando
San Antonio
Memphis
New York
Washington, D.C.
Raleigh
Rio de Janeiro
Weingarten Retail
Portfolio
Portfolio
Various locations
1,497,298 Square Feet
Acquired 11/08 - 3/09
95% leased
70%1
Raytheon/DirecTV
El Segundo, CA
550,579 Square Feet
Acquired 3/08
100% leased
Hines REIT Portfolio
(as of September 30, 2010)
(as of September 30, 2010)
1. Italicized percentage numbers represent Hines REIT’s effective ownership in each property listed.

12
San Francisco
Houston
Chicago
Seattle
Atlanta
San Diego
Los Angeles
New York
Richmond
Charlotte
Phoenix
Sacramento
Washington D.C.
499 Park Ave
New York, NY
291,515 Square Feet
Acquired 8/03
92% leased
11%2
425 Lexington Ave
New York, NY
700,034 Square Feet
Acquired 8/03
100% leased
11%2
Riverfront Plaza
Richmond, VA
951,616 Square Feet
Acquired 11/06
95% leased
23%2
Charlotte Plaza
Charlotte, NC
625,026 Square Feet
Acquired 06/07
90% leased
23%2
Carillon
Charlotte, NC
472,644 Square Feet
Acquired 07/07
88% leased
23%2
1200 19th Street
Washington D.C.
337,250 Square Feet
Acquired 8/03
55% leased
11%2
Hines US Core Office Fund Portfolio
(as of September 30, 2010)1
(as of September 30, 2010)1
1. As of September 30, 2010, Hines REIT owned a 27.7% interest in the Hines US Core Office Fund.
2. Italicized percentage numbers represent Hines REIT’s effective ownership in each property listed.

13
One Shell Plaza
Houston, TX
1,230,395 Square Feet
Acquired 5/04
100% leased
11%2
Two Shell Plaza
Houston, TX
565,573 Square Feet
Acquired 5/04
95% leased
11%2
One Atlantic Center
Atlanta, GA
1,100,312 Square Feet
Acquired 7/06
78% leased
23%2
Three First National
Chicago, IL
1,423,515 Square Feet
Acquired 3/05
91% leased
18%2
One North Wacker
Chicago, IL
1,373,754 Square Feet
Acquired 3/08
94% leased
23%2
Renaissance
Square
Square
Phoenix, AZ
965,508 Square Feet
Acquired 12/07
88% leased
23%2
333 West Wacker
Chicago, IL
854,873 Square Feet
Acquired 4/06
72% leased
18%2
101 Second Street
San Francisco, CA
388,370 Square Feet
Acquired 9/04
87% leased
23%2
The KPMG Building
San Francisco, CA
379,328 Square Feet
Acquired 9/04
88% leased
23%2
Golden Eagle Plaza
San Diego, CA
449,181 Square Feet
Acquired 8/05
94% leased
23%2
Warner Center
Los Angeles, CA
808,274 Square Feet
Acquired 10/06
91% leased
18%2
720 Olive Way
Seattle, WA
300,710 Square Feet
Acquired 1/06
76% leased
18%2
Douglas Boulevard
Sacramento, CA
882,636 Square Feet
Acquired 05/07
61% leased
18%2
Wells Fargo Center
Sacramento, CA
502,365 Square Feet
Acquired 05/07
93% leased
18%2
Hines US Core Office Fund Portfolio
(as of September 30, 2010)1
(as of September 30, 2010)1
1. As of September 30, 2010, Hines REIT owned a 27.7% interest in the Hines US Core Office Fund.
2. Italicized percentage numbers represent Hines REIT’s effective ownership in each property listed.

14
REGIONAL MIX1
% OF TOTAL PORTFOLIO—BASED ON PURCHASE PRICE
1. Weighted by Hines REIT’s effective ownership
2. Other consists of Memphis (0.8%), Orlando (0.3%), Raleigh (0.2%), Rio De Janeiro (0.7%), San Antonio (0.2%), San Diego (0.7%) and
Washington D.C. (0.2%)
Washington D.C. (0.2%)
CITY MIX1
% OF TOTAL PORTFOLIO—BASED ON PURCHASE PRICE
East
Midwest
South
San Francisco
Houston
Chicago
Seattle
Atlanta
San Diego
Los Angeles
Washington, DC
New York
Dallas
Sacramento
Miami
Richmond
East Bay
Toronto
Charlotte
Minneapolis
Rio de Janeiro
Phoenix
Kansas City
San Antonio
Orlando
Memphis
Denver
Hines REIT Portfolio Summary - Geographical
Diversification
Diversification
15
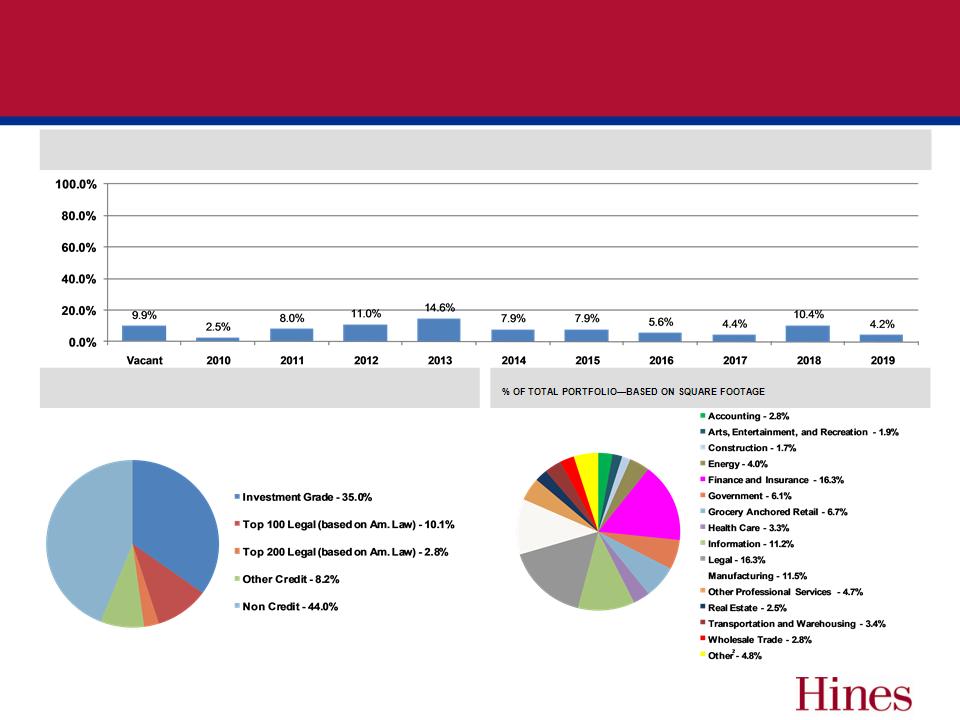
ROLLOVER1
% OF TOTAL LEASABLE SQUARE FEET IN PORTFOLIO
TENANT CREDIT QUALITY1
% OF TOTAL PORTFOLIO—BASED ON SQUARE FOOTAGE
TENANT INDUSTRY MIX1
1. Weighted by Hines REIT’s effective ownership as of 9/30/10
2. Other represents all of the tenant industry mix categories that have less than 1% of the total portfolio
Hines REIT Lease Rollover and Tenant Industry

Hines REIT - Tracking Occupancy
16
Source: NCREIF

17
Finding Success in Challenging Markets
§ San Francisco - 101 Second Street
– Executed a lease with Karum Group for 8,645 SF for a 5-year term. Karum Group, founded in 1988 and based
in San Francisco, offers credit management solutions and is in the business of helping companies issue private
label credit cards.
in San Francisco, offers credit management solutions and is in the business of helping companies issue private
label credit cards.
– Executed a lease for 18,261 SF for a 9-year term with the California Appellate Courts.
§ San Francisco - 55 Second Street
– Executed three leases totaling 10,000 SF with an average lease length of 2.5 years. The tenants represent the
advertising, banking and staffing industries.
advertising, banking and staffing industries.
§ Sacramento - Douglas Boulevard Portfolio
– Executed a renewal and expansion lease with Composite Engineering, Inc. for 42,445 SF for a 2-year term.
Composite Engineering, Inc. offers composite design and manufacturing services.
Composite Engineering, Inc. offers composite design and manufacturing services.
– Executed 13 leases totaling approximately 55,000 SF. No lease exceeds 8,500 SF and the average lease term
is a 4-year lease. These tenants represent the financial, banking and insurance industries.
is a 4-year lease. These tenants represent the financial, banking and insurance industries.
§ Denver - Arapahoe
– Executed a 5-year 43,000 SF lease with Santander Bank; a firm founded in Northern Spain in 1857 with a
history in retail and commercial banking.
history in retail and commercial banking.
§ Charlotte - Carillon
– Executed a 42,000 SF renewal with law firm Cadwalader, Wickersham and Taft, the asset’s largest tenant for a
12-year term. The firm, founded in 1792, is one of the nation's oldest law firms and has a presence in New York,
London, Charlotte, N.C., Washington, D.C., and Beijing .
12-year term. The firm, founded in 1792, is one of the nation's oldest law firms and has a presence in New York,
London, Charlotte, N.C., Washington, D.C., and Beijing .

18
Finding Success in Challenging Markets
§ Charlotte - Charlotte Plaza
– Successfully leased 24,000 SF to Citco, a financial services firm new to the Charlotte market for a 10-year term,
backfilling one of two Wachovia floors that expired in Q1 2010. The Citco Group of Companies is a worldwide
group of independent financial service providers offering hedge fund administration, custody and fund trading,
financial products and corporate and trust planning solutions.
backfilling one of two Wachovia floors that expired in Q1 2010. The Citco Group of Companies is a worldwide
group of independent financial service providers offering hedge fund administration, custody and fund trading,
financial products and corporate and trust planning solutions.
§ New York - 499 Park Avenue
– Executed a 17,500 SF lease with Halstead Property for 15 years. Halstead Property, founded in 1984, is a
residential real estate brokerage firm headquartered in New York City with agents in offices throughout New
York, New Jersey and Connecticut.
residential real estate brokerage firm headquartered in New York City with agents in offices throughout New
York, New Jersey and Connecticut.
– Collected a $1 million payment in connection with the Dreier bankruptcy proceedings which was awarded by the
court. The property had previously drawn down a $15.5 million letter of credit in 2009.
court. The property had previously drawn down a $15.5 million letter of credit in 2009.
§ Chicago - 321 North Clark
– Executed a 15-year lease with the Laborer’s and Retirement Employees’ Annuity and Benefit Fund of Chicago, a
municipal pension fund, for 9,979 SF.
municipal pension fund, for 9,979 SF.
– Executed a 15-year lease with the Municipal Employees’ Annuity and Benefit Fund of Chicago, a municipal
pension fund, for 16,367 SF.
pension fund, for 16,367 SF.

19
Debt Maturity Chart
9/30/10 - Hines REIT
9/30/10 - Hines REIT
WA Rate represents the weighted average rate of the interest on the outstanding loan balance
$224
0
Debt Maturity Chart 9/30/10 - Hines REIT

20
Evaluating Operating Performance
Modified Funds from Operations
§ Modified funds from operations (“MFFO”) is a non-GAAP supplemental financial performance measure that our management uses in evaluating
the operating performance of the Company. It includes funds generated by the operations of our real estate investments and funds used in the
Company’s corporate-level operations. Similar to Funds from Operations (“FFO”), a non-GAAP financial performance measure defined by the
National Association of Real Estate Investment Trusts (“NAREIT”) widely recognized as a measure of operating performance, MFFO excludes
items such as depreciation and amortization. However, changes in the accounting and reporting rules under GAAP that have been put into
effect since the establishment of NAREIT’s definition of FFO have prompted a significant increase in the magnitude of non-cash and non-
operating items included in FFO, as defined. Such items include amortization of certain in-place lease intangible assets and liabilities and the
amortization of certain tenant incentives. MFFO excludes these items, the effects of straight-line rent revenue recognition, fair value
adjustments to derivative instruments that do not qualify for hedge accounting treatment, non-cash impairment charges and certain other items
as described in the footnotes found on slides 22, 23 and 24, and also includes items such as master lease rental receipts, which are excluded
from net income (loss) and FFO, but which we consider in the evaluation of the operating performance of our real estate investments. We
believe that MFFO reflects the overall impact on the performance of our real estate investments of occupancy rates, rental rates, property
operating costs, as well as corporate-level general and administrative expenses and interest costs, which is not immediately apparent from net
income (loss). As such, we believe MFFO, in addition to net income (loss) and cash flows from operating activities as defined by GAAP, is a
meaningful supplemental performance measure and is useful in understanding how the Company’s management evaluates the Company’s
ongoing operating performance.
§ However, MFFO should not be considered as an alternative to net income (loss) or to cash flows from operating activities and is not intended to
be used as a liquidity measure indicative of cash flow available to fund the Company’s cash needs. Additionally, please see the limitations
listed below associated with the use of MFFO as compared to net income (loss):
be used as a liquidity measure indicative of cash flow available to fund the Company’s cash needs. Additionally, please see the limitations
listed below associated with the use of MFFO as compared to net income (loss):
§ MFFO excludes gains (losses) related to changes in estimated values of derivative instruments related to our interest rate swaps. Although
we expect to hold these instruments to maturity, if we were to settle these instruments currently, it would have an impact on our operations.
we expect to hold these instruments to maturity, if we were to settle these instruments currently, it would have an impact on our operations.
§ MFFO excludes the Participation Interest component of the acquisition and asset management fees. Although we believe the settlement of
this liability will be funded using proceeds from the sale of properties in the future, if we were to settle it currently it would have an impact on our
operations.
this liability will be funded using proceeds from the sale of properties in the future, if we were to settle it currently it would have an impact on our
operations.
§ MFFO excludes impairment charges related to long-lived assets that have been written down to current market valuations. Although these
losses are included in the calculation of net income (loss), we have excluded them from MFFO because we believe doing so more
appropriately presents the operating performance of our real estate investments on a comparative basis.
losses are included in the calculation of net income (loss), we have excluded them from MFFO because we believe doing so more
appropriately presents the operating performance of our real estate investments on a comparative basis.
§ MFFO excludes organizational and offering expenses and acquisition expenses payable to our Advisor. Although these amounts reduce net
income, we fund such costs with proceeds from our offerings and acquisition-related indebtedness and do not consider these expenses in the
evaluation of the operating performance of the Company and determining MFFO.
income, we fund such costs with proceeds from our offerings and acquisition-related indebtedness and do not consider these expenses in the
evaluation of the operating performance of the Company and determining MFFO.

21
§ MFFO is used by Senior Management and the Board of Directors to evaluate
operating performance
operating performance
§ The graph below includes MFFO and certain other items we believe may be helpful
in assessing our operating performance results such as gains on the sale of assets
in assessing our operating performance results such as gains on the sale of assets
Evaluating Operating Performance
Ø Cumulative Excess of
MFFO over Shareholder
Distributions is approximately
$20.9 million
MFFO over Shareholder
Distributions is approximately
$20.9 million

Evaluating Operating Performance
22
|
1
|
)
|
Represents the depreciation and amortization of various real estate assets. Historical cost accounting for real estate assets in accordance with GAAP
implicitly assumes that the value of real estate assets diminishes predictably over time. Since real estate values have historically risen or fallen with market conditions, we believe that such depreciation and amortization may be of limited relevance in evaluating current operating performance and, as such, these items are excluded from our determination of MFFO. |
|
2
|
)
|
Represents components of net income (loss) related to the estimated changes in the values of our interest rate swap derivatives. We have excluded these
changes in value from our evaluation of the operating performance of the Company and MFFO because we expect to hold the underlying instruments to their maturity and accordingly the interim gains or losses will remain unrealized. |
|
|
2008
|
2009
|
2010
|
||||||||
|
|
Q1
|
Q2
|
Q3
|
Q4
|
Q1
|
Q2
|
Q3
|
Q4
|
Q1
|
Q2
|
Q3
|
|
Net income (loss)
|
($43,187)
|
$8,837
|
($23,780)
|
($104,213)
|
$3,805
|
$23,549
|
($25,789)
|
$5,120
|
($12,938)
|
($8,419)
|
($28,302)
|
|
Adjustments:
|
|
|
|
|
|
|
|
|
|
|
|
|
Depreciation and amortization(1)
|
25,381
|
32,216
|
32,888
|
32,313
|
31,779
|
31,010
|
31,859
|
31,423
|
28,876
|
27,372
|
28,380
|
|
(Gain) loss on derivative instruments(2)
|
27,445
|
(26,780)
|
10,530
|
74,685
|
(10,896)
|
(35,895)
|
11,701
|
(14,207)
|
5,854
|
24,374
|
15,441
|
|
Participation interest expense (3)
|
4,205
|
4,642
|
3,115
|
6,686
|
(28)
|
4,949
|
3,708
|
3,795
|
3,877
|
3,864
|
3,179
|
|
Impairment on land parcel (4)
|
-
|
-
|
-
|
-
|
-
|
-
|
3,415
|
-
|
-
|
-
|
811
|
|
Other components of revenues and expenses (5)
|
(4,561)
|
(4,137)
|
(3,201)
|
(1,532)
|
(4,896)
|
(3,251)
|
(4,133)
|
(3,402)
|
(2,431)
|
(977)
|
(3,947)
|
|
Master lease rents (6)
|
3,464
|
1,239
|
1,058
|
1,223
|
721
|
479
|
-
|
-
|
-
|
-
|
-
|
|
Gain on sale of investment property (7)
|
-
|
1,695
|
34
|
2,012
|
-
|
-
|
-
|
-
|
(4,225)
|
(18,311)
|
-
|
|
Acquisition fees (8)
|
1,447
|
1,572
|
-
|
8,122
|
1,160
|
-
|
-
|
-
|
-
|
-
|
-
|
|
Organization and offering expenses (9)
|
1,918
|
|
|
|
|
|
|
|
|
|
|
|
Adjustments to equity in losses in unconsolidated
entities, net (10) |
9,779
|
10,502
|
10,335
|
16,425
|
11,313
|
10,624
|
10,264
|
10,133
|
11,243
|
(2,432)
|
9,560
|
|
Adjustments for noncontrolling interests (11)
|
(632)
|
(754)
|
(796)
|
(896)
|
(929)
|
(930)
|
(964)
|
(1,089)
|
(1,013)
|
(892)
|
(917)
|
|
MFFO Attributable to Common Shareholders
|
$25,259
|
$29,032
|
$30,183
|
$32,907
|
$32,029
|
$30,535
|
$30,061
|
$31,773
|
$29,243
|
$24,579
|
$24,205
|
|
MFFO per Common Share
|
$0.15
|
$0.16
|
$0.16
|
$0.17
|
$0.16
|
$0.15
|
$0.14
|
$0.15
|
$0.13
|
$0.11
|
$0.11
|
|
Weighted Average Shares Outstanding
|
165,144
|
178,536
|
192,012
|
183,776
|
201,428
|
204,152
|
210,298
|
207,807
|
218,666
|
220,421
|
221,649
|
|
3
|
)
|
Represents the portion of the acquisition and asset management fees that are paid in equity, which we expect will be settled in the future using proceeds
from the sale of properties or other non-operating sources, and which we therefore do not consider in evaluating the operating performance of the Company and determining MFFO. |

Evaluating Operating Performance
23
|
5
|
)
|
Includes the following components of revenues and expenses that we do not consider in evaluating the operating performance of the Company and
determining MFFO for the three and nine months ended September 30, 2010 and 2009 (in thousands): |
|
|
|
a
|
)
|
Represents the adjustments to rental revenue as required by GAAP to recognize minimum lease payments on a straight-line basis over the
respective lease terms. We have excluded these adjustments from our evaluation of the operating performance of the Company and in determining MFFO because we believe that the rent that is billable during the current period is a more relevant measure of the Company’s operating performance for such period. |
|
|
|
b
|
)
|
Represents the amortization of lease incentives, out-of-market leases and deferred financing costs. As stated in Note 1 above, historical cost
accounting for real estate assets in accordance with GAAP implicitly assumes that the value of real estate assets diminishes predictably over time. Since real estate values have historically risen or fallen with market conditions, we believe that such amortization may be of limited relevance in evaluating current operating performance and, as such, these items are excluded from our determination of MFFO. |
|
4
|
)
|
Represents an impairment charge recorded in accordance with the Property, Plant and Equipment topic of the FASB Accounting Standards Codification.
Although such charges are included in the calculation of net income (loss), we have excluded them from MFFO because we believe doing so more appropriately presents the operating performance of our real estate investments on a comparative basis. |
|
|
2008
|
2009
|
2010
|
||||||||
|
|
Q1
|
Q2
|
Q3
|
Q4
|
Q1
|
Q2
|
Q3
|
Q4
|
Q1
|
Q2
|
Q3
|
|
Other components of revenues and expenses is comprised of:
|
($3,925)
|
($4,653)
|
($4,244)
|
($3,566)
|
($3,440)
|
($1,839)
|
($2,633)
|
($1,523)
|
($1,978)
|
($724)
|
($2,934)
|
|
Straight-line rent adjustment (a)
|
773
|
879
|
1,077
|
1,489
|
1,270
|
1,265
|
1,302
|
1,469
|
1,788
|
1,958
|
2,237
|
|
Amortization of lease incentives (b)
|
(2,055)
|
(1,078)
|
(765)
|
(438)
|
(3,625)
|
(3,628)
|
(3,789)
|
(3,706)
|
(3,196)
|
(3,156)
|
(4,164)
|
|
Amortization of out-of-market leases (b)
|
379
|
412
|
446
|
462
|
522
|
737
|
772
|
752
|
740
|
732
|
701
|
|
Amortization of deferred financing costs (b)
|
267
|
285
|
285
|
539
|
377
|
214
|
215
|
(394)
|
215
|
213
|
213
|
|
Other
|
($4,561)
|
($4,137)
|
($3,201)
|
($1,532)
|
($4,896)
|
($3,251)
|
($4,133)
|
($3,402)
|
($2,431)
|
($977)
|
($3,947)
|

Evaluating Operating Performance
24
|
|
|
|
|
|
6
|
)
|
Includes master lease rents related to master leases entered into in conjunction with certain asset acquisitions. In accordance with GAAP, these rents
are not included in rental revenue; however, we consider this rent in evaluating the operating performance of the Company and determining MFFO. |
|
|
7
|
)
|
Represents the gain on disposition of our real estate investments. Although this gain is included in the calculation of net income (loss), we have
excluded it from MFFO because we believe doing so more appropriately presents the operating performance of our real estate investments on a comparative basis. |
|
|
8
|
)
|
Represents acquisition fees paid to our Advisor that are expensed in our condensed consolidated statements of operations. We fund such costs with
proceeds from our offering and acquisition-related indebtedness, and therefore do not consider these expenses in evaluating the operating performance of the Company and determining MFFO. |
|
|
9
|
)
|
Represents organizational and offering expenses paid to our Advisor that are expensed in our condensed consolidated statements of operations. We
fund such costs with proceeds from our offering and acquisition-related indebtedness, and therefore do not consider these expenses in evaluating the operating performance of the Company and determining MFFO. |
|
|
10
|
)
|
Includes adjustments to equity in losses of unconsolidated entities, net, similar to those described in Notes 1, 4, 5 and 7 above for our unconsolidated
entities, which are necessary to convert the Company's share of income (loss) from unconsolidated entities to MFFO. |
|
|
11
|
)
|
Includes income attributable to non-controlling interests and all adjustments to eliminate the non-controlling interests’ share of the adjustments to
convert the Company’s net income (loss) to MFFO. |
25
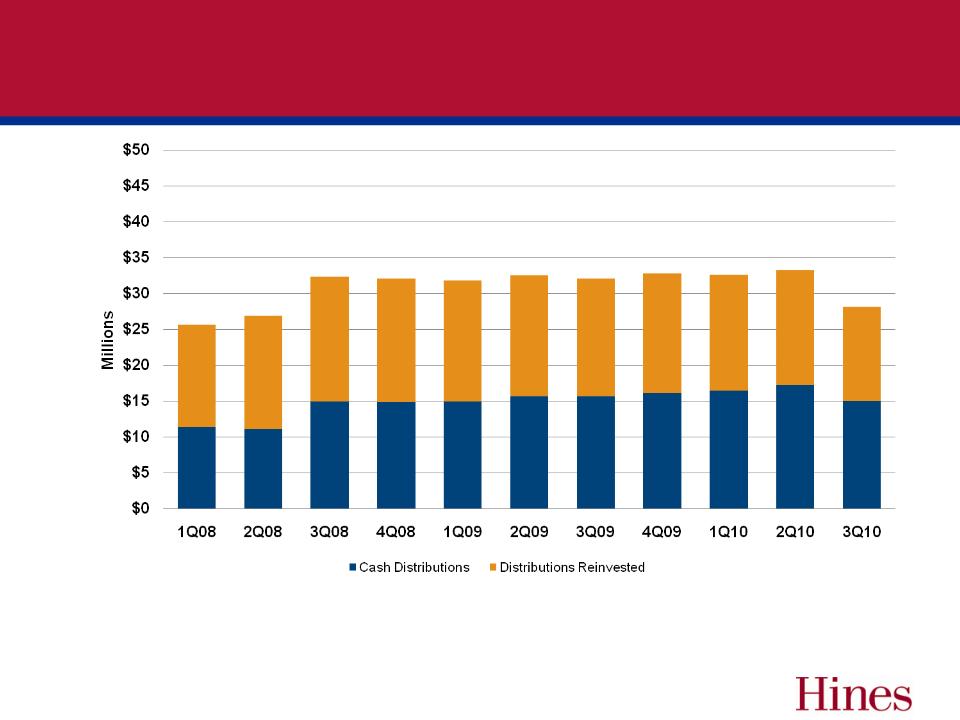
Distribution History - Quarterly in Dollars
We funded our cash distributions with cash flows from operating activities, distributions received from our unconsolidated investments,
proceeds from the sales of our real estate investments and cash generated during prior periods, which had cash flows from operating
activities and distributions received from our unconsolidated investments in excess of distributions.
proceeds from the sales of our real estate investments and cash generated during prior periods, which had cash flows from operating
activities and distributions received from our unconsolidated investments in excess of distributions.

26
Relatively Stable Distribution
Distribution History -
Cents Per Share Paid Quarterly
Cents Per Share Paid Quarterly

Current Priorities & Focus
§ Our Near-Term Priorities Consist of:
– Leasing of Existing Assets in Our Portfolio
– Targeted Asset Sales
– Managing Liquidity & Maximizing Distributions to Shareholders
§ Our Long-Term Priorities Consist of:
– Evaluating Future Capital Raising Alternatives
– Evaluating Potential Exit Strategies
– Managing Our Debt Maturities
§ These Priorities are Designed to Assist Us in Meeting Our
Primary Objective of Maximizing Shareholder Returns
over the Long Term
Primary Objective of Maximizing Shareholder Returns
over the Long Term
27

“Hines began as a one-man operation in 1957
with the sole focus of delivering better quality
services and products to tenants and investors.
More than half a century later, with 3,300
professionals working on four continents, our
philosophy has not wavered and our
commitment to excellence in the built
environment is stronger than ever.”
with the sole focus of delivering better quality
services and products to tenants and investors.
More than half a century later, with 3,300
professionals working on four continents, our
philosophy has not wavered and our
commitment to excellence in the built
environment is stronger than ever.”
Gerald D. Hines
28

Thank You